[Preprint]. 2024 Mar 9:2024.03.08.583134.
doi: 10.1101/2024.03.08.583134.

Molecular Mimicry as a Mechanism of Viral Immune Evasion and Autoimmunity

Affiliations

Molecular Mimicry as a Mechanism of Viral Immune Evasion and Autoimmunity

Cole Maguire et al. bioRxiv. .

Update in

Abstract

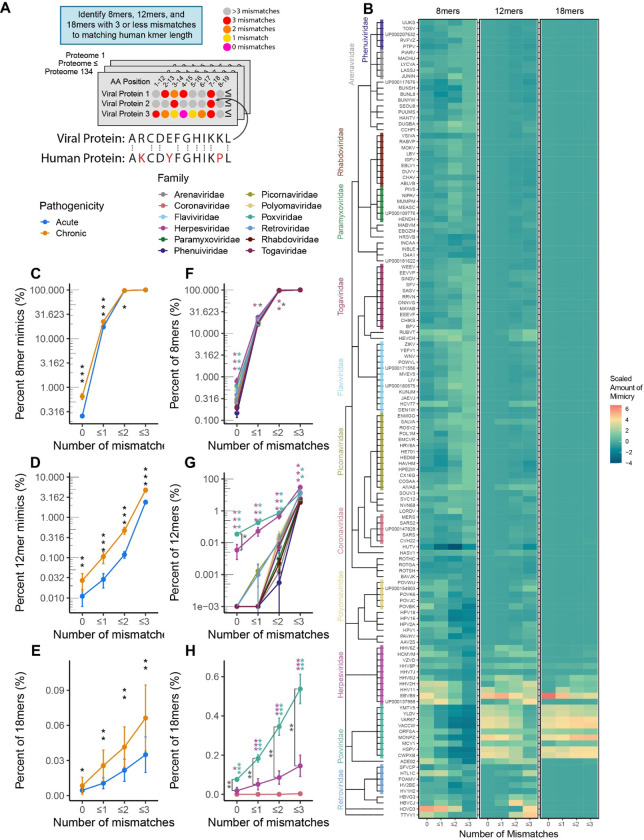
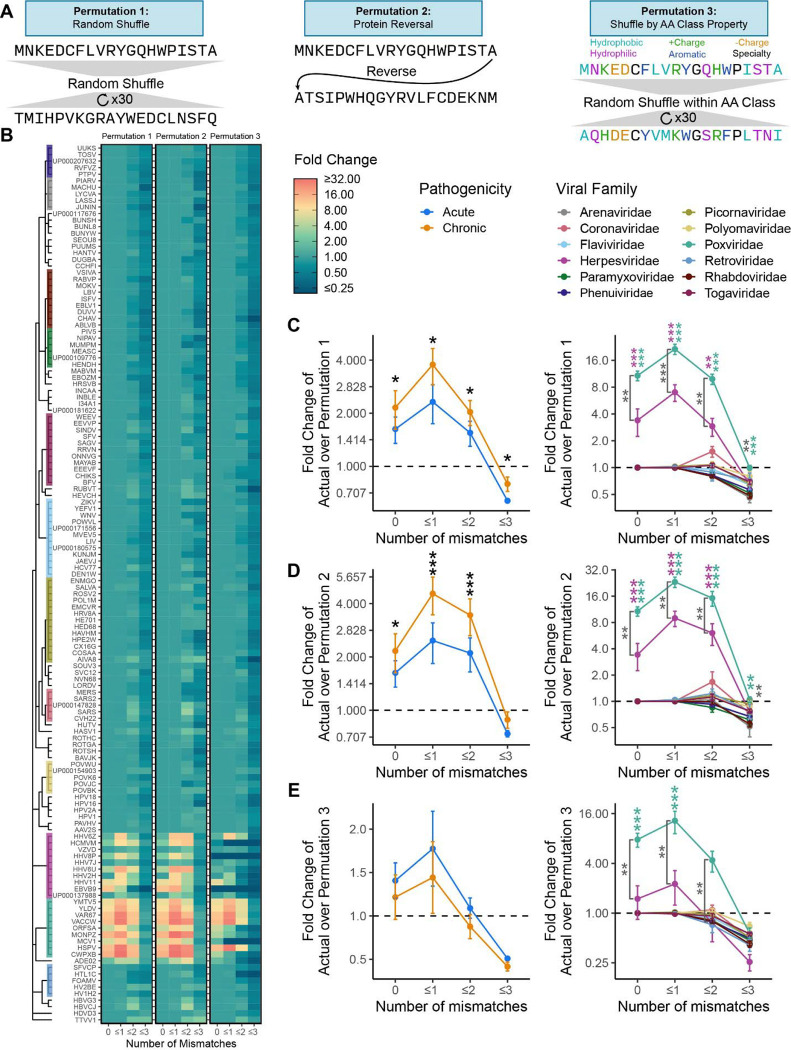
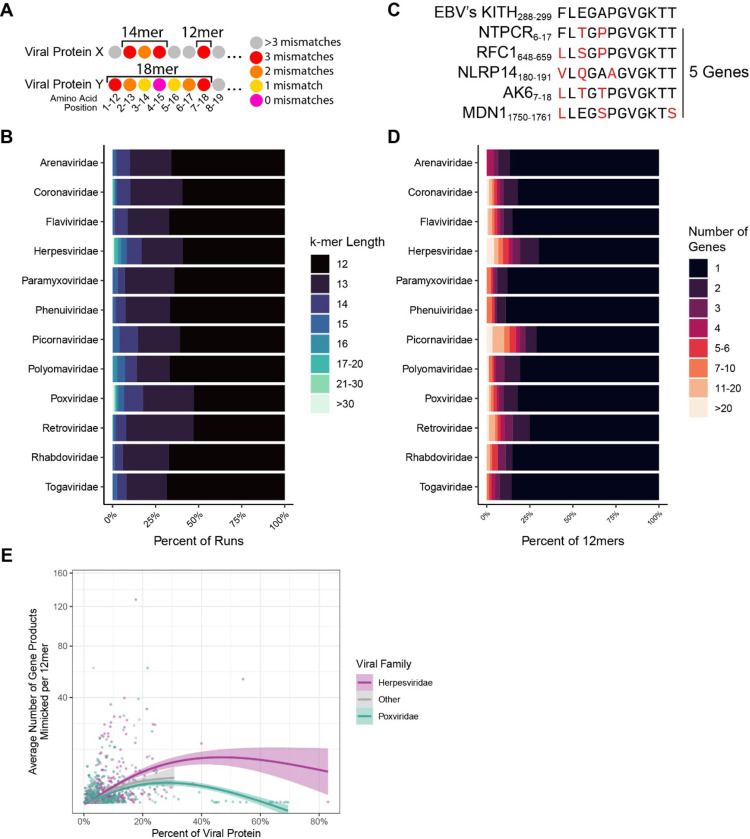
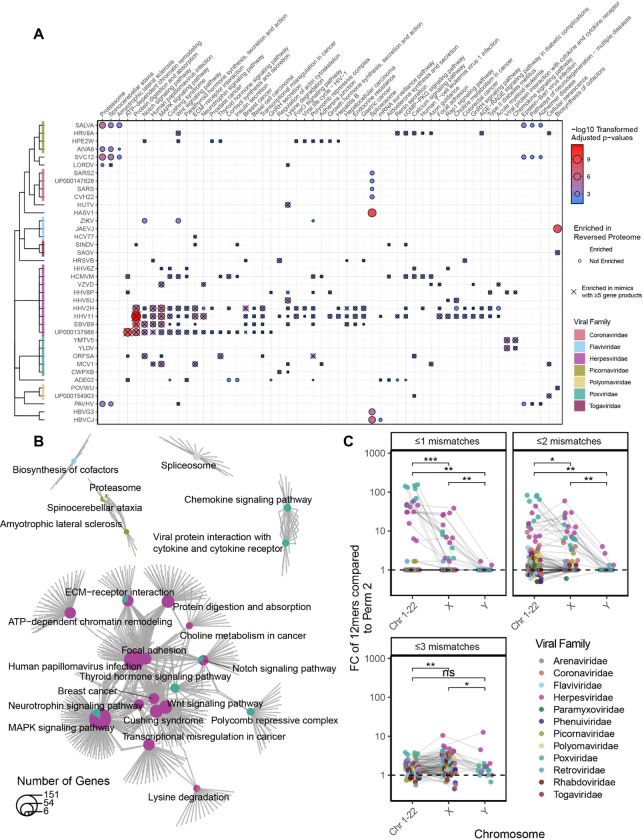
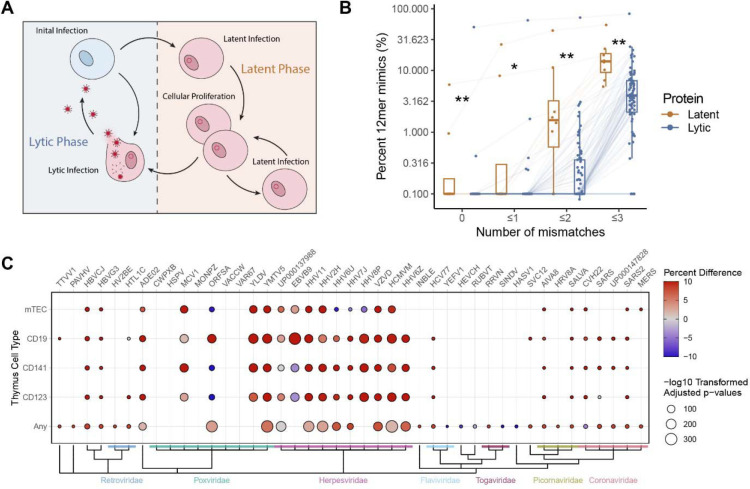
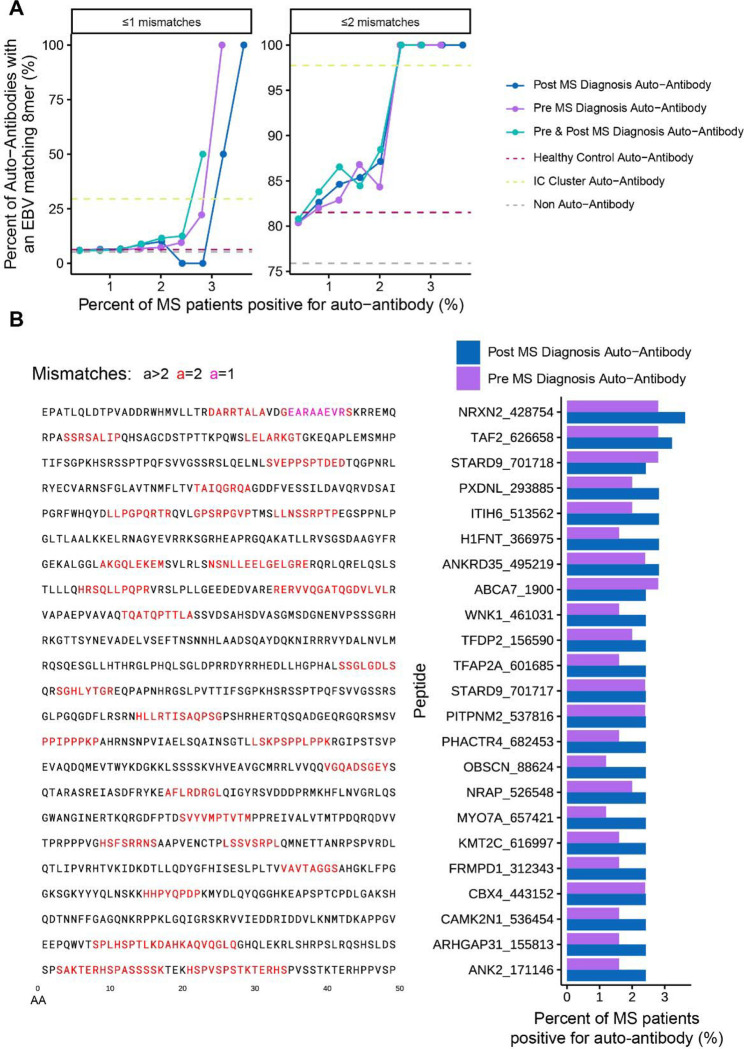
Mimicry of host protein structures ("molecular mimicry") is a common mechanism employed by viruses to evade the host's immune system. To date, studies have primarily evaluated molecular mimicry in the context of full protein structural mimics. However, recent work has demonstrated that short linear amino acid (AA) molecular mimics can elicit cross-reactive antibodies and T-cells from the host, which may contribute to development and progression of autoimmunity. Despite this, the prevalence of molecular mimics throughout the human virome has not been fully explored. In this study, we evaluate 134 human infecting viruses and find significant usage of linear mimicry across the virome, particularly those in the herpesviridae and poxviridae families. Furthermore, we identify that proteins involved in cellular replication and inflammation, those expressed from autosomes, the X chromosome, and in thymic cells are over-enriched in viral mimicry. Finally, we demonstrate that short linear mimicry from Epstein-Barr virus (EBV) is significantly higher in auto-antibodies found in multiple sclerosis patients to a greater degree than previously appreciated. Our results demonstrate that human-infecting viruses frequently leverage mimicry in the course of their infection, point to substantial evolutionary pressure for mimicry, and highlight mimicry's important role in human autoimmunity. Clinically, our findings could translate to development of novel therapeutic strategies that target viral infections linked to autoimmunity, with the goal of eliminating disease-associated latent viruses and preventing their reactivation.


Conflict of interest statement

Ethics declarations / Competing interests CM, CW, AR, CF, BM, NL, and DW have nothing to disclose. EM has received research funding from Babson Diagnostics, honorarium from Multiple Sclerosis Association of America and has served on advisory boards of Genentech, Horizon, Teva and Viela Bio.

Figures

Figure 1 –
Figure 1 –. Molecular mimicry across human infecting viruses.
A) Experimental Schema and example of 12mer AA proteomic alignment. In total, 134 human-infecting viral proteomes were screened to identify 8mer, 12mer, and 18mer AA k-mers with 3 or less mismatches to a matching human k-mer. B) Heatmap of scaled percentages of mimicry for 8mers, 12mers, and 18mers with 3 or less mismatches, with viruses aligned by taxonomy. Percents of k-mers, were scaled separetly for each mismatch and k-mer length combination. Percentage of viral C) 8mers, D) 12mers, and E) 18mers with 0, ≤1, ≤2, and ≤3 mismatches between acute and chronically infecting viruses. Percentage of viral F) 8mers, G) 12mers, and H) 18mers with 0, ≤1, ≤2, and ≤3 mismatches between different viral families. Viral familes only shown in F-H if containing at least 5 species. (Black stars indicate comparisons between chronic and acute viruses, magenta and green stars indicate comparisons of the Herpesviruses and Poxviruses against all other viruses, dark gray stars indicate comparison between Herpesviruses and Poxviruses. Kruskal-Wallis test was used for multigroup comparison, and Wilcoxon rank-sum test for pairwise comparison. Error bars denote mean ± standard error of the mean. All p values adjusted for multiple hypothesis testing using Benjamini-Hochberg corrections (* p.adj ≤ 0.05, ** p.adj ≤ 0.01, *** p.adj ≤ 0.001)).
Figure 2 –
Figure 2 –. Permutation confirms significant mimicry in poxviruses and herpesviruses.
A) Example schema of the three permutation strategies (random, protein reversal, AA class shuffle). B) A heatmap of the fold change of actual mimicry over mimicry in permutations 1–3, aligned by viral taxonomy. Results of the C) random permutation (permutation 1), D) protein reversal permutation (permutation 2), and E) AA class shuffle permutation (permutation 3) for chronic vs acute viruses and by viral family. Viral familes only shown in C-E if containing at least 5 species. (Black stars indicate comparisons between chronic and acute viruses, magenta and green stars indicate comparisons of the Herpesviruses and Poxviruses against all other viruses, dark gray stars indicate comparison between Herpesviruses and Poxviruses. Kruskal Wallis test was used for multigroup comparison, and Wilcoxon rank-sum test for pairwise comparison. Error bars denote mean ± standard error of the mean. All p values adjusted for multiple hypothesis testing using Benjamini-Hochberg corrections (* p.adj ≤ 0.05, ** p.adj ≤ 0.01, *** p.adj ≤ 0.001)).
Figure 3 –
Figure 3 –. Viral mimicry is diverse in length and differentially targets human protein motifs.
A) An example of an 18mer and 14mer comprised of 12mers. B) Average percent of mimics at varying k-mer lengths. C) An example of multi-mapping in which a single viral 12mer aligns to multiple human proteins with the criteria of 3 or less mismatches. D) Percent of viral 12mers and their corresponding number of mimicked human genes (multi-mapping). E) Average number of host gene products mimicked, plotted against the percent of the viral protein that participates in mimicry (defined as a 12mer with 3 or less mismatches).
Figure 4 –
Figure 4 –. Viral mimicry targets vulnerable biological pathways.
A) Hypergeometric enrichment testing of KEGG pathways for human proteins that are mimicked by each virus. Significant enrichment is displayed as a dot and is outlined if that biological enrichment was not observed in the reverse proteome permutation (permutation 2). Only pathways significant in at least 3 viruses are shown, with all viruses and significant pathways shown in Figure S4. B) Shared overlap between the significant pathway from (A) reveal broad roles of inflammation and cellular replication amongst the pathways. Pathways and genes are represented by a pie chart, colored by the proportion of viruses belonging to each family that were significantly enriched for the pathway, with lines connecting genes to their respective pathways. C) Fold change of the percent of mimics whose human conterpart is encoded on either an autosome (Chromosomes 1–22), X, or Y chromosome over the rate in the reversed proteome (permutation 2). (Hypergeometric enrichment used for pathway analysis. Wilcoxon summed-rank test used for paired pairwise comparison. All p values adjusted for multiple hypothesis testing using Benjamini-Hochberg corrections (* p.adj ≤ 0.05, ** p.adj ≤ 0.01, *** p.adj ≤ 0.001)).
Figure 5 –
Figure 5 –. EBV latent proteins have elevated mimicry and viral mimicry targets negatively selected proteins.
A) Schematic of latent vs lytic stages of viral replication. B) Percent of 12mers with 0, ≤1, ≤2, and ≤3 mismatches in latent and lytic EBV proteins. Each point denotes a single EBV protein connected across the mismatch levels with boxplots denoting the interquartile range. C) Fisher test results of the proportion of mimics (12mers ≤2 mismatches) to proteins identified previously as expressed in mTEC, CD19+ B-cells, CD141+ dendritic cells, CD123+ dendritic cells, or “any” of these cells in the human thymus (all antigen presenting cells), compared to the proportion of all human proteins expressed by these cell types (as determined by RNA expression in Gabrielsen et al.). Color indicates the percent difference between the percent of mimicked proteins expressed in the thymus and the rate of all human proteins expressed in the thymus.
Figure 6 –
Figure 6 –. EBV mimics are more frequent in MS auto-antibodies.
A) Frequency of EBV mimicry (defined as EBV 8mers with ≤1 (left) or ≤2 mismatches (right)) in autoantibody targets in MS patients pre and post diagnosis. Dotted lines show the rate of peptides with an EBV mimic for auto-antibodies found in either in no participannt, in healthy controls, or in the previously identified IC Cluster (Zamecnik et al.). B) Left: Peptide sequences of the top non-IC Cluster and most frequent post MS diagnosis auto-antibodies. Right: Percentage of MS patients positive for the top non-IC Cluster auto-antibodies at both the pre and post diagnosis timepoints.

Similar articles

References

    1. Tortorella D., Gewurz B. E., Furman M. H., Schust D. J. & Ploegh H. L. Viral subversion of the immune system. Annu Rev Immunol 18, 861–926 (2000). - PubMed
    1. Gowthaman U. & Eswarakumar V. P. Molecular mimicry. Virulence 4, 433–434 (2013). - PMC - PubMed
    1. Chen J. W. et al. Positive and negative selection shape the human naive B cell repertoire. J Clin Invest 132, e150985 (2022). - PMC - PubMed
    1. Palmer E. Negative selection--clearing out the bad apples from the T-cell repertoire. Nat Rev Immunol 3, 383–391 (2003). - PubMed
    1. Cusick M. F., Libbey J. E. & Fujinami R. S. Molecular mimicry as a mechanism of autoimmune disease. Clin Rev Allergy Immunol 42, 102–111 (2012). - PMC - PubMed

Publication types