[Preprint]. 2025 May 1:2024.03.05.583602.
doi: 10.1101/2024.03.05.583602.

Lipid Peroxidation and Type I Interferon Coupling Fuels Pathogenic Macrophage Activation Causing Tuberculosis Susceptibility

Affiliations

Lipid Peroxidation and Type I Interferon Coupling Fuels Pathogenic Macrophage Activation Causing Tuberculosis Susceptibility

Shivraj M Yabaji et al. bioRxiv. .

Abstract

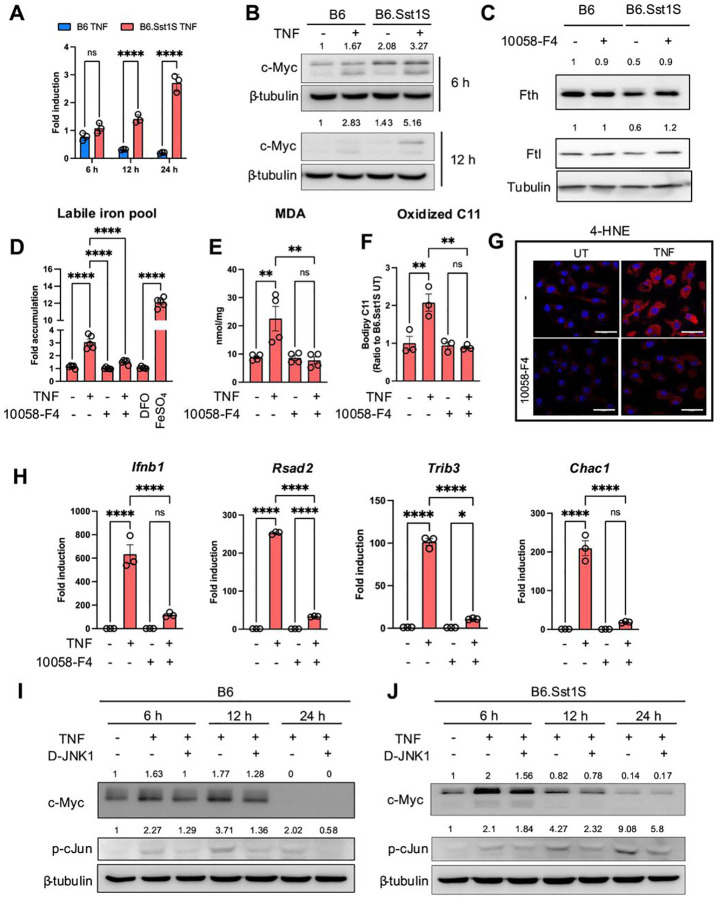
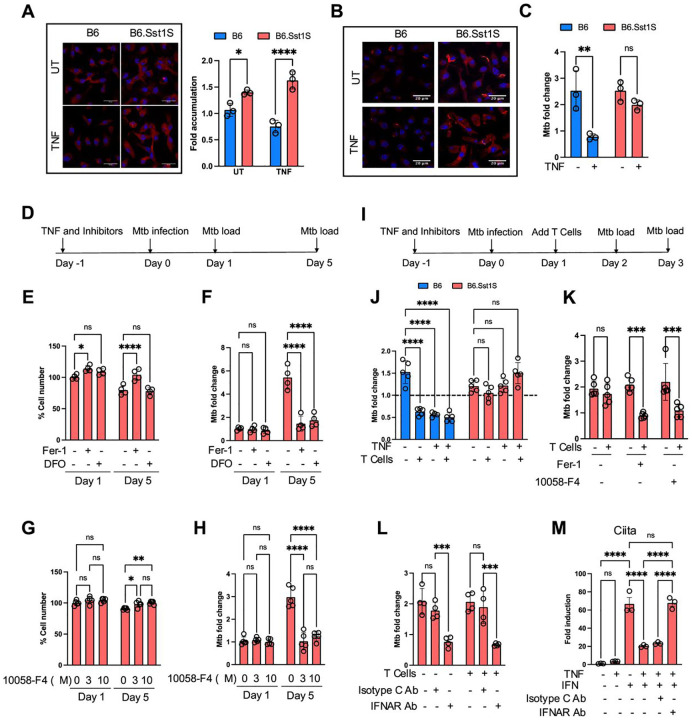
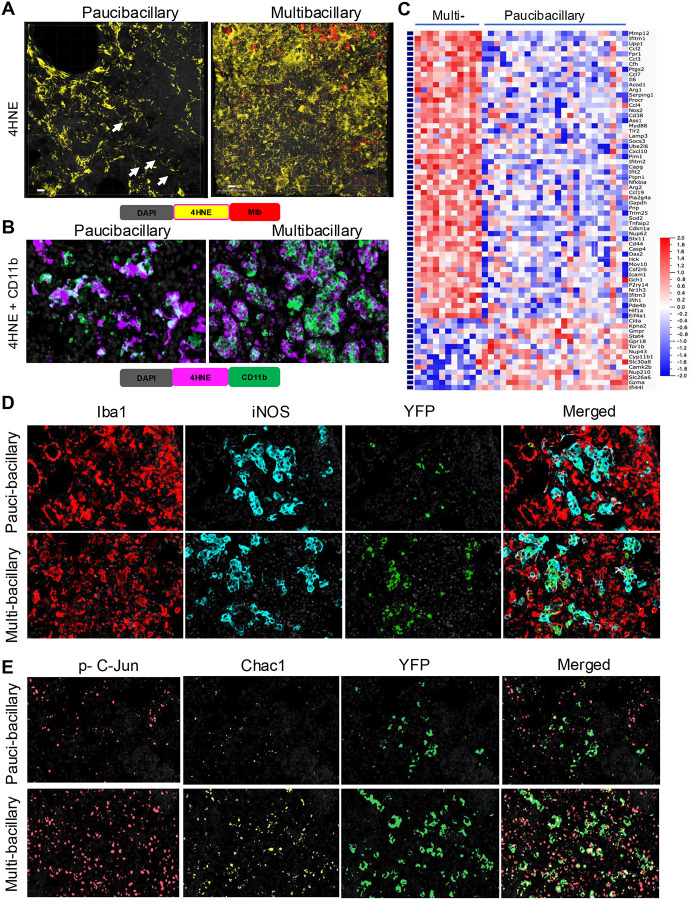
A quarter of human population is infected with Mycobacterium tuberculosis, but less than 10% of those infected develop pulmonary TB. We developed a genetically defined sst1-susceptible mouse model that uniquely reproduces a defining feature of human TB: the development of necrotic lung granulomas and determined that the sst1-susceptible phenotype was driven by the aberrant macrophage activation. This study demonstrates that the aberrant response of the sst1-susceptible macrophages to prolonged stimulation with TNF is primarily driven by conflicting Myc and antioxidant response pathways leading to a coordinated failure 1) to properly sequester intracellular iron and 2) to activate ferroptosis inhibitor enzymes. Consequently, iron-mediated lipid peroxidation fueled Ifnβ superinduction and sustained the Type I Interferon (IFN-I) pathway hyperactivity that locked the sst1-susceptible macrophages in a state of unresolving stress and compromised their resistance to Mtb. The accumulation of the aberrantly activated, stressed, macrophages within granuloma microenvironment led to the local failure of anti-tuberculosis immunity and tissue necrosis. The upregulation of Myc pathway in peripheral blood cells of human TB patients was significantly associated with poor outcomes of TB treatment. Thus, Myc dysregulation in activated macrophages results in an aberrant macrophage activation and represents a novel target for host-directed TB therapies.

Keywords: Myc; antioxidant defense; inflammation; lipid peroxidation; macrophage; tuberculosis; type I interferon.


Conflict of interest statement

Declaration of interests: The authors have declared that no conflict of interest exists.

Figures

Figure 1.
Figure 1.. Single cell RNAseq analysis of the population dynamics of B6 and B6.Sst1S macrophages after TNF stimulation
(A). Connectivity of antioxidant defense (AOD) with the Myc-, Nrf2-, JNK-, and IFN-I-regulated pathways: 1) stress kinase activation by oxidative stress; 2) promotion of IFN-I responses by stress kinases; 3) suppression of AOD by IFN-I; 4) inhibition of Nrf2, AOD and IFN responses by Myc. (B and C). scRNA-seq analysis (UMAP and individual clusters) of B6 (R) and B6.Sst1S (S) BMDMs either naïve (R and S) or after 24 h of stimulation with TNF (RT and ST, respectively). (D). Expression of the sst1-encoded Sp110 and Sp140 genes in the population of either naïve (R) or TNF-stimulated (RT) B6 BMDMs. (E). Heatmap showing differentially expressed pathways in all cell clusters identified using scRNA-seq. Rows represent pathways and columns represent individual clusters with color intensity indicating the relative expression. (F). Reconstruction of the activation trajectories of TNF-stimulated resistant (RT) and susceptible (ST) macrophage populations using pseudotime analysis. magenta line indicates B6 and green line indicates B6.Sst1S BMDMs. (G). Heatmap showing differentially expressed pathways in subpopulations 1 to 5 identified using pseudotime analysis. Rows represent pathways and columns represent individual subpopulations with color intensity indicating the relative expression. (H). Pathway heatmap representing transition from subpopulation 2 to unique subpopulation 3 in TNF-stimulated B6 macrophages. (I). The Sp110 and Sp140 gene regulatory network analysis. The mouse macrophage gene regulatory network was inferred using GENIE3 algorithm from mouse macrophages gene expression data sets obtained from Gene Expression Omnibus (GEO). First neighbors of Sp110/Sp140 genes were selected to infer a subnetwork of Sp110/Sp140 co-regulated genes. Green nodes represent transcription factors, blue nodes denote their potential targets.
Figure 2:
Figure 2:. Gene expression profiling comparing B6 and B6.Sst1.S BMDMs stimulated with TNF and regulation of NRF2.
(A). Total level of Nrf2 protein in B6 and B6.Sst1S BMDMs stimulated with TNF (10 ng/ml) for 8, 12 and 24 h (Western blotting). Average densitometric values from 2 independent experiment were included above the blot. (B). Cytoplasmic Nrf2 and Bach1 proteins in B6 and B6.Sst1S BMDMs stimulated with TNF (10 ng/ml) for 8 and 12 h (Western blotting). Average densitometric values from 2 independent experiment were included above the blot. (C). Nuclear Nrf2 and Bach1 protein levels in B6 and B6.Sst1S BMDMs treated with TNF (10 ng/ml) for 8 and 12 h (Western blotting). Average densitometric values from 2 independent experiment were included above the blot. (D and E). Confocal microscopy of Nrf2 protein in B6 and B6.Sst1S BMDMs stimulated with TNF (10 ng/ml) for 12 h (scale bar 20 μm). The data shows staining with Nrf2-specific antibody and performed area quantification using ImageJ to calculate the Nrf2 total signal intensity per field. Each dot in the graph represents the average intensity of 3 fields in a representative experiment. The experiment was repeated 3 times. (F). B6 and B6.Sst1S BMDMs were stimulated with TNF (10 ng/ml) for 8 h. The Nfe2l2 mRNA levels were quantified using quantitative RT-PCR. Fold induction was calculated by DDCt method, and b-actin was used as internal control and normalized the fold change using B6 UT. (G and H). The Nrf2 protein stability in TNF-stimulated (10 ng/ml) B6 and B6.Sst1S BMDMs. BMDMs were stimulated with TNF. After 6 h, 25 μg/ml of cycloheximide (CHX) was added and cells were harvested after 15, 30, 45, 60, 90, ad 120 min. The Nrf2 protein levels after TNF stimulation and degradation after cycloheximide addition were determined by Western blotting. I - Linear regression curves of Nrf2 degradation after addition of CHX. Band intensities were measured by densitometry using ImageJ. No significant difference in the Nrf2 half-life was found: B6: 15.14 ± 2.5 min and B6.Sst1S: 13.35 ± 0.6 min. (I). Nuclear Nrf2 binding to target sequence. Nuclear extracts were prepared from BMDMs treated with TNF (10 ng/ml) for 8 and 12 h. The binding activity of Nrf2 was monitored by EMSA using biotin conjugated Nrf2 specific probe (hot probe, red frames). Competition with the unconjugated NRF2 probe (cold probe) was used as specificity control. (J). Anti-oxidant genes co-regulated with Sp110 and Sp140 after stimulation with TNF (10 ng/ml) for 12 h. The heatmap was generated using FPKM values obtained from RNA-seq expression profiles of B6.Sst1S and B6 BMDMs after 12 h of TNF stimulation. The data are presented as means ± standard deviation (SD) from three-five samples per experiment, representative of three independent experiments. The statistical significance was performed by two-way ANOVA using Tukey’s multiple comparison test (Panel E, F). Significant differences are indicated with asterisks (*, P < 0.05; **, P < 0.01; ***, P < 0.001; ****, P < 0.0001).
Figure 3.
Figure 3.. Regulation of iron and lipid peroxidation in B6 and B6.Sst1.S BMDMs.
(A and B). The expression of Fth and Ftl genes in B6 and B6.Sst1S BMDMs treated with 10 ng/mL TNF for 12 and 24 h was determined using qRT-PCR. Fold induction was calculated normalizing with B6 untreated control using ΔΔCt method, and 18S was used as internal control. (C). The Fth and Ftl protein levels in B6 and B6.Sst1S BMDMs treated with 10 ng/mL TNF for 0, 12 and 24 h (Fth) and 0, 8, 12 and 24 h (for Ftl) (Western blot). Average densitometric values from 3 independent experiment were included above the blot. (D). The Gpx1 and Gpx4 protein levels in B6 and B6.Sst1S BMDMs stimulated with TNF (10 ng/mL) for 0, 6, 12, and 24 h (Western blot). Average densitometric values from 2 independent experiment were included above the blot. (E). The labile iron pool (LIP) in TNF-stimulated B6 and B6.Sst1S BMDMs from were treated with 10 ng/mL TNF for 24 h. UT - untreated control. The LIP was determined using Calcein AM method and represented as fold change as compared to B6 untreated. DFO was used as negative control and FeSo4 was used as positive control. (F). The lipid peroxidation levels were determined by fluorometric method using C11-Bodipy 581/591. BMDMs from B6 and B6.Sst1S were treated with 10 ng/mL TNF for 30 h. UT - untreated control. (G). Production of lipid peroxidation metabolite malondialdehyde (MDA) by B6 and B6.Sst1S BMDMs treated with 10 ng/mL TNF for 30 h. UT - untreated control. (H). The accumulation of the intracellular lipid peroxidation product 4-HNE in B6 and B6.Sst1S BMDMs treated with 10 ng/mL TNF for 48 h. The lipid peroxidation (ferroptosis) inhibitor, Fer-1 (10 μM) was added 2 h post TNF stimulation in B6.Sst1S macrophages. The 4HNE accumulation was detected using 4-HNE specific antibody and confocal microscopy. (I). Reactive oxygen species (ROS) levels were observed using the CellROX assay and quantified by automated microscopy in B6 and B6.Sst1S BMDMs either treated with TNF (10 ng/mL) or left untreated for 36 h. BHA (100 μM) was used as a positive control. Data are presented as fold mean fluorescence intensity (MFI) normalized by B6 UT, representing ROS levels. (J). Time course of ROS accumulation in B6 and B6.Sst1S BMDMs during TNF stimulated condition. Reactive oxygen species (ROS) levels were observed using the CellROX assay after 0, 6, 24 and 36 h of TNF stimulation and quantified by automated microscopy. (K). Induction of c-Jun and ASK1 phosphorylation by TNF in B6 and B6.Sst1S BMDMs. The B6 and B6.Sst1S BMDMs were treated with TNF (10 ng/ml) or left untreated for 12, 24, and 36 h and the c-Jun and ASK1 phosphorylation was determined by Western blot. Average densitometric values from 2 independent experiment were included above the blot. (L). Cell death in B6 and B6.Sst1S BMDMs stimulated with 50 ng/mL TNF for 48 h. Percent of dead cells was determined by automated microscopy using Live-or-DyeTM 594/614 Fixable Viability stain (Biotium) and Hoechst staining. (M). Inhibition of cell death of B6.Sst1S BMDMs stimulated with 50 ng/mL TNF for 48 h using IFNAR1 blocking antibodies (5 μg/mL), isotype C antibodies (5 μg/mL), Butylated hydroxyanisole (BHA, 100 μM) or Fer-1 (10 μM). Percent cell death was measured as in L. The data are presented as means ± standard deviation (SD) from three-five samples per experiment, representative of three independent experiments. Statistical analysis was performed using two-way ANOVA followed by Šídák’s multiple comparison test (Panels A, B, F, G and M) and Tukey’s multiple comparison test (Panel E, I, J, L). Statistical significance is indicated by asterisks: *P < 0.05, **P < 0.01, ***P < 0.001, ****P < 0.0001.
Figure 4.
Figure 4.. Crosstalk of the IFN-I and AOD pathways.
(A) IFNAR1 blockade does not enhance Nrf2 upregulation in TNF-stimulated B6.Sst1S macrophages. B6 and B6.Sst1S BMDMs were treated with 10 ng/mL TNF, with or without IFNAR1-blocking antibodies or isotype control (Isotype C Ab) at 5 μg/mL concentration for 4, 8, and 12 hours. Nrf2 protein levels were quantified by Western blot. Average densitometric values from two separate experiments were included above the blot. (B) IFNAR1 blockade does not increase Ftl expression in TNF-stimulated B6.Sst1S macrophages. B6.Sst1S BMDMs were treated with 10 ng/mL TNF, with or without IFNAR1-blocking antibodies (5 μg/mL) or Isotype C Ab (5 μg/mL), for 8 and 12 hours. Ftl protein levels were quantified by Western blot. Average densitometric values from 2 independent experiment were included above the blot. (C) IFNAR1 blockade does not increase mRNA levels of Fth, Ftl, and Gpx1. B6 and B6.Sst1S BMDMs were treated with 10 ng/mL TNF, with or without IFNAR1-blocking antibodies or Isotype C Ab, for 12 hours. Blocking antibodies (5 μg/mL) or isotype C antibodies (5 μg/mL) were added 2 hours after TNF stimulation. Fold induction was calculated using B6 untreated control as average one-fold by utilizing the ΔΔCt method with β-actin as the internal control. (D and E) IFNAR1 blockade reduces Rsad2 mRNA levels (E) but does not affect Ifnb1 mRNA levels (D). B6 and B6.Sst1S BMDMs were treated with 10 ng/mL TNF, with or without IFNAR1-blocking antibodies or Isotype C Ab for 16 hours. Blocking antibodies (5 μg/mL) or isotype C antibodies (5 μg/mL) were added 2 hours after TNF stimulation. Fold induction was calculated using B6 untreated control as average one-fold by utilizing the ΔΔCt method with β-actin as the internal control. (F) Lipid peroxidation inhibition prevents the superinduction of Ifnb1 mRNA. B6.Sst1S BMDMs were treated with 10 ng/mL TNF, and the lipid peroxidation inhibitor (Fer-1) was added 2 hours post-TNF stimulation. Ifnb1 mRNA levels were measured using qRT-PCR after 16 hours of TNF treatment. Fold induction was calculated using untreated control as average one-fold by utilizing the ΔΔCt method with 18S as the internal control. (G) Lipid peroxidation inhibition reverses the superinduction of Ifnb1 mRNA. B6.Sst1S BMDMs were stimulated with 10 ng/mL TNF for 18 h, then the LPO inhibitor (Fer-1) was added for the remaining 12 h. Ifnb1 mRNA levels were measured using qRT-PCR. Fold induction was calculated using untreated control as average one-fold by utilizing the ΔΔCt method with 18S as the internal control. (H and I) IFNAR1 blockade reduces 4-HNE accumulation in B6.Sst1S BMDMs treated with TNF (10 ng/mL) for 48 hours. Blocking antibodies (5 μg/mL) or Isotype C Ab (5 μg/mL) were added 2 hours post-TNF stimulation. The data are presented as means ± standard deviation (SD) from three-five samples per experiment, representative of three independent experiments. The statistical significance was performed by two-way ANOVA using Tukey’s multiple comparison test (Panel C-E), Ordinary one-way ANOVA using Bonferroni’s multiple comparison test (Panel F-G and I). Significant differences are indicated with asterisks (*, P < 0.05; **, P < 0.01; ***, P < 0.001; ****, P < 0.0001).
Figure 5.
Figure 5.. Myc dysregulation drives the aberrant state of macrophage activation
(A). The lack of Myc mRNA downregulation after prolonged TNF stimulation in B6.Sst1S macrophages. BMDMs from B6 and B6.Sst1S were treated with 10 ng/mL TNF for 6, 12 and 24 h. Expression of Myc was quantified by the ΔΔCt method using qRT-PCR and expressed as a fold induction compared to the untreated B6 BMDMs. β-actin was used as the internal control. (B). Myc protein levels expressed by B6 and B6.Sst1S BMDMs during the course of stimulation with TNF(10 ng/mL) for 6 and 12 h. (Western blot). Average densitometric values from 2 independent experiment were included above the blot. (C). Myc inhibition restored the levels of Fth and Ftl proteins in TNF-stimulated B6.Sst1S macrophages to the B6 levels. B6 and B6.Sst1S BMDMs from were treated with 10 ng/mL TNF alone or in combination with Myc inhibitor, 10058-F4 (10 μM) for 24 h. 10058-F4 was added 2 h post TNF stimulation. Protein levels of Fth and Ftl were observed using Western blot. Average densitometric values from 2 independent experiment were included above the blot. (D). Myc inhibition decreased the labile iron pool in TNF-stimulated B6.Sst1S macrophages. B6.Sst1S BMDMs were treated with 10 ng/mL TNF or left untreated for 48 h. The 10058-F4 inhibitor was added 2 h post TNF stimulation. The labile iron pool (LIP) was measured using Calcein AM method and represented as fold change as compared to untreated control. DFO was used as negative control and FeSo4 was used as positive control. (E and F). Myc inhibition reduced lipid peroxidation in TNF-stimulated B6.Sst1S BMDMs. Cells were treated with 10 ng/mL TNF in presence or absence of 10058-F4 for 48 h. The inhibitor was added 2 h post TNF stimulation. The MDA production was measured using commercial MDA assay (E). The lipid peroxidation was measured by fluorometric method using C11-Bodipy 581/591 (F). (G). B6.Sst1S BMDMs were treated as above in E. The accumulation of lipid peroxidation product, 4HNE after 48h was detected by confocal microscopy using 4-HNE specific antibody. The 4HNE accumulation was quantified using ImageJ and plotted as fold accumulation compared to untreated group. (H). The BMDMs from B6.Sst1S were treated with 10 ng/mL TNF alone or in combination with Myc inhibitor, 10058-F4 (10 μM) for 24 h. 10058-F4 was added 2 h post TNF stimulation. Expression of Ifnb1, Rsad2, Trib3 and Chac1 was quantified by the ΔΔCt method using qRT-PCR and expressed as a fold induction compared to the untreated group. 18S was used as the internal control. (I and J). B6 (I) and B6.Sst1S (J) BMDMs were treated with TNF (10 ng/ml) for 6, 12, and 24 h in the presence or absence of JNK inhibitor D-JNK1 (2 μM). The cells were harvested and the protein levels of c-Myc and p-cJun were determined by western blotting. JNK inhibitor D-JNK1 was added 2 h post TNF stimulation. Average densitometric values from 2 independent experiment were included above the blot. The data are presented as means ± standard deviation (SD) from three-five samples per experiment, representative of three independent experiments. The statistical significance was performed by two-way ANOVA using Šídák’s multiple comparison test (Panel A) and ordinary one-way ANOVA using Šídák’s multiple comparison test (Panel D-F and H). Significant differences are indicated with asterisks (*, P < 0.05; **, P < 0.01; ***, P < 0.001; ****, P < 0.0001).
Figure 6.
Figure 6.. Myc and lipid peroxidation compromise control of intracellular Mtb by the B6.Sst1S macrophages.
(A). Accumulation of 4-HNE in Mtb-infected B6 and B6.Sst1S macrophage monolayers infected with Mtb. BMDMs were either treated with 10 ng/mL TNF or left untreated (UT), and subsequently infected with Mtb at MOI=1. 4-HNE was detected by confocal microscopy using 4-HNE specific antibody 5 dpi. The 4HNE accumulation was quantified at 5 dpi using ImageJ and plotted as fold accumulation compared to untreated B6 (UT). (B). Naïve and TNF-stimulated B6 and B6.Sst1S BMDMs were infected with Mtb Erdman reporter strain (SSB-GFP, smyc’::mCherry) for 5 days. The accumulation of 4HNE was detected in both Mtb-infected and non-infected B6.Sst1S cells at day 5 p.i.. (C). Naïve and TNF-stimulated B6.Sst1S BMDMs were infected with Mtb at MOI=1. At days 4 post infection Mtb load was determined using a qPCR-based method. (D). Testing the effects of LPO and Myc inhibitors on the Mtb-infected B6.Sst1S BMDM survival and Mtb control: experimental design for panels E - H. (E and F). Prevention of iron-mediated lipid peroxidation improves the survival of and Mtb control by the B6.Sst1S macrophages. BMDMs were treated with 10 ng/mL TNF alone in combination with Fer-1 (3 μM) or DFO (50 μM) for 16 h and subsequently infected with Mtb at MOI=1. The inhibitors were added after infection for the duration of the experiment. At days 1 and 5 post infection, total cell numbers were quantified using automated microscopy (E) and Mtb loads was determined using a qPCR-based method (F). The percentage cell number were calculated based on the number of cells at Day 0 (immediately after Mtb infection and washes). The fold change of Mtb was calculated after normalization using Mtb load at Day 0 after infection. (G and H). Myc inhibition improves the survival and Mtb control by B6.Sst1S macrophages. BMDMs were treated with 10 ng/mL TNF alone or in combination with 3 μM or 10 μM 10058-F4 for 16 h and subsequently infected with Mtb at MOI=1. At days 1 and 5 post infection, total cell numbers were quantified using automated microscopy (G) and Mtb loads was determined using a qPCR-based method (H). The percentage cell number were calculated based on the number of cells at Day 0 (immediately after Mtb infection). The fold change of Mtb was calculated after normalization using Mtb load at Day 0 after infection and washes. (I). LPO and Myc inhibitors improve Mtb control by B6.Sst1S BMDMs co-cultured with BCG-induced T cells: experimental design for panels J - L. (J). Differential effect of BCG-induced T cells on Mtb control by B6 and B6.Sst1S macrophages. BMDMs of both backgrounds were treated with 10 ng/mL TNF or left untreated and subsequently infected with Mtb at MOI=1. T lymphocytes purified from lymph nodes of BCG vaccinated B6 mice were added to the infected macrophage monolayers 24 h post infection. The Mtb load was calculated by qPCR based method after 2 days of co-culture with T lymphocytes (3 days post infection). The dotted line indicates the Mtb load in untreated cells at day 2 post infection. (K). Inhibition of Myc and lipid peroxidation improves control of Mtb by B6.Sst1S macrophages co-cultured with immune T cells isolated from BCG-vaccinated B6 mice. BMDMs were pretreated with 10 ng/mL TNF alone or in combination with either Fer-1 (3 μM) or 10058-F4 (10 μM) for 16 h and subsequently infected with Mtb at MOI 1. At 24 h post infection the lymphocytes from BCG immunized B6 mice were added to the infected macrophage monolayers. The Mtb loads were determined by qPCR based method after 2 days of co-culture with T cells (3 days post infection). (L). Inhibition of type I IFN receptor improves control of Mtb by B6.Sst1S macrophages. BMDMs were pretreated with 10 ng/mL TNF alone or in combination with IFNAR1blocking Ab or isotype C Ab for 16 h and subsequently infected with Mtb at MOI 1. At 24 h post infection the lymphocytes from BCG immunized B6 mice were added to the infected macrophage monolayers. The Mtb loads were determined by qPCR-based method after 2 days of co-culture with T cells (3 days post infection). (M). TNF stimulation inhibits and IFNAR1 blockade restores the response of B6.Sst1S macrophages to IFNγ. BMDMs were pretreated with TNF (10 ng/mL) for 18 h and the IFNAR1 blocking Abs or isotype C Ab were added two hours after TNF. Subsequently, IFNγ (10 U/mL) was added for additional 12 h. The expression of the IFNγ -specific target gene Ciita was assessed using qRT-PCR. 18S was used as internal control. The data are presented as means ± standard deviation (SD) from three-five samples per experiment, representative of three independent experiments. The statistical significance was performed by two-way ANOVA using Bonferroni’s multiple comparison test (Panel A, C, J and K) and Tukey’s multiple comparison test (Panel E-H and L). One-way ANOVA using Bonferroni’s multiple comparison test (Panel M). Significant differences are indicated with asterisks (*, P < 0.05; **, P < 0.01; ***, P < 0.001; ****, P < 0.0001).
Figure 7:
Figure 7:. Accumulation of lipid peroxidation products and stress escalation in macrophages during pulmonary TB progression.
(A). Representative 3D confocal images of paucibacillary (n=16) and multibacillary (n=16) pulmonary TB lesions of B6.Sst1S,Ifnb1 -YFP reporter mice stained with anti-4HNE antibody (yellow). Cells expressing YFP are green, Mtb reporter Mtb (smyc’ :: mCherry) is red. Arrows indicate Mtb reporter strain expressing mCherry. The mice were infected for 20 weeks. (B). Representative Fluorescent multiplexed immunohistochemistry (fmIHC) images of pauci-bacillary and multi-bacillary PTB lesion in B6.Sst1S mice at high magnification (600X). 4-HNE (magenta), CD11b (green) and DAPI (grey). White areas showing 4-HNE and CD11b co-localization. The mice were infected for 20 weeks. (C). Heatmap of interferon inducible genes differentially expressed in Iba1+ cells within multibacillary vs paucibacillary lesions (fold change 1.5 and above). Pooled gene list of IFN type I and II regulated genes was assembled using public databases (as described in Methods). The mice were infected for 14 weeks. (D). Representative fmIHC images of IFN-I producing (YFP positive) myeloid cells in pauci-bacillary (n=8) and multi-bacillary (n=8) lesion of B6.Sst1S,Ifnb1 -YFP reporter mice. The different markers are shown as Iba1 (red), iNOS (teal) and YFP (green) at 400X magnification. The mice were infected for 20 weeks. (E). Representative fmIHC images of IFN-I producing (YFP positive) cells accumulating stress markers in pauci-bacillary (n=6) and multi-bacillary (n=9) lesion of B6.Sst1S,Ifnb1 -YFP reporter mice. The different markers are shown as phospho-c-Jun (peach), Chac-1 (yellow) and YFP (green) at 400X original magnification. The mice were infected for 20 weeks.

Similar articles

References

    1. Alic N, Partridge L (2015) Myc mouse and anti-ageing therapy. Trends in Endocrinology & Metabolism 26: 163 – 164 - PubMed
    1. Alvarez MJ, Shen Y, Giorgi FM, Lachmann A, Ding BB, Ye BH, Califano A (2016) Functional characterization of somatic mutations in cancer using network-based inference of protein activity. Nat Genet 48: 838–847 - PMC - PubMed
    1. Amaral EP, Costa DL, Namasivayam S, Riteau N, Kamenyeva O, Mittereder L, Mayer-Barber KD, Andrade BB, Sher A (2019) A major role for ferroptosis in Mycobacterium tuberculosis-induced cell death and tissue necrosis. J Exp Med 216: 556–570 - PMC - PubMed
    1. Amaral EP, Namasivayam S, Queiroz ATL, Fukutani E, Hilligan KL, Aberman K, Fisher L, Bomfim CCB, Kauffman K, Buchanan J et al. (2023) BACH1 promotes tissue necrosis and Mycobacterium tuberculosis susceptibility. Nat Microbiol - PMC - PubMed
    1. Amatullah H, Fraschilla I, Digumarthi S, Huang J, Adiliaghdam F, Bonilla G, Wong LP, Rivard M-E, Beauchamp C, Mercier V et al. (2022) Epigenetic reader SP140 loss of function drives Crohn’s disease due to uncontrolled macrophage topoisomerases. Cell 185: 3232–3247.e3218 - PMC - PubMed

Publication types