[Preprint]. 2024 Mar 4:rs.3.rs-3968879.
doi: 10.21203/rs.3.rs-3968879/v1.

Seeding Activity of Skin Misfolded Tau as a Biomarker for Tauopathies

Affiliations

Seeding Activity of Skin Misfolded Tau as a Biomarker for Tauopathies

Zerui Wang et al. Res Sq. .

Update in

Abstract

Background: Tauopathies are a group of age-related neurodegenerative diseases characterized by the accumulation of pathologically phosphorylated tau protein in the brain, leading to prion-like propagation and aggregation. They include Alzheimer's disease (AD), progressive supranuclear palsy (PSP), corticobasal degeneration (CBD), and Pick's disease (PiD). Currently, reliable diagnostic biomarkers that directly reflect the capability of propagation and spreading of misfolded tau aggregates in peripheral tissues and body fluids are lacking.

Methods: We utilized the seed-amplification assay (SAA) employing ultrasensitive real-time quaking-induced conversion (RT-QuIC) to assess the prion-like seeding activity of pathological tau in the skin of cadavers with neuropathologically confirmed tauopathies, including AD, PSP, CBD, and PiD, compared to normal controls.

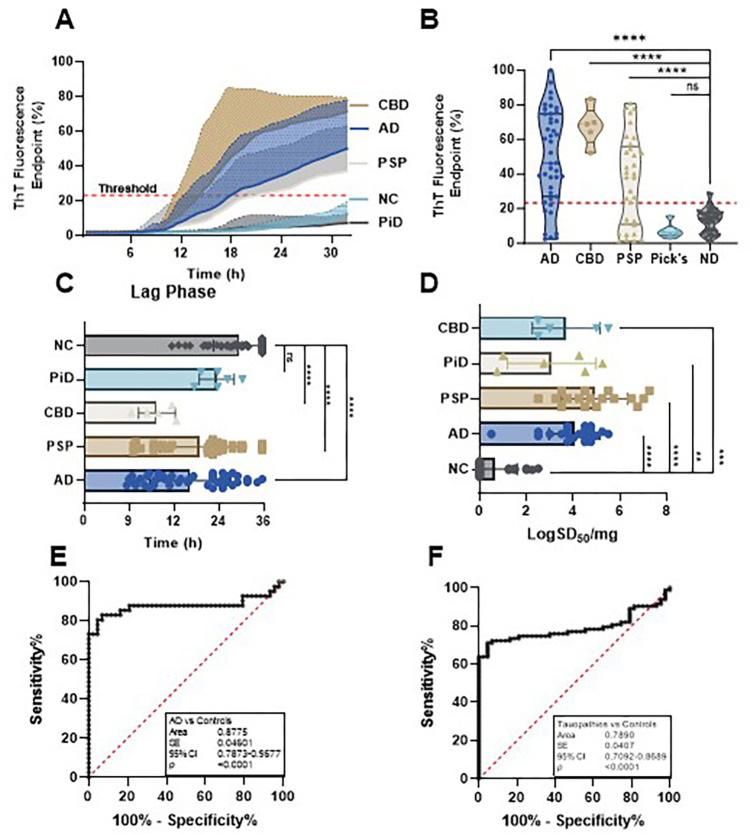
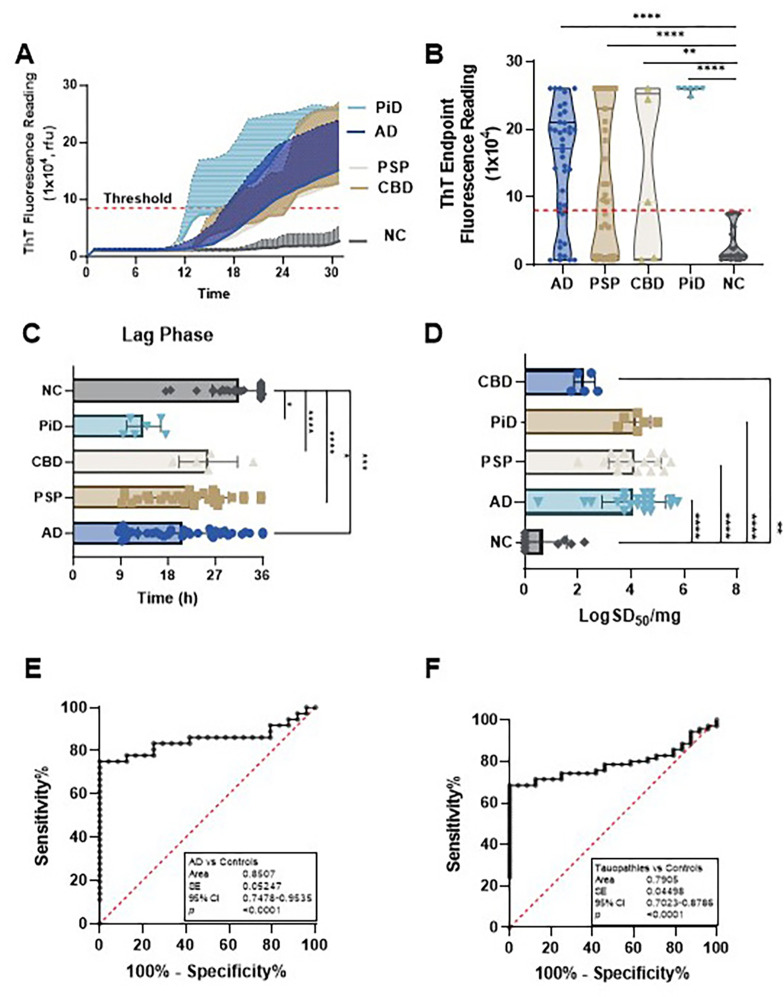
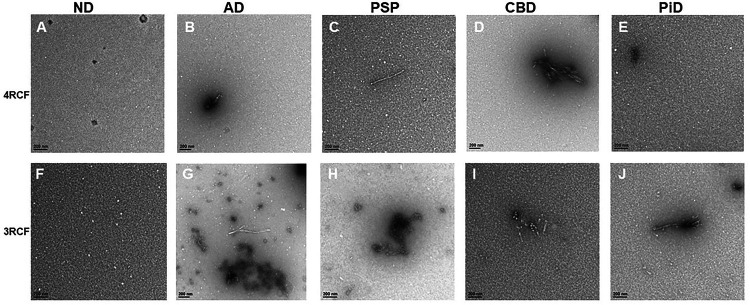
Results: We found that the skin prion-SAA demonstrated a significantly higher sensitivity (75-80%) and specificity (95-100%) for detecting tauopathy, depending on the tau substrates used. Moreover, increased tau-seeding activity was also observed in biopsy skin samples from living AD and PSP patients examined. Analysis of the end products of skin-tau SAA confirmed that the increased seeding activity was accompanied by the formation of tau aggregates with different physicochemical properties related to two different tau substrates used.

Conclusions: Overall, our study provides proof-of-concept that the skin tau-SAA can differentiate tauopathies from normal controls, suggesting that the seeding activity of misfolded tau in the skin could serve as a diagnostic biomarker for tauopathies.

Keywords: Alzheimer’s disease; Tauopathies; real-time quaking-induced conversion (RT-QuIC); seeding activity; skin; tau.


Conflict of interest statement

Competing interests: Authors declare that they have no competing interests.

Figures

Figure 1
Figure 1. Tau-seeding activity of skin samples from patients with tauopathies using 4RCF-based RT-QuIC.
(A) Kinetic curves displaying the mean and standard deviation (SD) of tau-SA over time of skin samples from CBD (n = 5), AD (n = 46), PSP (n = 33), PiD (n = 6) and NC (n = 43). (B) Scatter plot illustrating the distribution of tau-SA across different tauopathies detected in panel (A). (C) Lag phase, defined as the initial period before a significant increase in the ThT fluorescence curves. (D) The end-point dilution analysis of quantitative tau-SA of skin samples from tauopathies. The half of maximal SA (SD50) was determined by Spearman-Kärber analyses and is shown as log SD50/mg skin tissue. (E) Receiver operating characteristic (ROC) curve analysis comparing AD patients and control subjects, with an area under the curve (AUC) of 0.82. (F) ROC curve analysis comparing total tauopathies and control subjects, with an AUC of 0.79. ns: p > 0.05; **: p < 0.01; ***: p < 0.001; ****: p < 0.0001.
Figure 2
Figure 2. Tau-seeding activity of skin samples from patients with tauopathies using 3RCF-based RT-QuIC assay.
(A) Kinetic curves displaying the mean and SD of tau-SA over time of skin samples from CBD (n = 5), AD (n = 46), PSP (n = 33), PiD (n = 6) and NC (n = 43). (B) Scatter plot illustrating the distribution of tau-SA across different tauopathies. (C) Lag phase, same as above, as the initial delay before the ThT fluorescence curves begin to rise. (D) The end-point dilution analysis of quantitative tau-SA of skin samples from tauopathies. The half of maximal SA (SD50) determined by Spearman-Kärber analyses is shown as log SD50/mg skin tissue. (E) ROC curve analysis comparing AD patients and control subjects, with an AUC of 0.77. (F) ROC curve analysis comparing total tauopathies and control subjects, with an AUC of 0.72. *: p < 0.05; **: p < 0.01; ***: p < 0.001; ****: p < 0.0001.
Figure 3
Figure 3. Tau-seeding activity of skin samples from AD and other tauopathies with different Braak stages.
Scatter plot of tau-SA as a function of Braak stages through RT-QuIC assays with the substrate 4RCF (A) or 3RCF (B). ns: p > 0.05; ** p < 0.01; *** p< 0.001; ****p< 0.0001.
Figure 4
Figure 4. Tau-SAA of skin samples from participants with AD, synucleinopathies, and NC using 4RCF-based RT-QuIC assay.
Scatter plot illustrating the distribution of tau-SA at the endpoint fluorescence readings across skin samples from 21 cases with AD, different synucleinopathies including 6 cases with DLB, 6 with MSA and 10 with PD as well as 17 NCs. *: p < 0.05, **: p < 0.001; ****: p < 0.0001.
Figure 5
Figure 5. Examination of tau-SA in biopsied skin samples from patients with AD and PSP using 3RCF- or 4RCF-based RT-QuIC assay.
The scatter plot displays the endpoint ThT fluorescence intensity for AD (n = 16), PSP (n = 8), and normal control samples (n = 10). **: p < 0.01; ***: p < 0.001.
Figure 6
Figure 6. Characterization of RT-QuIC end products of skin tau from tauopathies using Filter-Trap Assay (FTA) probed with anti-3R (RD3) and anti-4R (RD4) tau antibodies.
Scatter plots of ThT fluorescence values skin-tau RT-QuIC end products of selected samples from PSP (n = 4), AD (n = 4), CBD (n = 4), PiD (n = 4) and NC (n = 4), with (A) 4RCF and (B) 3RCF substrates. FTA assays of 3RCF-/4RCF-based RT-QuIC end products of skin samples from different tauopathies including PSP, AD, CBD, PiD and normal controls (4 cases for each group) probed with RD4 (C) or RD3 (D) antibodies. Densitometric quantification of density of FTA-dot blotting with 4RCF- (E) and 3RCF (F) -based RT-QuIC end products from panels (C) and (D). Correlation analysis between FTA-trapped protein dot intensity and skin tau-SA of 4RCF- (G)/3RCF(H) -based RT-QuIC end products.
Figure 7
Figure 7. Transmission electron microscopy of SAA end products of skin misfolded tau from AD, other tauopathies and normal controls.
Panels (A) through (E) show the representative images of tau 4RCF-based RT-QuIC with normal controls (NC, A), AD (B), PSP (C), CBD (D) and PiD (E). Panels (F) through (J) exhibit the representative images of tau 3RCF-based RT-QuIC with normal controls (NC, F), AD (G), PSP (H), CBD (I) and PiD (J). Scale bars: 200 nm.
Figure 8
Figure 8. PK-resistance of the end products of 4RCF-/3RCF-based tau RT-QuIC assay of skin samples from AD and controls.
Western blotting of PK titration of 4RCF- (A) and 3RCF (B) -based RT-QuIC end product of skin samples from AD and non-AD controls. Probed with RD3 and RD4 antibodies against 3R or 4R tau isoforms, respectively. Quantitative analysis of intensity of PK-resistant tau fragments by densitometry at different molecular weights for 4R (C, D) and 3R (E, F) substrates-based RT-QuIC end products.

References

    1. Coughlin D, Irwin DJ. Emerging Diagnostic and Therapeutic Strategies for Tauopathies. Curr. Neurol. Neurosci. Rep. 2017; 17:72. - PMC - PubMed
    1. Prusiner SB. Biology and genetics of prions causing neurodegeneration. Annu Rev Genet. 2013;47:601–23. - PMC - PubMed
    1. Goedert M, Spillantini MG, Jakes R, Rutherford D, Crowther RA. Multiple isoforms of human microtubule-associated protein tau: sequences and localization in neurofibrillary tangles of Alzheimer’s disease. Neuron. 1989;3:519–26. - PubMed
    1. Liu L, Drouet V, Wu JW, Witter MP, Small SA, Clelland C, et al. Trans-synaptic spread of tau pathology in vivo. PloS One. 2012;7:e31302. - PMC - PubMed
    1. Zhang K, Mizuma H, Zhang X, Takahashi K, Jin C, Song F, et al. PET imaging of neural activity, β-amyloid, and tau in normal brain aging. Eur J Nucl Med Mol Imaging. 2021;48:3859–71. - PubMed

Publication types

LinkOut - more resources