[Preprint]. 2024 Mar 6:2024.03.03.583228.
doi: 10.1101/2024.03.03.583228.

Comparison of Synergy Extrapolation and Static Optimization for Estimating Multiple Unmeasured Muscle Activations during Walking

Affiliations

Comparison of Synergy Extrapolation and Static Optimization for Estimating Multiple Unmeasured Muscle Activations during Walking

Ao Di et al. bioRxiv. .

Update in

Abstract

Background: Calibrated electromyography (EMG)-driven musculoskeletal models can provide great insight into internal quantities (e.g., muscle forces) that are difficult or impossible to measure experimentally. However, the need for EMG data from all involved muscles presents a significant barrier to the widespread application of EMG-driven modeling methods. Synergy extrapolation (SynX) is a computational method that can estimate a single missing EMG signal with reasonable accuracy during the EMG-driven model calibration process, yet its performance in estimating a larger number of missing EMG signals remains unclear.

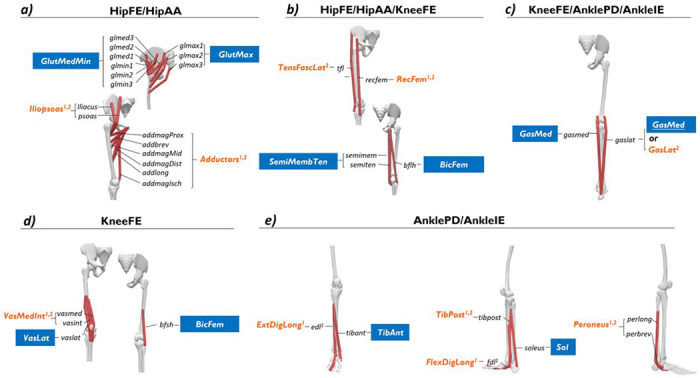
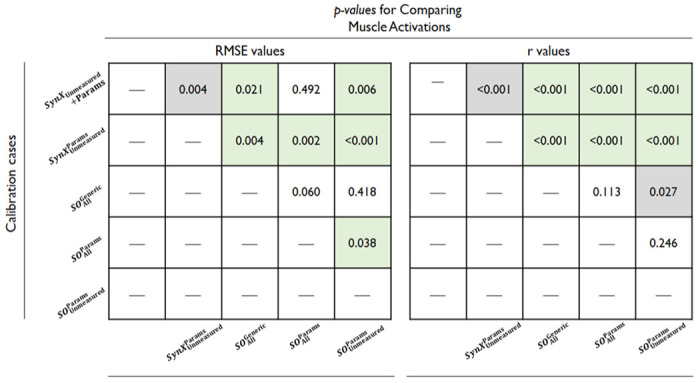
Methods: This study assessed the accuracy with which SynX can use eight measured EMG signals to estimate muscle activations and forces associated with eight missing EMG signals in the same leg during walking while simultaneously performing EMG-driven model calibration. Experimental gait data collected from two individuals post-stroke, including 16 channels of EMG data per leg, were used to calibrate an EMG-driven musculoskeletal model, providing "gold standard" muscle activations and forces for evaluation purposes. SynX was then used to predict the muscle activations and forces associated with the eight missing EMG signals while simultaneously calibrating EMG-driven model parameter values. Due to its widespread use, static optimization (SO) was also utilized to estimate the same muscle activations and forces. Estimation accuracy for SynX and SO was evaluated using root mean square errors (RMSE) to quantify amplitude errors and correlation coefficient r values to quantify shape similarity, each calculated with respect to "gold standard" muscle activations and forces.

Results: On average, SynX produced significantly more accurate amplitude and shape estimates for unmeasured muscle activations (RMSE 0.08 vs. 0.15,r value 0.55 vs. 0.12) and forces (RMSE 101.3 N vs. 174.4 N,r value 0.53 vs. 0.07) compared to SO. SynX yielded calibrated Hill-type muscle-tendon model parameter values for all muscles and activation dynamics model parameter values for measured muscles that were similar to "gold standard" calibrated model parameter values.

Conclusions: These findings suggest that SynX could make it possible to calibrate EMG-driven musculoskeletal models for all important lower-extremity muscles with as few as eight carefully chosen EMG signals and eventually contribute to the design of personalized rehabilitation and surgical interventions for mobility impairments.

Keywords: EMG-driven model; Model personalization; Muscle activation; Muscle force; Static optimization; Stroke; Synergy extrapolation.


Conflict of interest statement

Competing interests The authors declare that they have no competing interests.

Figures

Figure 1
Figure 1. The assumption about “measured” and “unmeasured” EMG channels when performing SynX and SO as well as the associated muscles in the OpenSim model for each subject.
The EMG channels assumed “measured” are denoted by blue boxes, while those assumed “unmeasured” are indicated by orange italic texts. The superscripts 1 and 2 represent the assumption of “unmeasured” EMG channels for subject S1 and S2, respectively. The muscles were categorized based on their actuating degrees of freedom (DOFs).
Figure 2
Figure 2. The workflow for EMG-driven modeling with SynX (left panel with a green background) and SO (right panel with an orange background) as performed in this study.
Both methods employ experimental joint kinematics and moments as inputs and aim to determine muscle activations and forces in such a way that the predicted net joint moments from a musculoskeletal model closely match the experimental net joint moments calculated via inverse dynamics. However, there are notable differences in the optimization problem formulations for these two methods. In EMG-driven modeling with SynX, the design variables consist of time-invariant model parameter values and SynX variables, with the optimization problem being solved across all time frames together. Conversely, for SO, the design variables encompass time-varying muscle activations, typically utilizing model parameter values from scaled generic models or literature references, and the optimization problem is solved for each time frame separately. Subsequently, both techniques leverage the Hill-type muscle-tendon model to estimate muscle forces and their respective contributions to the joint moments.
Figure 3
Figure 3
Summary of six optimizations performed in this study, which included two optimizations using SynX to predict unmeasured muscle excitations (termed SynXUnmeasured+Params and SynXUnmeasuredParams ), three optimizations using static optimization (SO) to predict unmeasured muscle activations (termed SOAllGeneric , SOAllParams and SOUnmeasuredParams ) and one “gold standard” optimization using the complete set of EMG signals with no muscle excitations predicted by SynX or SO (termed Params ). The calibration cases were named based on the prediction method for unmeasured muscle excitations or activations as well as the categories of design variables included in the optimization problem formulation. The subscripts indicate which set of muscle excitations or activations were predicted computationally, while the superscripts indicate which set of model parameters were employed during model calibration. In each column of the optimizations, the arrows indicate whether each group of muscle excitations or activations were predicted or obtained experimentally. Moreover, the arrows indicate which values were used if the model parameters were not calibrated through optimization. The term “Scaled Generic” denotes the scaled generic model parameter values, while “From Params” refers to the model parameter values derived from the “gold standard (Params)” optimization.
Figure 4
Figure 4
Average muscle activations for the “unmeasured” muscles (upper) and the “measured” muscles (lower) across calibration trials, legs and subjects from “Params” optimization (blue solid curves), SynX-based optimizations (SynXUnmeasured+Params :red solid curves and SynXUnmeasuredParams : yellow solid curves and SO-based optimizations ( SynXAllGeneric : purple dash curves, SynXAllParams : green dash curves and SynXUnmeasuredParams :grey dash curves). Data are reported for the complete gait cycle, where 0% indicates initial heel-strike and 100% indicates subsequent heel-strike. In addition, for the measured muscles, the curves associated with SynXUnmeasuredParams and SynXUnmeasuredParams were underneath the curves associated with “Params” the associated muscle activations were experimental (from “Params” optimization) rather than calibrated.
Figure 5
Figure 5. p-values obtained from paired t-test used to compare the estimation accuracy of muscle activations, as indicated by RMSE values (left) and r values (right), between different optimizations.
Initially, RMSE and r values were calculated between the experimental (“Params” optimization) and estimated muscle activations from various optimizations, with the results across all calibration trials, legs, and subjects being concatenated and displayed in table 3. Subsequently, the RMSE and r values from each optimization were individually compared to the results from every other optimization to determine the statistical significance of the differences in estimation accuracy between each pair of optimizations. All statistical analyses were performed in MATLAB, and the level of statistical significance was set at p < 0.05. A box with green background indicates that the estimation performance for the y-axis optimization was significantly better (lower RMSE values or higher r values) than it for the x-axis optimization, while a box with grey background indicates that the estimation performance for the y-axis optimization was significantly worse (higher RMSE values or lower r values) than it for the x-axis optimization.
Figure 6
Figure 6
Average muscle forces for the “unmeasured” muscles (upper) and the “measured” muscles (lower) across calibration trials, legs and subjects from “Params” optimization (blue solid curves), SynX-based optimizations (SynXUnmeasured+Params :red solid curves and SynXUnmeasuredParams : yellow solid curves and SO-based optimizations ( SynXAllGeneric : purple dash curves, SynXAllParams : green dash curves and SynXUnmeasuredParams :grey dash curves). Data are reported for the complete gait cycle, where 0% indicates initial heel-strike and 100% indicates subsequent heel-strike. In addition, for the measured muscles, the curves associated with SynXUnmeasuredParams and SynXUnmeasuredParams were underneath the curves associated with “Params” the associated muscle forces were experimental (from “Params” optimization) rather than calibrated.
Figure 7
Figure 7
p-values obtained from paired t-test used to compare the estimation accuracy of muscle forces, as indicated by RMSE values (left) and r values (right), between different optimizations. Initially, RMSE and r values were calculated between the experimental (“Params” optimization) and estimated muscle activations from various optimizations, with the results across all calibration trials, legs, and subjects being concatenated and displayed in table 4. Subsequently, the RMSE and r values from each optimization were individually compared to the results from every other optimization to determine the statistical significance of the differences in estimation accuracy between each pair of optimizations. All statistical analyses were performed in MATLAB, and the level of statistical significance was set at p<0.05. A box with green background indicates that the estimation performance for the y-axis optimization was significantly better (lower RMSE values or higher r values) than it for the x-axis optimization, while a box with grey background indicates that the estimation performance for the y-axis optimization was significantly worse (higher RMSE values or lower r values) than it for the x-axis optimization.
Figure 8
Figure 8
Average joint moments across calibration trials from “Params” optimization (blue solid curves) and SynX-based optimizations (SynXUnmeasured+Params : red solid curves and SynXUnmeasuredParams : yellow solid curves). Data are reported for the complete gait cycle, where 0% indicates initial heel-strike and 100% indicates subsequent heel-strike.
Figure 9
Figure 9
EMG-driven model parameters of two legs of both subjects from “gold standard (Params)” optimization (in blue) and “SynXUnmeasured+Params ” optimization (in orange). The upper and lower bounds for each of the four activation dynamics model parameters during optimization have been indicated by grey dash-sot lines, where the upper and lower bounds for the scaling factors of optimal fiber lengths and tendon slack lengths were [0.6, 1.4] for all muscles.

Similar articles

References

    1. Pandy MG, Lin Y-C, Kim HJ. Muscle coordination of mediolateral balance in normal walking. J Biomech. 2010;43:2055–64. - PubMed
    1. Mathieu E, Crémoux S, Duvivier D, Amarantini D, Pudlo P. Biomechanical modeling for the estimation of muscle forces: toward a common language in biomechanics, medical engineering, and neurosciences. J NeuroEngineering Rehabil. 2023;20:130. - PMC - PubMed
    1. Berger DJ, d’Avella A. Effective force control by muscle synergies. Front Comput Neurosci. 2014;8:46. - PMC - PubMed
    1. Kim HJ, Fernandez JW, Akbarshahi M, Walter JP, Fregly BJ, Pandy MG. Evaluation of predicted knee-joint muscle forces during gait using an instrumented knee implant. J Orthop Res. 2009;27:1326–31. - PubMed
    1. Marra MA, Vanheule V, Fluit R, Koopman BH, Rasmussen J, Verdonschot N, et al. A subject-specific musculoskeletal modeling framework to predict in vivo mechanics of total knee arthroplasty. J Biomech Eng. 2015;137:020904. - PubMed

Publication types