[Preprint]. 2024 Mar 5:2024.03.01.583001.
doi: 10.1101/2024.03.01.583001.

A Panoramic View of Cell Population Dynamics in Mammalian Aging

Affiliations

A Panoramic View of Cell Population Dynamics in Mammalian Aging

Zehao Zhang et al. bioRxiv. .

Update in

  • A panoramic view of cell population dynamics in mammalian aging.
    Zhang Z, Schaefer C, Jiang W, Lu Z, Lee J, Sziraki A, Abdulraouf A, Wick B, Haeussler M, Li Z, Molla G, Satija R, Zhou W, Cao J. Zhang Z, et al. Science. 2025 Jan 17;387(6731):eadn3949. doi: 10.1126/science.adn3949. Epub 2025 Jan 17. Science. 2025. PMID: 39607904 Free PMC article.

Abstract

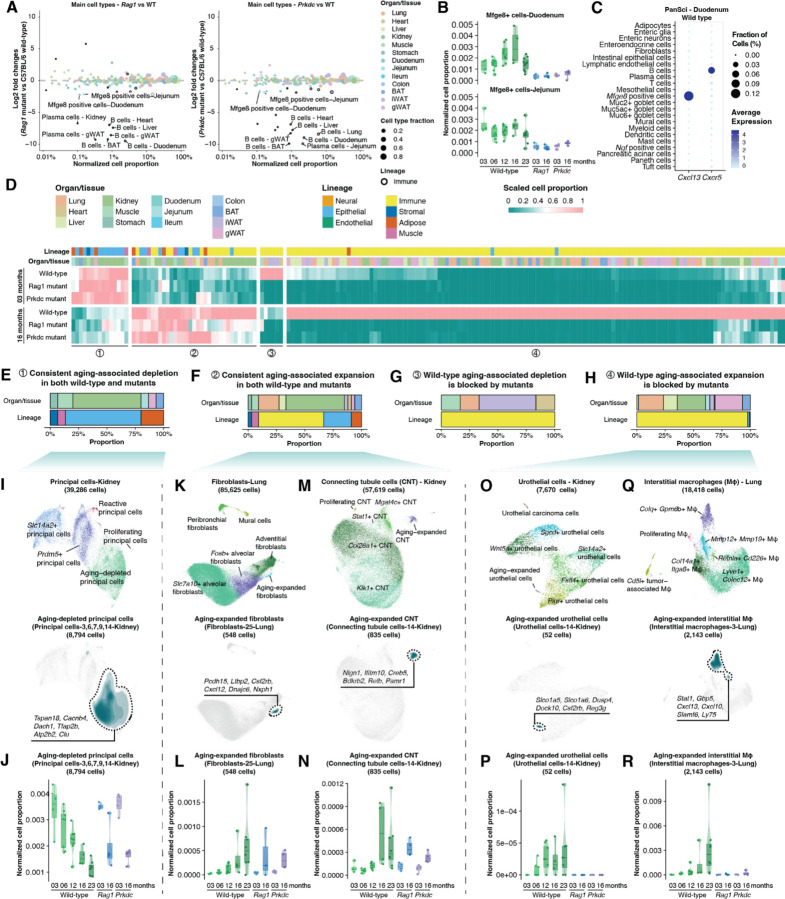
To elucidate the aging-associated cellular population dynamics throughout the body, here we present PanSci, a single-cell transcriptome atlas profiling over 20 million cells from 623 mouse tissue samples, encompassing a range of organs across different life stages, sexes, and genotypes. This comprehensive dataset allowed us to identify more than 3,000 unique cellular states and catalog over 200 distinct aging-associated cell populations experiencing significant depletion or expansion. Our panoramic analysis uncovered temporally structured, organ- and lineage-specific shifts of cellular dynamics during lifespan progression. Moreover, we investigated aging-associated alterations in immune cell populations, revealing both widespread shifts and organ-specific changes. We further explored the regulatory roles of the immune system on aging and pinpointed specific age-related cell population expansions that are lymphocyte-dependent. The breadth and depth of our 'cell-omics' methodology not only enhance our comprehension of cellular aging but also lay the groundwork for exploring the complex regulatory networks among varied cell types in the context of aging and aging-associated diseases.


Conflict of interest statement

Competing interests: In the past 3 years, R.S. has received compensation from Bristol-Myers Squibb, ImmunAI, Resolve Biosciences, Nanostring, 10x Genomics, Neptune Bio, and the NYC Pandemic Response Lab. R.S. is a co-founder and equity holder of Neptune Bio.

Figures

Figure 1:
Figure 1:. Overview of experimental design and main cell type annotation across mammalian organs.
(A) Upper: Schematic representation of the sample collection process detailing the various ages, sexes, and genotypes (including wild-type and immuno-deficient mice) used in the study. Lower: Flowchart illustrating the experimental procedures of single-cell RNA sequencing by combinatorial indexing through EasySci. (B) Logarithmic scale bar plot depicting the number of high-quality cells profiled from each organ or tissue, post-quality filtering. (C) UMAP plots displaying the cellular heterogeneity of each organ/tissue, with cells color-coded by identified main cell types. Brain cell types were retrieved from (14). An aggregated UMAP plot of the entire dataset (comprising only wild-type cells, without batch correction) is also shown (right corner), with cells distinguished by organ/tissue origin and lineage. LOH, loop of Henle.
Figure 2:
Figure 2:. Identification of aging-associated cell population change across organs/tissues.
(A) Dot plots illustrating cell-type-specific fractional changes (log-transformed fold change) between ages 6 and 23 months. Main cell types are represented by triangles and sub-clusters by dots, with key gene markers labeled for select sub-clusters. The dendrogram is derived from hierarchical clustering of gene expression correlations among main cell types. AM, alveolar macrophages; IM, interstitial macrophages; DC, dendritic cells; ICB, Type B intercalated cells; DCT, distal convoluted tubule cells; TAL, thick ascending limb of LOH cells; Sis, Sis positive cells; Uro, urothelial cells; VEC, vascular endothelial cells; Podo, podocytes; LEC, lymphatic endothelial cells; Meso, mesothelial cells; Type II, Type II myonuclei; NJM, neuromuscular junction myonuclei. (B-E) Correlation scatter plots (employing Spearman correlation) comparing fractional changes in main cell types (B, D) and sub-clusters (C, E) between female and male mice during two age intervals: 6 vs. 23 months (B, C) and 3 vs. 16 months (D, E), with a linear regression line. For all scatter plots, aging-associated cell types that are significantly changed in both age intervals are colored by the direction of changes.
Figure 3:
Figure 3:. The temporal dynamics, tissue distribution, and molecular signatures of aging-associated cell populations.
(A) Heatmap illustrating the fractional changes of aging-associated main cell types across five life stages. (B) Box plots depicting the fractional changes in muscle Mirg+ cells (lower) across the five life stages in wild-type and two time points in two lymphocyte-deficient mutants. Each dot represents a biological replicate. For all box plots: middle lines, median value; upper and lower box edges, first and third quartiles, respectively; whiskers, 1.5 times the interquartile range; and all individual data points are shown. (C) Schematic of the Dlk1-Dio3 locus, highlighting Mirg+ cell marker genes. (D) Dot plot displaying marker gene expression in the PanSci-muscle dataset, with color indicating average expression and dot size showing the percentage of cells expressing each marker. (E) Heatmap of aging-associated sub-cluster fractions across five life stages, with hierarchical clustering identifying distinct depletion and expansion waves. (F) Stacked bar plots representing the proportions of aging-associated sub-clusters from different lineages and organs/tissues in each dynamic wave. (G) Line plot showing normalized cell proportion changes in each aging wave, with Loess regression lines centered at the initial age point. (H) UMAP visualizations of 634,185 wild-type cells from aging-associated sub-clusters, colored by organ/tissue. (I-N) Density plots showing the distribution of aging-associated sub-clusters from all depletion dynamic waves (I), all expansion dynamic waves (J), first depletion wave spanning 3 to 6 months (K), second depletion wave extending to 12 months (L), first expansion wave starting from 12 months (M), and second expansion wave from 16 months (N). Cells from non-immune lineage are annotated with enriched genes.
Figure 4:
Figure 4:. Identifying aging-associated lymphocytes across organs/tissues.
(A) UMAP visualization of 957,975 T cells and innate lymphoid cells (ILCs) across various organs/tissues, colored by cluster ID. (B) Dot plot illustrating marker gene expression for T cell and ILC subtypes. The color denotes average expression values, and the dot size indicates the percentage of cells expressing these markers. (C) Heatmap displaying the normalized and scaled distribution of each T cell and ILC subtype across different organs/tissues. (D) Density plot highlighting the distribution of significantly depleted (Left) and expanded (Right) T cell and ILC sub-clusters in aging, with their respective marker genes. (E) Stacked bar plot depicting the proportion of CD4+ Naïve T cells (Left) and CD8+ Gzmk+ cytotoxic T cells (Right) within each organ/tissue in wild-type cells, normalized by organ and age group. (F) UMAP visualizations of 1,072,614 B cells and plasma cells across organs/tissues, colored according to cluster ID. (G) Dot plot showing expression of marker genes for B cell and plasma cell subtypes, with color indicating average expression and dot size reflecting cell expression percentage. (H) Heatmap illustrating the normalized and scaled distribution of each B cell and plasma cell subtype across organs/tissues. (I) Density plot revealing the distribution of aging-associated B cell and plasma cell sub-clusters with significant expansion in aging, annotated with distinct marker genes. (J) Stacked bar plot indicating the expansion of IgM+ plasma cells (Left) and Petpip2+ aging-associated B cells (Right) in each wild-type organ/tissue, normalized by organ and age group. (K) UMAP visualization demonstrating the widespread expression of Sox5 and Cdk14 in expanded B cell and plasma cell populations.
Figure 5.
Figure 5.. Characterizing lymphocyte-dependent cell population dynamics in aging.
(A) Scatter plots comparing the proportion changes of main cell types between C57BL/6 wild-type mice and Rag1 (left) or Prkdc (right) mutants. Immune cell lineages are highlighted with black circles, with significant alterations labeled. (B) Box plots illustrating the fraction changes of Mfge8+ cells in the duodenum (upper) and jejunum (lower) across life stages in both wild-type and mutant mice. Each dot represents a biological replicate. Box plots display the median (middle line), quartiles (box edges), and 1.5x interquartile range (whiskers). (C) Dot plot showcasing the expression of Cxcl13 and its receptor Cxcr5 in PanSci’s duodenum dataset, colored by average gene expression and sized by the percentage of cells expressing these markers. (D) Heatmap visualizing fraction changes of aging-associated sub-clusters (identified in Figure 3) between 3 and 16 months in C57BL/6 wild-type and immunodeficiency mutants, with hierarchical clustering revealing four distinct dynamic patterns. (E-H) Stacked bar plots presenting the proportions of aging-associated sub-clusters from different lineages and organs/tissues in each dynamic pattern. (I-J) Case study of kidney principal cells: UMAP visualizations of 39,286 kidney principal cells (I, upper) and density plot depicting the distribution and marker genes of aging-depleted principal cells (J, lower); box plot detailing population shifts in aging-depleted principal cells across different life stages in wild-type and mutant mice (J).(K-L) Case study of lung fibroblasts: UMAP visualizations of 85,625 lung fibroblasts (K, upper) and density plot depicting the distribution and marker genes of aging-expanded lung fibroblasts (K, lower); box plot detailing population shifts in aging-expanded lung fibroblasts across different life stages in wild-type and mutant mice (L).(M-N) Case study of kidney connecting tubule cells: UMAP visualizations of 57,619 kidney connecting tubule cells (CNT) (M, upper) and density plot showing the distribution and marker genes of aging-expanded CNT (M, lower); box plot detailing population shifts in aging-expanded CNT across different life stages in wild-type and mutant mice (N).(O-P) Case study of kidney urothelial cells: UMAP visualizations of 7,670 kidney urothelial cells (O, upper) and density plot showing the distribution and marker genes of aging-expanded urothelial cells (O, lower); box plot detailing population shifts in aging-expanded urothelial cells across different life stages in wild-type and mutant mice (P). (Q-R) Case study of lung interstitial macrophages: UMAP visualizations of 18,418 lung interstitial macrophages (Q, upper) and density plot showing the distribution and marker genes of aging-expanded interstitial macrophages (Q, lower); box plot detailing population shifts in aging-expanded interstitial macrophages across different life stages in wild-type and mutant mice (R).

References

    1. Aging Atlas Consortium, Aging Atlas: a multi-omics database for aging biology. Nucleic Acids Res. 49, D825–D830 (2021). - PMC - PubMed
    1. Davie K., Janssens J., Koldere D., De Waegeneer M., Pech U., Kreft Ł., Aibar S., Makhzami S., Christiaens V., Bravo González-Blas C., Poovathingal S., Hulselmans G., Spanier K. I., Moerman T., Vanspauwen B., Geurs S., Voet T., Lammertyn J., Thienpont B., Liu S., Konstantinides N., Fiers M., Verstreken P., Aerts S., A Single-Cell Transcriptome Atlas of the Aging Drosophila Brain. Cell. 174, 982–998.e20 (2018). - PMC - PubMed
    1. Tabula Sapiens Consortium*, Jones R. C., Karkanias J., Krasnow M. A., Pisco A. O., Quake S. R., Salzman J., Yosef N., Bulthaup B., Brown P., Harper W., Hemenez M., Ponnusamy R., Salehi A., Sanagavarapu B. A., Spallino E., Aaron K. A., Concepcion W., Gardner J. M., Kelly B., Neidlinger N., Wang Z., Crasta S., Kolluru S., Morri M., Pisco A. O., Tan S. Y., Travaglini K. J., Xu C., Alcántara-Hernández M., Almanzar N., Antony J., Beyersdorf B., Burhan D., Calcuttawala K., Carter M. M., Chan C. K. F., Chang C. A., Chang S., Colville A., Crasta S., Culver R. N., Cvijović I., D’Amato G., Ezran C., Galdos F. X., Gillich A., Goodyer W. R., Hang Y., Hayashi A., Houshdaran S., Huang X., Irwin J. C., Jang S., Juanico J. V., Kershner A. M., Kim S., Kiss B., Kolluru S., Kong W., Kumar M. E., Kuo A. H., Leylek R., Li B., Loeb G. B., Lu W.-J., Mantri S., Markovic M., McAlpine P. L., de Morree A., Morri M., Mrouj K., Mukherjee S., Muser T., Neuhöfer P., Nguyen T. D., Perez K., Phansalkar R., Pisco A. O., Puluca N., Qi Z., Rao P., Raquer-McKay H., Schaum N., Scott B., Seddighzadeh B., Segal J., Sen S., Sikandar S., Spencer S. P., Steffes L. C., Subramaniam V. R., Swarup A., Swift M., Travaglini K. J., Van Treuren W., Trimm E., Veizades S., Vijayakumar S., Vo K. C., Vorperian S. K., Wang W., Weinstein H. N. W., Winkler J., Wu T. T. H., Xie J., Yung A. R., Zhang Y., Detweiler A. M., Mekonen H., Neff N. F., Sit R. V., Tan M., Yan J., Bean G. R., Charu V., Forgó E., Martin B. A., Ozawa M. G., Silva O., Tan S. Y., Toland A., Vemuri V. N. P., Afik S., Awayan K., Botvinnik O. B., Byrne A., Chen M., Dehghannasiri R., Detweiler A. M., Gayoso A., Granados A. A., Li Q., Mahmoudabadi G., McGeever A., de Morree A., Olivieri J. E., Park M., Pisco A. O., Ravikumar N., Salzman J., Stanley G., Swift M., Tan M., Tan W., Tarashansky A. J., Vanheusden R., Vorperian S. K., Wang P., Wang S., Xing G., Xu C., Yosef N., Alcántara-Hernández M., Antony J., Chan C. K. F., Chang C. A., Colville A., Crasta S., Culver R., Dethlefsen L., Ezran C., Gillich A., Hang Y., Ho P.-Y., Irwin J. C., Jang S., Kershner A. M., Kong W., Kumar M. E., Kuo A. H., Leylek R., Liu S., Loeb G. B., Lu W.-J., Maltzman J. S., Metzger R. J., de Morree A., Neuhöfer P., Perez K., Phansalkar R., Qi Z., Rao P., Raquer-McKay H., Sasagawa K., Scott B., Sinha R., Song H., Spencer S. P., Swarup A., Swift M., Travaglini K. J., Trimm E., Veizades S., Vijayakumar S., Wang B., Wang W., Winkler J., Xie J., Yung A. R., Artandi S. E., Beachy P. A., Clarke M. F., Giudice L. C., Huang F. W., Huang K. C., Idoyaga J., Kim S. K., Krasnow M., Kuo C. S., Nguyen P., Quake S. R., Rando T. A., Red-Horse K., Reiter J., Relman D. A., Sonnenburg J. L., Wang B., Wu A., Wu S. M., Wyss-Coray T., The Tabula Sapiens: A multiple-organ, single-cell transcriptomic atlas of humans. Science. 376, eabl4896 (2022). - PMC - PubMed
    1. Li Z., Zhang Z., Ren Y., Wang Y., Fang J., Yue H., Ma S., Guan F., Aging and age-related diseases: from mechanisms to therapeutic strategies. Biogerontology. 22, 165–187 (2021). - PMC - PubMed
    1. Zhang M. J., Pisco A. O., Darmanis S., Zou J., Mouse aging cell atlas analysis reveals global and cell type-specific aging signatures. Elife. 10 (2021), doi:10.7554/eLife.62293. - DOI - PMC - PubMed

Publication types