[Preprint]. 2024 Mar 28:2024.03.07.583909.
doi: 10.1101/2024.03.07.583909.

Generative interpolation and restoration of images using deep learning for improved 3D tissue mapping

Affiliations

Generative interpolation and restoration of images using deep learning for improved 3D tissue mapping

Saurabh Joshi et al. bioRxiv. .

Update in

Abstract

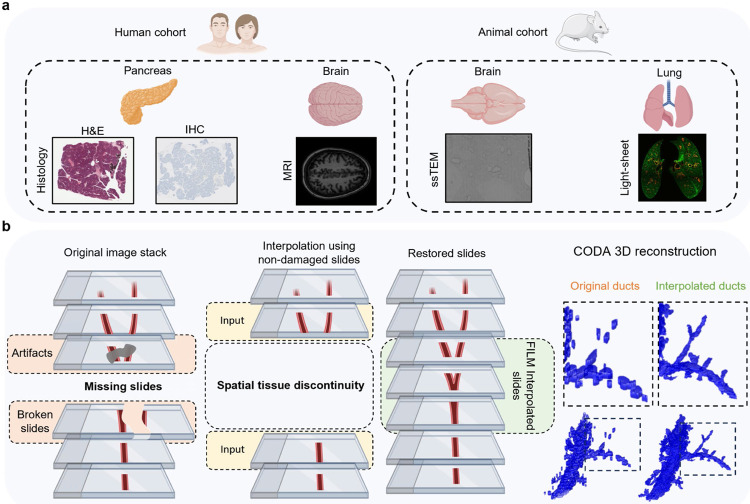
The development of novel imaging platforms has improved our ability to collect and analyze large three-dimensional (3D) biological imaging datasets. Advances in computing have led to an ability to extract complex spatial information from these data, such as the composition, morphology, and interactions of multi-cellular structures, rare events, and integration of multi-modal features combining anatomical, molecular, and transcriptomic (among other) information. Yet, the accuracy of these quantitative results is intrinsically limited by the quality of the input images, which can contain missing or damaged regions, or can be of poor resolution due to mechanical, temporal, or financial constraints. In applications ranging from intact imaging (e.g. light-sheet microscopy and magnetic resonance imaging) to sectioning based platforms (e.g. serial histology and serial section transmission electron microscopy), the quality and resolution of imaging data has become paramount. Here, we address these challenges by leveraging frame interpolation for large image motion (FILM), a generative AI model originally developed for temporal interpolation, for spatial interpolation of a range of 3D image types. Comparative analysis demonstrates the superiority of FILM over traditional linear interpolation to produce functional synthetic images, due to its ability to better preserve biological information including microanatomical features and cell counts, as well as image quality, such as contrast, variance, and luminance. FILM repairs tissue damages in images and reduces stitching artifacts. We show that FILM can decrease imaging time by synthesizing skipped images. We demonstrate the versatility of our method with a wide range of imaging modalities (histology, tissue-clearing/light-sheet microscopy, magnetic resonance imaging, serial section transmission electron microscopy), species (human, mouse), healthy and diseased tissues (pancreas, lung, brain), staining techniques (IHC, H&E), and pixel resolutions (8 nm, 2 μm, 1mm). Overall, we demonstrate the potential of generative AI in improving the resolution, throughput, and quality of biological image datasets, enabling improved 3D imaging.


Conflict of interest statement

Conflict of interest statement The authors declare no conflicts of interest.

Figures

Extended Fig 2.
Extended Fig 2.. Qualitative comparison of linear and FILM interpolations to authentic H&E-stained histological slides of a human pancreas when skipping 7 slides for four different ROI’s.
(a) Four ROIs were selected from H&E-stained whole slide images (WSI’s). Slides were interpolated when skipping 7 slides between adjacent sections, thereby generating 7 slides. (b) The top row of authentic images shows the middle skipped z-slide of all four different ROIs selected for interpolation. The middle row of zoom-ins of authentic images shows microanatomical structures observed within the different ROI’s. The third row of zoom-ins shows the CODA classification of these microanatomical structures. (c) The top row of linearly interpolated images shows the middle interpolated z-slide of all four different ROI’s corresponding to the authentic images. The middle row of zoom-ins of linearly interpolated images shows microanatomical structures generated by linear interpolation within the different ROI’s. The third row of zoom-ins shows the CODA classification of these linearly interpolated microanatomical structures. (d) The top row of FILM interpolated images shows the middle interpolated z-slide of all four different ROI’s corresponding to the authentic images. The middle row of zoom-ins of FILM interpolated images shows microanatomical structures generated by FILM within the different ROI’s. The third row of zoom-ins shows the CODA classification of these FILM interpolated microanatomical structures. (e) Euclidean distance by slide of interpolated images from authentic images based on thirteen Haralick features for ROI 1 and ROI 2. (f) Percent error in CD45+ cell count by slide between authentic and interpolated images when skipping 12 slides.
Fig 1.
Fig 1.. Interpolation workflow and datasets.
(a) Samples were obtained from two species, mouse, and human. Four different organs were analyzed: human pancreas, human brain, mouse brain, and mouse lung. Five imaging modalities were tested: hematoxylin and eosin (H&E) stained histology slides, immunohistochemistry (IHC) stained histology slides, magnetic resonance imaging (MRI), serial section transmission electron microscopy (ssTEM) slides, and combined tissue clearing with light-sheet microscopy slides. (b) Aligned slides are manually searched through to identify missing or damaged slides, and damaged slides are removed from the stack of slides. FILM interpolation is carried out using the sections adjacent to the damaged or missing slides as inputs to recreate slides that were stained differently, missing, or damaged, resulting in a uniform stack of slides. Using CODA, slides are segmented into labeled tissue masks, with each label representing different microanatomical structures in the slide, which is then used to recreate and visualize microanatomical 3D structures in the tissue sample.
Fig. 2
Fig. 2. Comparison of linear and FILM interpolations for stacks of histological images of pancreatic tissues.
(a) Regions of interest (ROI’s) were selected from the whole slide images (WSI’s), ensuring that all microanatomical features (islets of Langerhans, ductal epithelium, blood vessels, fat cells, acini, extra-cellular matrix (ECM), whitespace, and pancreatic intraepithelial neoplasia (PanIN) were present in the ROI and slides were interpolated while skipping 7 slides between adjacent sections, thereby generating 7 slides. (b) ROI 1: Comparison of linear and FILM interpolation to the authentic ROI for the middle-interpolated image (image 4) for ductal epithelium and blood vessels. Arrowheads show linear interpolation replacing damage with acini as opposed to whitespace, creating noise around the epithelium layer of the duct, incorrectly generating fat regions, and unable to preserve vessel structure. The arrow shows FILM correctly replaces damage with whitespace. (c) ROI 2: Comparison of linear and FILM interpolation to the authentic ROI for the middle-interpolated image (image 4) for ductal epithelium, fat cells, and blood vessels. Arrowheads show linear interpolation creates duct lumen shadows and fat shadows resembling islets as well as non-existent fat regions. (d) Pearson correlation compares the correlation between the authentic input images and the nearest-neighbor-interpolated, FILM-interpolated, and linearly interpolated images. (e) Principal component analysis of thirteen Haralick features for authentic, FILM, and linearly interpolated images for various numbers of skipped images. Mean Euclidean distance of interpolated images from authentic images based on thirteen Haralick features. (f) IHC pancreas slides used to interpolate with authentic slides for validation to compare interpolated images to authentic images. The middle validation slide is visualized for comparison with the interpolated images. Arrow shows how FILM preserves vessel structure, unlike linear interpolation, which was also unable to preserve fat domains (arrowheads). (g) Comparison of CD45+ cell counts in authentic images and interpolated images when skipping 12 slides. (h) Principal component analysis of thirteen Haralick features for authentic, FILM, and linearly interpolated IHC images for various numbers of skipped images. Mean Euclidean distance of interpolated images from authentic images based on thirteen Haralick features.
Fig. 3.
Fig. 3.. FILM interpolation for stacks of MRI and light-sheet microscopy images.
(a) MRI images were interpolated while skipping 7 slides between adjacent sections, thereby generating 7 slides. (b) Qualitative comparison of linear and FILM interpolation to the authentic image for the middle-interpolated MRI image (image 4). The circled region shows linear interpolation creates band artifacts, unlike FILM. (c) Principal component analysis of thirteen Haralick features for authentic, FILM, and linearly interpolated MRI images for various numbers of skipped images. Mean Euclidean distance of interpolated images from authentic images based on thirteen Haralick features. (d) Euclidean distance by slide of interpolated images from authentic images based on thirteen Haralick features for various numbers of skipped MRI images. (e) Tissue-cleared light-sheet images were interpolated skipping 7 slides between adjacent sections, thereby generating 7 slides. (f) Qualitative comparison of linear and FILM interpolations to the authentic image for the middle-interpolated light-sheet image (image 4). Arrowhead shows linear interpolation creates double boundary lines around bronchioles. In second row, the arrowhead shows photobleaching in authentic reduced by linear interpolation and completely removed by FILM (arrow). (g) Principal component analysis of thirteen Haralick features for authentic, FILM, and linearly interpolated light-sheet images for various numbers of skipped light-sheet images. Mean Euclidean distance of interpolated images from authentic images based on thirteen Haralick features. (h) Euclidean distance by slide of interpolated images from authentic images based on thirteen Haralick features for various numbers of skipped light-sheet images.
Fig. 4.
Fig. 4.. FILM interpolation for a stack of ssTEM images.
(a) ssTEM slides were interpolated while skipping 4 slides between adjacent sections, thereby generating 4 slides. (b) FILM interpolation of mouse brain ssTEM slides to remove damage from slides (arrowheads) and reduce stitching artifacts (red box). (c) Principal component analysis of thirteen Haralick features for authentic, FILM, and linearly interpolated ssTEM images for various skipped images. Mean Euclidean distance of interpolated images from authentic images based on thirteen Haralick features.
Fig. 5.
Fig. 5.. 3D reconstruction of interpolated images.
(a) Comparison of 3D reconstructions of pancreatic duct when skipping 7 slides between authentic images and when interpolating the missing slides using linear and FILM interpolations. (b) Comparison of 3D reconstructions of brain MRI images when skipping 7 images between authentic images and when interpolating the missing slides using linear and FILM interpolations. (c) Comparison of 3D reconstructions of bronchioles from light-sheet images of the mouse lung when skipping 7 images between authentic images and when interpolating the missing slides using linear and FILM interpolations. (d) Comparison of 3D reconstructions of synapses from ssTEM slides of the mouse brain when skipping 7 images between authentic images and when interpolating the missing slides using linear and FILM interpolations.

References

    1. Forjaz A. et al. Three-dimensional assessments are necessary to determine the true spatial tissue composition of diseased tissues. bioRxiv 2023.12.04.569986 (2023) doi: 10.1101/2023.12.04.569986. - DOI
    1. Kiemen A. L. et al. nature methods CODA: quantitative 3D reconstruction of large tissues at cellular resolution. Nature Methods | 19, 1490–1499 (2022). - PMC - PubMed
    1. Cline H. E., Dumoulin C. L., Hart H. R., Lorensen W. E. & Ludke S. 3D reconstruction of the brain from magnetic resonance images using a connectivity algorithm. Magn Reson Imaging 5, 345–352 (1987). - PubMed
    1. Consortium Mic. et al. Functional connectomics spanning multiple areas of mouse visual cortex. bioRxiv 2021.07.28.454025 (2021) doi: 10.1101/2021.07.28.454025. - DOI
    1. Yin W. et al. A petascale automated imaging pipeline for mapping neuronal circuits with high-throughput transmission electron microscopy. Nature Communications 2020 11:1 11, 1–12 (2020). - PMC - PubMed

Publication types