[Preprint]. 2024 Mar 6:2024.03.04.583310.
doi: 10.1101/2024.03.04.583310.

The sodium-proton exchangers sNHE and NHE1 control plasma membrane hyperpolarization in mouse sperm

Affiliations

The sodium-proton exchangers sNHE and NHE1 control plasma membrane hyperpolarization in mouse sperm

Analia G Novero et al. bioRxiv. .

Update in

Abstract

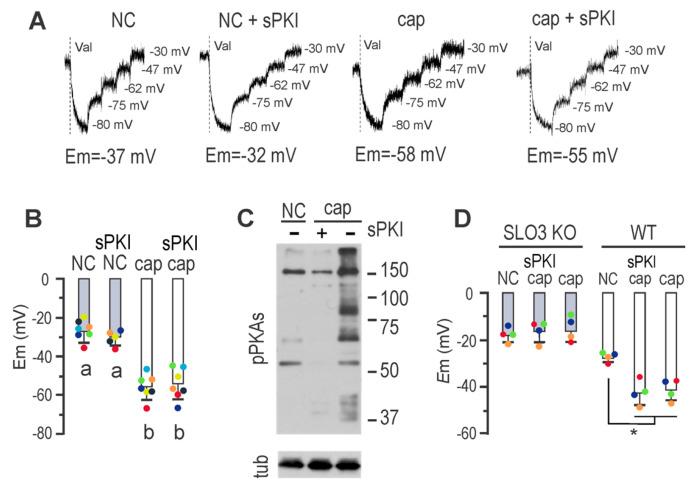
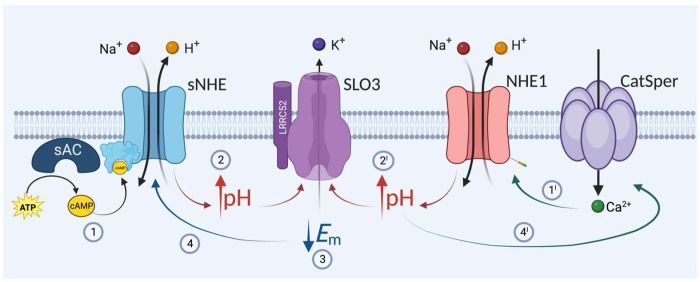
Sperm capacitation, crucial for fertilization, occurs in the female reproductive tract and can be replicated in vitro using a medium rich in bicarbonate, calcium, and albumin. These components trigger the cAMP-PKA signaling cascade, proposed to promote hyperpolarization of the mouse sperm plasma membrane through activation of SLO3 K+ channel. Hyperpolarization is a hallmark of capacitation: proper membrane hyperpolarization renders higher in vitro fertilizing ability, while Slo3 KO mice are infertile. However, the precise regulation of SLO3 opening remains elusive. Our study challenges the involvement of PKA in this event and reveals the role of Na+/H+ exchangers. During capacitation, calcium increase through CatSper channels activates NHE1, while cAMP directly stimulates the sperm-specific NHE, collectively promoting the alkalinization threshold needed for SLO3 opening. Hyperpolarization then feeds back Na+/H+ activity. Our work is supported by pharmacology, and a plethora of KO mouse models, and proposes a novel pathway leading to hyperpolarization.


Conflict of interest statement

Competing interest Authors declare no competing interests.

Figures

FIGURE 1.
FIGURE 1.. Mouse sperm Em hyperpolarization can dispense PKA catalytic activity.
A, Fluorescence traces showing the values of the sperm Em obtained after sperm incubation in either non-capacitating or capacitating conditions containing or not 15 μM sPKI for 60 min. Each experiment displays its calibration curve and the estimated Em value. B, Summary of Em measurements of sperm incubated in conditions depicted in A (mean ± SEM; n ≥ 5); different letters indicate statistically significant differences (p<0.001). C, Sperm were incubated for 60 min in non-capacitating or capacitating medium containing or not 15 μM sPKI. Each condition was processed for western blot analysis with a monoclonal anti-pPKAs antibody. Membrane was stripped and analyzed for the presence of tubulin using anti-β-tub (clone E7). D, Sperm Em measurements obtained after 60 min incubation of either Slo3 KO (gray boxes) or WT sperm (white boxes) in either non-capacitating or capacitating medium containing or not 15 μM sPKI (mean ± SEM; n = 4; * p<0.001). Each colored dot represents the value for each independent sample.
FIGURE 2.
FIGURE 2.. Mouse sperm Em hyperpolarization is cAMP regulated and sNHE dependent.
A, Sperm Em obtained after incubation in either non-capacitating or capacitating conditions containing 500 μM 8Br-cAMP alone or in addition to15 μM sPKI for 60 min. Results are expressed as a normalization of percentage of hyperpolarization considering mean NC and cap values as 0% and 100%, respectively (mean ± SEM; n=4). Different letters indicate statistically significant differences (p<0.001). B, Sperm Em obtained after incubation in either capacitating (with either 10 μM TDI10229 alone or in combination with 500 μM 8Br-cAMP) or non-capacitating conditions containing or not 500 μM 8Br-cAMP for 60 min. Results are expressed as a normalized percentage of hyperpolarization considering NC mean and cap mean values as 0% and 100%, respectively (mean ± SEM; n=9). Different letters indicate statistically significant differences (p<0.001). Each colored dot represents the value for each independent sample. C, Sperm were incubated for 60 min in non-capacitating media containing increasing concentrations of 6Bnz-cAMP, as indicated. Each condition was processed for western blot analysis with a monoclonal anti-pPKAs antibody. The membrane was stripped and analyzed for the presence of tubulin using anti-β-tub (clone E7). D, Summary of densitometry analysis of sperm cells incubated as in A (mean ± SEM; n=3). Different letters indicate statistically significant differences (p<0.05). E, Em measurements of sperm incubated in non-capacitating conditions containing either 30 μM 8-pCPT-2’-O-Me-cAMP (8pCPT), 50 nM 6Bnz-cAMP, 500 μM 8Br-cAMP or 500 μM dibutyryl-cAMP (db-cAMP) for 60 min (mean ± SEM; n = 3). Different letters indicate statistically significant differences (p<0.001). F, Summary of Em sperm measurements from sNhe KO (gray boxes) or WT mice (black boxes) obtained after incubation in either capacitating or non-capacitating conditions containing 500 μM 8Br-cAMP or 10 mM NH4Cl for 60 min (mean ± SEM; n = 5; * p<0.05).
FIGURE 3.
FIGURE 3.. Em hyperpolarization induces intracellular alkalinization.
Sperm were incubated in either non-capacitating or capacitating media in the absence (DMSO) or presence of 1 μM Valinomycin (Val). A, Representative BCECF versus PI two dimensional fluorescence dot plot analysis. Blue square shows non-PI stained sperm. B, Histogram analysis depicting normalized frequency of sperm, and BCECF fluorescence performed in live sperm populations. C, Normalized median fluorescence intensity of BCECF compared to capacitating condition (mean ± SEM, n=4, *p < 0.05).
FIGURE 4.
FIGURE 4.. NHE1 activity through Ca2+ stimulation is conducive to Em hyperpolarization.
A, Em obtained after sperm incubation in either non-capacitating or capacitating conditions containing different concentrations of dimethyl-amiloride (DMA) as indicated, for 60 min (mean ± SEM; n = 4; * p<0.001). B, Sperm were incubated for 60 min in non-capacitating or in capacitating medium in the presence or absence of 10 <M DMA. Each condition was processed for western blot analysis with a monoclonal anti-pPKAs antibody. C, Sperm were incubated for 60 min in non-capacitating or capacitating medium containing or not 10 μM TDI-10229 (TDI) or 1 μM DMA. Different letters indicate statistically significant differences (p<0.001). D, Em obtained after sperm incubation in either non-capacitating or capacitating conditions containing different concentrations of cariporide, as indicated, for 60 min. Different letters indicate statistically significant differences (mean ± SEM; n = 4; * p<0.001). E, Em obtained after sperm incubation in non-capacitating conditions in the presence or not of 500 μM 8Br-cAMP (8Br), or in capacitating conditions. As specified, capacitating conditions were supplemented with either 1 μM DMA (DMA), or 10 μM cariporide (carip) for 60 min. As indicated, these conditions were also supplemented with 500 μM 8Br-cAMP or 10 mM NH4Cl (mean ± SEM; n = 4; * p<0.01). F, Sperm Em from either CatSper1 KO (left panel) or WT mice (right panel) were obtained after sperm incubation in either non-capacitating (with boxes) or capacitating conditions (grey boxes) containing or not either 500 μM 8Br-cAMP or 10 mM NH4Cl for 60 min (mean ± SEM; n = 5; * p<0.005).
FIGURE 5.
FIGURE 5.. Intracellular Ca2+ increase promotes cytoplasmic alkalinization in sperm cells.
Non-capacitated sperm cells were loaded with 0.5 μM BCECF-AM for 30 min before smearing onto laminin-precoated coverslips to record fluorescence. A, Representative fluorescence images of WT (upper panels) and sNhe KO (lower panels) sperm exposed to 10 μM of the ionophore A23187, followed by 10 mM NH4Cl. Reference bar for fluorescence intensity is depicted. Scale bar is equal to 10 μm. B, Summary average traces (8 cells in each trace) of experiments performed in A, including a mock treatment on WT sperm performed with DMSO instead of A23187. C, Summary average traces (8 cells in each trace) of either WT or sNhe KO sperm were exposed to 10 μM ionomycin followed by 20 mM NH4Cl. D, Summary average traces (8 cells in each trace) of sperm incubated in nominal zero Ca2+ (no added Ca2+ salts) challenged with 1.7 mM CaCl2 and followed by 20 mM NH4Cl.
Figure 6.
Figure 6.. Working model proposing a dual action of sNHE and NHE1 on sperm Em hyperpolarization.
(1) Synthesis of cAMP induces alkalinization via sNHE, which, together with the action of NHE1 driven by intracellular Ca2+ increase (1’), promote the necessary alkalinization (2 and 2’) to increase the conductance of SLO3 (3). In turn, Em hyperpolarization stimulates a positive feedback loop that further activates sNHE (4). It is worth noting that the sole action of sNHE (inhibition of NHE1) or of NHE1 (in the case of sNhe KO) is not sufficient, under physiological conditions, to promote SLO3 opening.

References

    1. Stival C. et al. Sperm capacitation and acrosome reaction in mammalian sperm. Adv Anat Embryol Cell Biol 220, 93–106 (2016). - PubMed
    1. Santi C. M. et al. The SLO3 sperm-specific potassium channel plays a vital role in male fertility. FEBS Lett 584, 1041–1046 (2010). - PMC - PubMed
    1. Matamoros-Volante A. & Trevino C. L. Capacitation-associated alkalization in human sperm is differentially controlled at the subcellular level. J Cell Sci 133, (2020). - PubMed
    1. Baro Graf C. et al. Membrane Potential Assessment by Fluorimetry as a Predictor Tool of Human Sperm Fertilizing Capacity. Front Cell Dev Biol 7, 383 (2019). - PMC - PubMed
    1. Ren D. et al. A sperm ion channel required for sperm motility and male fertility. Nature 413, 603–609 (2001). - PMC - PubMed

Publication types