This is a preprint.
De Novo TANGLED1 Recruitment to Aberrant Cell Plate Fusion Sites in Maize
- PMID: 38496554
- PMCID: PMC10942460
- DOI: 10.1101/2024.03.07.583939
De Novo TANGLED1 Recruitment to Aberrant Cell Plate Fusion Sites in Maize
Update in
-
De novo TANGLED1 recruitment from the phragmoplast to aberrant cell plate fusion sites in maize.J Cell Sci. 2024 Jun 15;137(12):jcs262097. doi: 10.1242/jcs.262097. Epub 2024 Jun 19. J Cell Sci. 2024. PMID: 38832513 Free PMC article.
Abstract
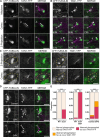
Division plane positioning is critical for proper growth and development in many organisms. In plants, the division plane is established before mitosis, by accumulation of a cytoskeletal structure called the preprophase band (PPB). The PPB is thought to be essential for recruitment of division site localized proteins, which remain at the division site after the PPB disassembles. Here, we show that a division site localized protein, TANGLED1 (TAN1), is recruited independently of the PPB to the cell cortex at sites, by the plant cytokinetic machinery, the phragmoplast. TAN1 recruitment to de novo sites on the cortex is partially dependent on intact actin filaments and the myosin XI motor protein OPAQUE1 (O1). These data imply a yet unknown role for TAN1 and possibly other division site localized proteins during the last stages of cell division when the phragmoplast touches the cell cortex to complete cytokinesis.
Keywords: Preprophase band; cytoskeleton; division; maize; mitosis; phragmoplast.
Conflict of interest statement
Competing Interests No competing interests declared.
Figures


Similar articles
-
De novo TANGLED1 recruitment from the phragmoplast to aberrant cell plate fusion sites in maize.J Cell Sci. 2024 Jun 15;137(12):jcs262097. doi: 10.1242/jcs.262097. Epub 2024 Jun 19. J Cell Sci. 2024. PMID: 38832513 Free PMC article.
-
The microtubular preprophase band recruits Myosin XI to the cortical division site to guide phragmoplast expansion during plant cytokinesis.Dev Cell. 2024 Sep 9;59(17):2333-2346.e6. doi: 10.1016/j.devcel.2024.05.015. Epub 2024 Jun 6. Dev Cell. 2024. PMID: 38848716
-
TANGLED1 mediates microtubule interactions that may promote division plane positioning in maize.J Cell Biol. 2020 Aug 3;219(8):e201907184. doi: 10.1083/jcb.201907184. J Cell Biol. 2020. PMID: 32568386 Free PMC article.
-
The role of the cytoskeleton and associated proteins in determination of the plant cell division plane.Plant J. 2013 Jul;75(2):258-69. doi: 10.1111/tpj.12177. Epub 2013 Apr 19. Plant J. 2013. PMID: 23496276 Review.
-
The functions of the cytoskeleton and associated proteins during mitosis and cytokinesis in plant cells.Front Plant Sci. 2015 Apr 27;6:282. doi: 10.3389/fpls.2015.00282. eCollection 2015. Front Plant Sci. 2015. PMID: 25964792 Free PMC article. Review.
References
-
- Allsman L.A., Dieffenbacher R.N. and Rasmussen C.G. (2019) ‘Glue Impressions of Maize Leaves and Their Use in Classifying Mutants’, Bio-protocol, 9(7), p. e3209.
-
- Ambrose J.C. and Cyr R. (2008) ‘Mitotic spindle organization by the preprophase band’, Molecular plant, 1(6), pp. 950–960. - PubMed
-
- Bergmann D.C. and Sack F.D. (2007) ‘Stomatal development’, Annual review of plant biology, 58, pp. 163–181. - PubMed
Publication types
Grants and funding
LinkOut - more resources
Full Text Sources
