[Preprint]. 2024 Mar 8:2024.03.06.583588.
doi: 10.1101/2024.03.06.583588.

A longitudinal single-cell and spatial multiomic atlas of pediatric high-grade glioma

Affiliations

A longitudinal single-cell and spatial multiomic atlas of pediatric high-grade glioma

Jonathan H Sussman et al. bioRxiv. .

Abstract

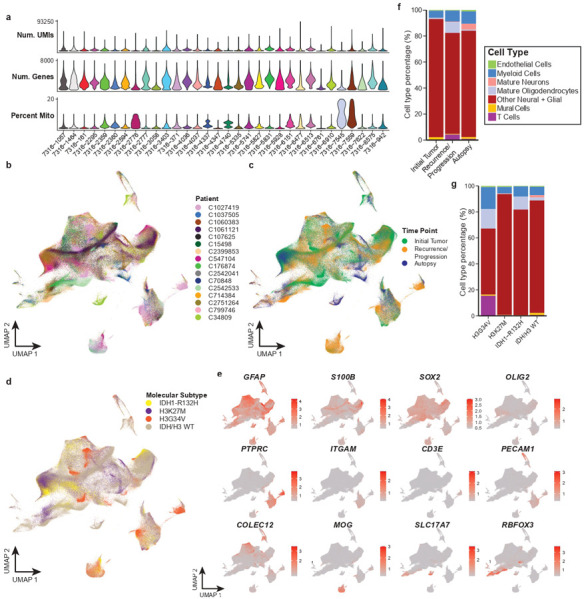
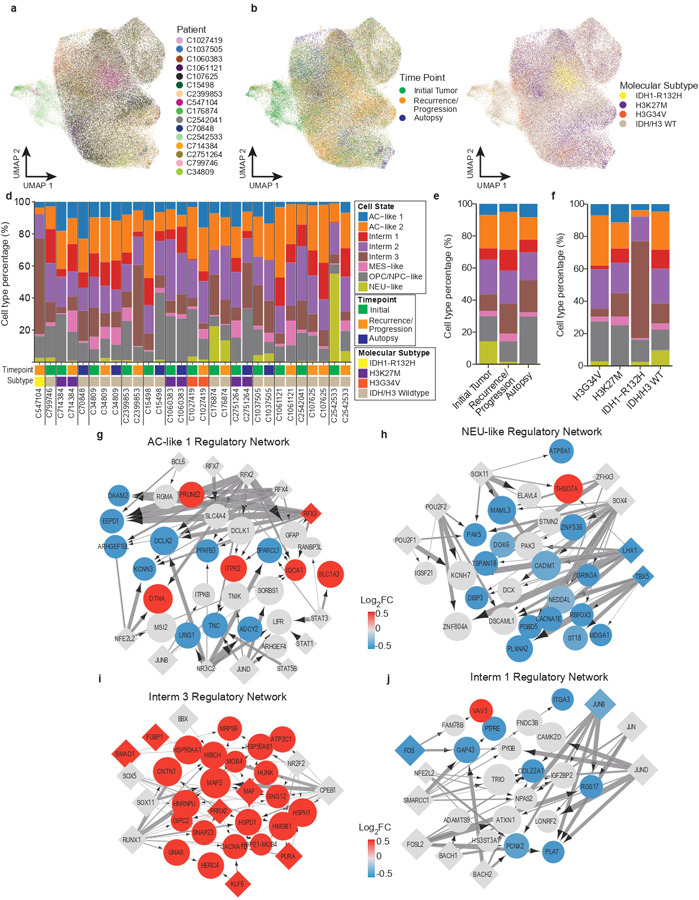
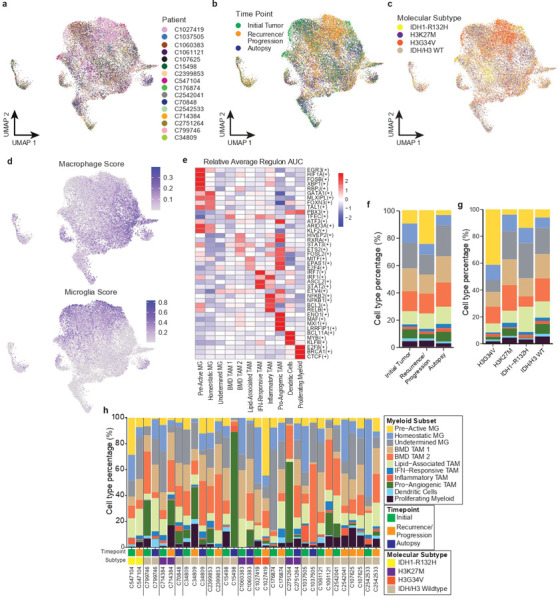
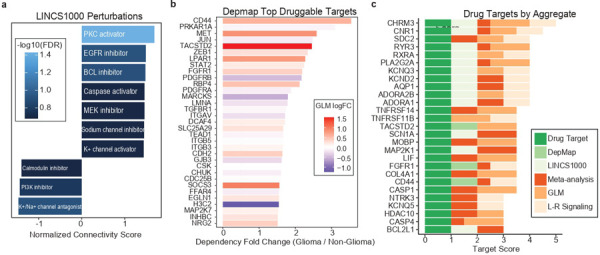
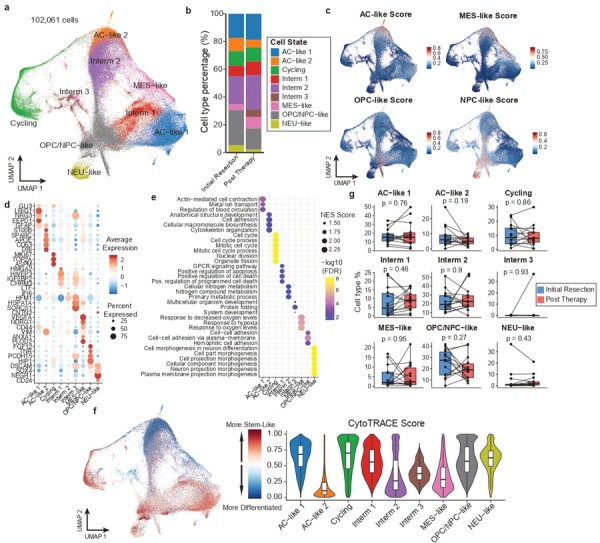
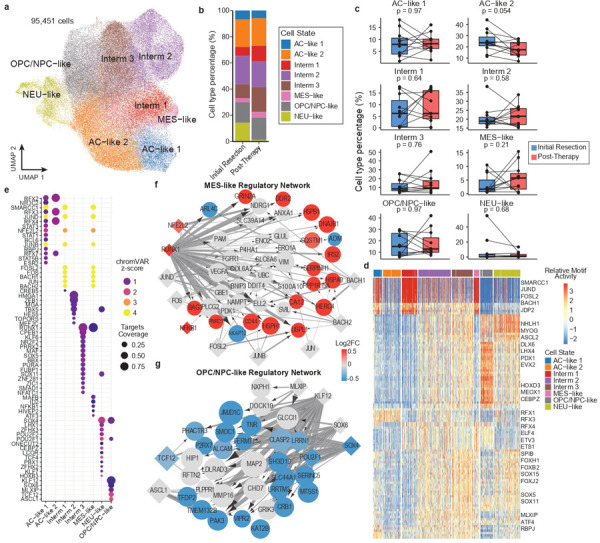
Pediatric high-grade glioma (pHGG) is an incurable central nervous system malignancy that is a leading cause of pediatric cancer death. While pHGG shares many similarities to adult glioma, it is increasingly recognized as a molecularly distinct, yet highly heterogeneous disease. In this study, we longitudinally profiled a molecularly diverse cohort of 16 pHGG patients before and after standard therapy through single-nucleus RNA and ATAC sequencing, whole-genome sequencing, and CODEX spatial proteomics to capture the evolution of the tumor microenvironment during progression following treatment. We found that the canonical neoplastic cell phenotypes of adult glioblastoma are insufficient to capture the range of tumor cell states in a pediatric cohort and observed differential tumor-myeloid interactions between malignant cell states. We identified key transcriptional regulators of pHGG cell states and did not observe the marked proneural to mesenchymal shift characteristic of adult glioblastoma. We showed that essential neuromodulators and the interferon response are upregulated post-therapy along with an increase in non-neoplastic oligodendrocytes. Through in vitro pharmacological perturbation, we demonstrated novel malignant cell-intrinsic targets. This multiomic atlas of longitudinal pHGG captures the key features of therapy response that support distinction from its adult counterpart and suggests therapeutic strategies which are targeted to pediatric gliomas.


Conflict of interest statement

Competing interests The authors declare no competing interests.

Figures

Extended Data Figure 1.
Extended Data Figure 1.. Overview of longitudinal patient cohort.
a) Timeline of specimen collection and patient treatments if available. Patients were between 4 and 24 years of age. All patients received radiation therapy. Some patients received chemotherapy including temozolomide, bevacizumab, pembrolizumab, vemurafenib, and irinotecan. Samples were collected from an initial resection after histologic diagnosis of high-grade glioma, and then through a secondary post-therapy resection or at autopsy. b) Copy number alterations assessed through whole genome sequencing (WGS) for each patient at all available therapeutic time points. Average sequencing depth is 91x per sample.
Extended Data Figure 2.
Extended Data Figure 2.. Generation and integration of snRNA-Seq pHGG atlas.
a) Violin plots of quality control (QC) metrics for each of specimen in the integrated snRNA-Seq dataset. Most specimens were sequenced at two regions, yielding 63 total samples. QC metrics include number of unique molecular identifiers (UMIs), number of unique genes captured after quantitation, and percent of reads originating from mitochondrial genes.b-d) Integrated UMAP projection of snRNA-Seq data colored by (b) patient, (c) time point, and (d) molecular subtype. e) Expression of marker genes on UMAP of snRNA-Seq data supporting annotation of major cell types. Colors truncated at 1st and 99th percentiles for visualization. f-g) Stacked bar plots of cell type proportions across dataset stratified by (f) time points separated by initial resection, recurrence/progression (secondary surgical resection), or post-mortem acquisition at autopsy, and (g) molecular subtypes defined by driver mutations in IDH or core histone proteins.
Extended Data Figure 3.
Extended Data Figure 3.. Generation and integration of snATAC-Seq pHGG atlas.
a) Violin plots of quality control (QC) metrics for each of specimen in the integrated snATAC-Seq dataset (32 total samples). QC metrics include number of unique fragments, mitochondrial genes, and transcription start site (TSS) enrichment of fragment reads in each cell. b-d) Integrated UMAP projection of snATAC-Seq data colored by (b) patient, (c) time point, and (d) molecular subtype. e) Confidence scores of label transfer predictions using snRNA-Seq to annotate the major cell types in the snATAC-Seq, demonstrating high concordance between the two data modalities. f) Cell type proportions in snATAC-Seq data across each patient and therapeutic time point, along with the molecular subtype. g-h) Stacked bar plots of cell type proportions across dataset stratified by (g) time points separated by initial resection, recurrence/progression (secondary surgical resection), or post-mortem acquisition at autopsy, and (h) molecular subtype defined by driving mutations in IDH or core histone proteins.
Extended Data Figure 5.
Extended Data Figure 5.. Integration and regulatory network analysis of malignant cell states using snATAC-Seq data.
a-c) Integrated UMAP projection of inferred neoplastic cells in snATAC-Seq data colored by (a) patient, (b) time point, and (c) molecular subtype class. d) Neoplastic cell state proportions in snATAC-Seq across each patient and therapeutic time point, along with the molecular subtype. e-f) Stacked bar plots of cell type proportions across dataset stratified by (e) time points separated by initial resection, recurrence/progression (secondary surgical resection), or post-mortem acquisition at autopsy, and (f) molecular subtype defined by driving mutations in IDH or core histone proteins. g-j) Transcriptional regulatory networks for (g) AC-like 1 state, (h) NEU-like state, (i) Interm 3 state, and (j) Interm 1 state, showing top 50 upregulated genes and top 15 TFs in each state. Diamond nodes represent transcription factors and circle nodes represent target genes. Node size is proportional to the average gene expression for target genes and average chromVAR z-score for TFs. Node color is proportional to the average log2 fold change of the gene in that cell state post-therapy across all cells. Edge line thickness is proportional to the linear regression coefficient for the predicted enhancer-promoter interaction and the fraction of cells with chromatin accessibility at the enhancer peak. The AC-like 2 and Interm 2 state networks are not shown as they include less than 5 significant TF-gene pairs.
Extended Data Figure 6.
Extended Data Figure 6.. Integration and distribution of myeloid populations in snRNA-Seq.
a-c) Integrated UMAP projection of myeloid cells in snRNA-Seq data colored by (a) patient, (b) time point, and (c) molecular subtype class. d) UMAP colored by signature scores for bone marrow-derived (BMD) macrophages (left) and microglia (right) as previously defined. Colors truncated at 1st and 99th percentiles for visualization. e) Transcription factor regulon activity calculated by SCENIC. Heatmap shows average regulon AUC value for top differentially active regulons in each myeloid subpopulation. f-g) Stacked bar plots of cell type proportions across dataset stratified by (f) time points separated by initial resection, recurrence/progression (secondary surgical resection), or post-mortem acquisition at autopsy, and (g) molecular subtype defined by driver mutations in IDH or core histone proteins. h) Myeloid cell type proportions in snRNA-Seq across each patient and therapeutic time point, along with the molecular subtype. BMD, bone marrow derived. MG, microglia.
Extended Data Figure 8.
Extended Data Figure 8.. Tumor cell staters are differentially localized near myeloid subtypes.
a) Heatmap tabulating number of samples (out of 11 total) in which there is a significant proximity of the source cell (rows) to the target cell (columns). Significance was assessed by a one-sided permutation test. Black box highlights proximity from tumor cell states to myeloid subtypes. b-f) Median distances in each sample from source cell type (x-axis label) to (b) MPO+ myeloid cells, (c) unclassified macrophages, (d) CD163+CD206+ macrophages, (e) HLA-hi macrophages, and (f) endothelial cells.
Extended Data Figure 9.
Extended Data Figure 9.. Tumor subclone dynamics across patients.
a) Fishtail plots showing shifts in tumor subclone populations across longitudinal time points for 14 patients. b) Correlation heatmap of subclones based on estimated copy number variation (CNV) at the gene level. The CNV states of chromosome segments in each subclone were used to infer gene-level CNVs for comparison across the cohort. Clone colors indicate subclones identified in (a). Expanded subclones are indicated. c) Ratio of binarized copy number alteration (gain or loss) at the chromosome arm level comparing expanded and non-expanded clones. The ratio represents the number of subclones with copy number gain or loss among all 84 subclones identified across patients. Expanded subclones were defined if they increased in proportion across time points and comprise at least 10% of the tumor population at the latest time point.
Extended Data Figure 10.
Extended Data Figure 10.. Drug target selection
a) Representative drug mechanisms nominated by LINCS1000 using top upregulated and downregulated time point-specific genes (Methods). Perturbation results were filtered for false discovery rate <0.25 and normalized connectivity score >0.6. b) Top glioma-specific targets predicted from DepMap screening. Dependency scores in glioma versus non-glioma cell lines were ranked by fold change (mean dependency in glioma / mean dependency in non-glioma cell lines). Color indicates log fold change of expression post-therapy using the generalized linear mixed model analysis. c) Top gene targets by aggregate ranking score (Methods). Criteria includes screening against 3 drug databases, LINCS1000 compound perturbations, and DepMap, as well as two orthogonal methods of differential expression analysis (time point-specific generalized linear mixed model and per-patient meta-analysis) and participation in ligand-receptor signaling as a receptor target.
Figure 1.
Figure 1.. Longitudinal single-cell RNA and ATAC atlas of pediatric high grade glioma (pHGG)
a) Overview of the multiomics studies on patient-matched longitudinal pHGG specimens. b-c) Uniform manifold approximation and projection (UMAP) of (b) snRNA-Seq data (401,253 cells) and (c) snATAC-Seq data (118,736 cells) annotated by major cell type category (left) and stacked bar plot of cell type proportions across dataset comparing initially resected pHGG samples with post-therapy samples. d) Cell type proportions in snRNA-Seq data across each patient and therapeutic time point, along with a summary of patient demographics and molecular subtype. e-f) Shifts in cell type proportions for each patient between initial resection and post-therapy time points in (e) snRNA-Seq and (f) snATAC-Seq; n = 15 paired samples profiled by snRNA-Seq and n = 11 paired samples profiled by snATAC-Seq, including an initial resection and at least one post-therapy sample. Post-therapy samples were merged for one patient with three longitudinal samples. A two-sided Wilcoxon signed-rank test for paired samples was used.
Figure 2.
Figure 2.. Transcriptional states of pHGG neoplastic cells
a) UMAP projection of inferred neoplastic cells from snRNA-Seq (102,061 cells) after integration and annotation of cell states; AC, astrocyte; MES, mesenchymal; OPC, oligodendrocyte progenitor cell; NPC, neural progenitor cell; NEU, neural. b) Barplot of cell type proportions of neoplastic cells across dataset comparing initial resection and post-therapy samples. c) Gene signatures of GBM cell states overlaid on UMAP of neoplastic cells. Colors truncated at 1st and 99th percentiles for visualization. d) Expression of representative differentially expressed genes across neoplastic cell states in snRNA-Seq data. e) Gene set enrichment of top differentially expressed genes in each neoplastic cell state using biological process terms from the Gene Ontology database. f) CytoTRACE scores of inferred differentiation states on the UMAP projection of snRNA-Seq data (left) and across each cell state (right). Higher values indicate a more undifferentiated/stem-like state and lower values indicate a more differentiated state. g) Shifts in neoplastic cell state proportions for each patient between initial resection and post-therapy time points in snRNA-Seq (n = 15 paired samples). Post-therapy samples were merged for one patient with three longitudinal samples. A two-sided Wilcoxon signed-rank test for paired samples was used.
Figure 3.
Figure 3.. Transcriptional regulation of pHGG neoplastic cell states
a) UMAP projection of inferred neoplastic cells from snATAC-Seq (95,451 cells) after integration and identification of cell states defined in the snRNA-Seq data; AC, astrocyte; MES, mesenchymal; OPC, oligodendrocyte progenitor cell; NPC, neural progenitor cell; NEU, neural. b) Stacked barplot of cell type proportions of neoplastic cell states across dataset comparing initial resection and post-therapy samples. c) Shifts in neoplastic cell state proportions for each patient between initial resection and post-therapy time points in snATAC-Seq (n = 11 paired samples). Post-therapy samples were merged for one patient with three longitudinal samples. A two-sided Wilcoxon signed-rank test for paired samples was used. d) Heatmap of differential transcription factor (TF) motif accessibility in each pHGG neoplastic cell state. Values are z-score-normalized deviation scores calculated using chromVAR. The differential TF accessibility analysis was performed by a Wilcoxon rank-sum test, comparing chromVAR deviation score between each cell state and the other cell states. The top 20 differential TFs are displayed for each state. e) Overview of top 15 significant transcriptional regulators for each neoplastic cell state based on predicted enhancer-promoter interactions and TF-target gene pairs. The size of the dot indicates the fraction of the total gene targets in the network regulated by each TF. Color indicates chromVAR deviation z-score as in (d). f-g) Transcriptional regulatory networks (TRNs) for (f) MES-like state and (g) OPC/NPC-like state, showing top 50 upregulated genes and top 15 TFs in each TRN. Diamond nodes represent TFs and circle nodes represent target genes. Node size is proportional to the average gene expression for target genes and average chromVAR z-score for TFs. Node color is proportional to the average log2 fold change of the gene in that cell state post-therapy across all cells. Edge line thickness is proportional to the linear regression coefficient for the predicted enhancer-promoter interaction and the fraction of cells with chromatin accessibility at the enhancer peak.
Figure 4.
Figure 4.. The myeloid response to progression and therapy.
a) UMAP projection of annotated tumor-associated myeloid cell populations identified in integrated longitudinal pHGG snRNA-Seq atlas (24,551 cells). BMD, bone marrow-derived; MG, microglia. b) Stacked barplot of myeloid cell type composition across dataset comparing initial resection and post-therapy samples. c) Expression of representative genes across myeloid populations in snRNA-Seq data highlighting top differentially expressed genes. d) Shifts in myeloid cell type proportions for each patient between initial resection and post-therapy time points in snRNA-Seq (n = 15 paired samples). Post-therapy samples were merged for one patient with three longitudinal samples. A two-sided Wilcoxon signed-rank test for paired samples was used. e) Gene set enrichment analysis (GSEA) of Hallmark pathways comparing pathway-level differences in gene expression within myeloid cells overall between initial resection and post-therapy time points. A linear mixed model was used to identify differentially expressed genes between time points while accounting for individual patient variability. f) Heatmap of Spearman correlation coefficients between frequency of neoplastic cell states in the malignant population and frequency of TAM subtypes in the myeloid population across region-stratified samples in the snRNA-Seq data (n = 63). P-values are adjusted using the Benjamini-Hochberg method; *** p <0.001, ** p <0.01, * p <0.05. g) Heatmap showing number of significant interactions between myeloid and neoplastic cell populations across dataset. Interactions were inferred using LIANA and filtered for aggregated consensus rank (adjusted p-value < 0.05). Bars above the heatmap represent total number of significant interactions received (down columns) and bars to the right of the heatmap represent total number of significant interactions sent (across rows) for each cell type, with black lines indicating subset of interactions between myeloid and neoplastic cells. Box highlights interactions from myeloid cells to neoplastic cells.
Figure 5.
Figure 5.. CODEX imaging reveals the spatial landscape of pHGG.
a) Diagram showing the 51-antibody CODEX panel split by target cell population or cellular function. b) Representative CODEX image highlighting tumor mass and substructures of the normal brain. DAPI (blue), Collagen IV (yellow), Neu (cyan), SOX2 (magenta), MOG (white). c) UMAP projection of all 7.5 million cells in the pHGG CODEX dataset across 11 samples after annotation and filtering. d) CODEX image with selected fluorescent markers (left) paired with cell phenotype map (right). Segmentation masks of individual cells are colored by their identity. e) Representative CODEX image demonstrating spatially restricted tumor cell state populations. Proneural tumor cells are stained by CD133 (red) and SOX2 (white) and mesenchymal tumor cells stained by CD44 (green). f) Cell type proportions in each CODEX sample, indicating patient, therapeutic time point, and molecular subtype. g) Heatmap showing relative enrichment of the cell types present in neighborhoods, normalized across neighborhoods (by column). Significant positive cell type enrichments in each neighborhood were calculated using a hypergeometric test, adjusted using the Benjamini-Hochberg method. * p-adjusted <0.001. h) Neighborhood proportions in each CODEX sample, indicating patient, therapeutic time point, and molecular subtype.
Figure 6.
Figure 6.. Identifying resistance mechanisms through in vitro drug screening
a) Left, heatmap of average CNVs within each tumor subclone at the chromosome arm level across 14 patients using Clonalscope. Clone color (top row) corresponds to the patient-specific subclone shown in Extended Data Figure 9a. Right, ratio of binarized copy number gain or loss for each chromosome arm, defined as having an average CNV >1.25 or average CNV <0.75 respectively. For each chromosome arm, a Fisher’s exact test was used to assess for recurrent copy number alterations, adjusted using the Benjamini-Hochberg method. *** p<0.001; ** p<0.01, * p<0.05. b) A linear mixed model was used to identify differentially expressed genes within neoplastic cells overall between initial resection and post-therapy time points accounting for individual patient variability. Volcano plot shows the log fold change and adjusted p-value for each gene included in the model, with selected genes labeled. c) Gene set enrichment analysis (GSEA) of Hallmark and KEGG pathways across all genes in (b) ranked by log fold change. d) Selected results from in vitro drug screening in human pHGG cell lines. Cells were treated with drugs at indicated concentrations, and growth was monitored using a fluorescent reporter 72 hours after drug treatment (n = 24 control, 2 drug-treated replicates each). Positive values indicate a net proliferation, while negative values indicate net cell death. Gene target or mechanism of action is indicated above the drugs. Significance is assessed via a two-sided Student’s t test for each condition compared to DMSO controls and adjusted for multiple hypothesis testing using the Benjamini-Hochberg method, with mean ± SD shown. *** p<0.0001; ** p<0.01, * p<0.05.

References

    1. Ostrom QT, de Blank PM, Kruchko C, et al. Alex’s Lemonade Stand Foundation Infant and Childhood Primary Brain and Central Nervous System Tumors Diagnosed in the United States in 2007–2011. Neuro-Oncol. 2015;16(suppl_10):x1–x36. doi:10.1093/neuonc/nou327 - DOI - PMC - PubMed
    1. Mackay A, Burford A, Carvalho D, et al. Integrated Molecular Meta-Analysis of 1,000 Pediatric High-Grade and Diffuse Intrinsic Pontine Glioma. Cancer Cell. 2017;32(4):520–537.e5. doi:10.1016/j.ccell.2017.08.017 - DOI - PMC - PubMed
    1. Hatoum R, Chen JS, Lavergne P, et al. Extent of Tumor Resection and Survival in Pediatric Patients With High-Grade Gliomas: A Systematic Review and Meta-analysis. JAMA Netw Open. 2022;5(8):e2226551. doi:10.1001/jamanetworkopen.2022.26551 - DOI - PMC - PubMed
    1. Wang Y, Jiang T. Understanding high grade glioma: Molecular mechanism, therapy and comprehensive management. Cancer Lett. 2013;331(2):139–146. doi:10.1016/j.canlet.2012.12.024 - DOI - PubMed
    1. He X, Zhao W, Huang J, et al. Characteristics and trends of globally registered glioma clinical trials in the past 16 years. Ther Adv Neurol Disord. 2022;15:17562864221114355. doi:10.1177/17562864221114355 - DOI - PMC - PubMed

Publication types