

This is a preprint.
Evaluation of Exploratory Fluid Biomarker Results from a Phase 1 Senolytic Trial in Mild Alzheimer's Disease
- PMID: 38496619
- PMCID: PMC10942554
- DOI: 10.21203/rs.3.rs-3994894/v1
Evaluation of Exploratory Fluid Biomarker Results from a Phase 1 Senolytic Trial in Mild Alzheimer's Disease
Update in
-
Evaluation of exploratory fluid biomarkers from a phase 1 senolytic trial in mild Alzheimer's disease.Neurotherapeutics. 2025 Jul;22(4):e00591. doi: 10.1016/j.neurot.2025.e00591. Epub 2025 Apr 23. Neurotherapeutics. 2025. PMID: 40274471 Free PMC article. Clinical Trial.
Abstract
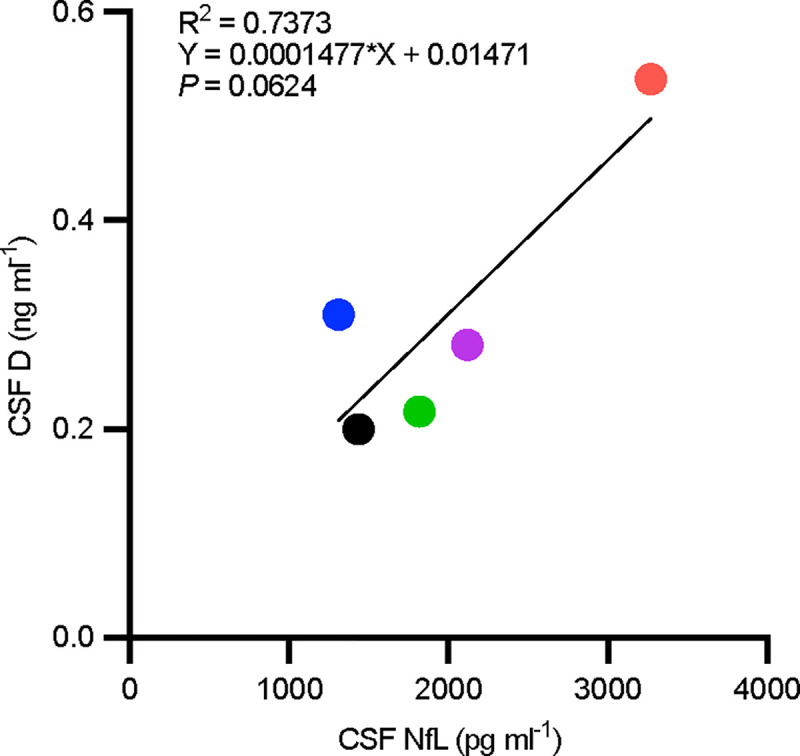
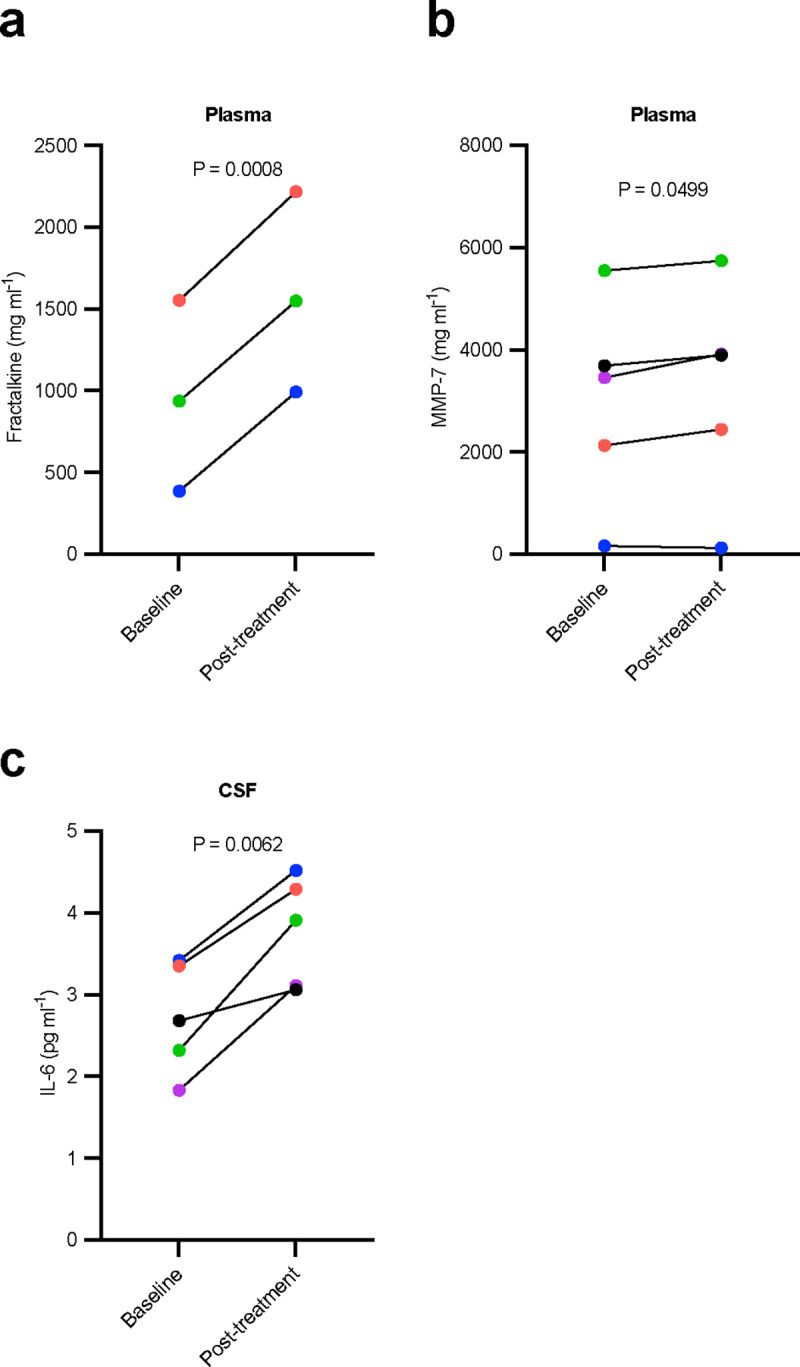
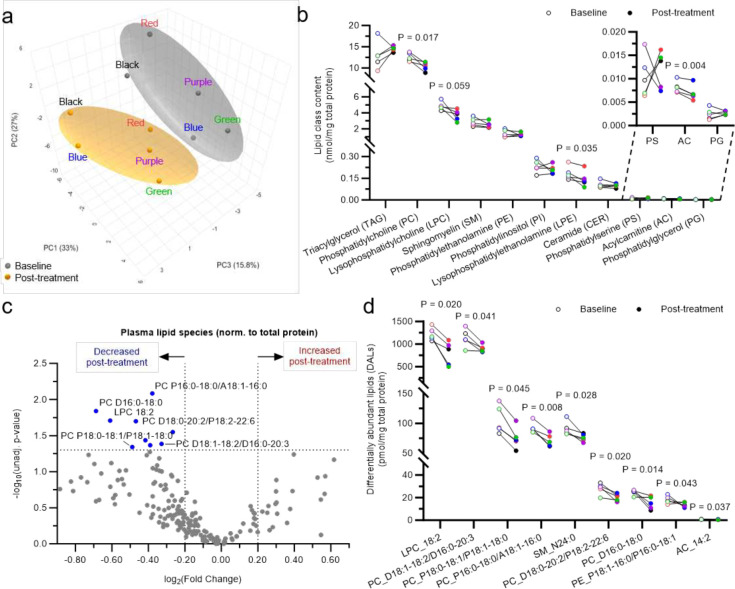
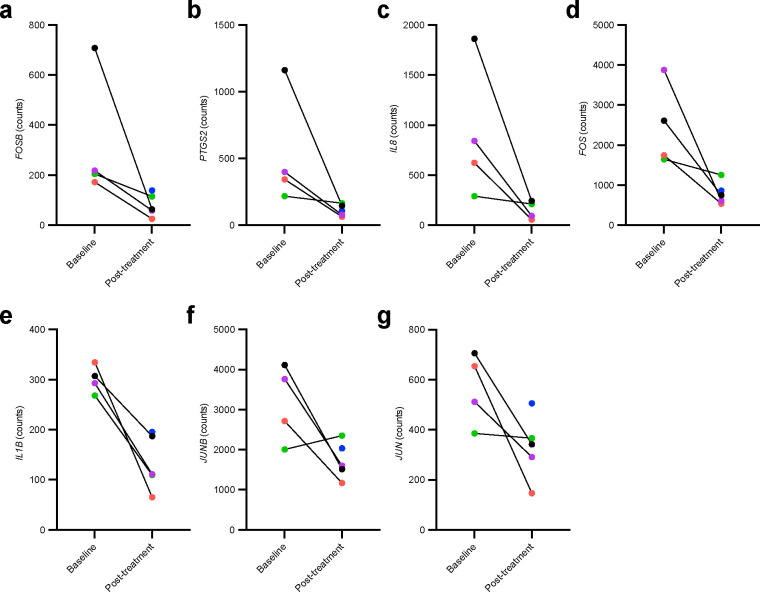
Senescent cell accumulation contributes to the progression of age-related disorders including Alzheimer's disease (AD). Clinical trials evaluating senolytics, drugs that clear senescent cells, are underway, but lack standardized outcome measures. Our team recently published data from the first open-label trial to evaluate senolytics (dasatinib plus quercetin) in AD. After 12-weeks of intermittent treatment, we reported brain exposure to dasatinib, favorable safety and tolerability, and modest post-treatment changes in cerebrospinal fluid (CSF) inflammatory and AD biomarkers using commercially available assays. Herein, we present more comprehensive exploratory analyses of senolytic associated changes in AD relevant proteins, metabolites, lipids, and transcripts measured across blood, CSF, and urine. These analyses included mass spectrometry for precise quantification of amyloid beta (Aß) and tau in CSF; immunoassays to assess senescence associated secretory factors in plasma, CSF, and urine; mass spectrometry analysis of urinary metabolites and lipids in blood and CSF; and transcriptomic analyses relevant to chronic stress measured in peripheral blood cells. Levels of Aß and tau species remained stable. Targeted cytokine and chemokine analyses revealed treatment-associated increases in inflammatory plasma fractalkine and MMP-7 and CSF IL-6. Urinary metabolites remained unchanged. Modest treatment-associated lipid profile changes suggestive of decreased inflammation were observed both peripherally and centrally. Blood transcriptomic analysis indicated downregulation of inflammatory genes including FOS, FOSB, IL1β, IL8, JUN, JUNB, PTGS2. These data provide a foundation for developing standardized outcome measures across senolytic studies and indicate distinct biofluid-specific signatures that will require validation in future studies. ClinicalTrials.gov: NCT04063124.
Conflict of interest statement
Conflict of Interest Statement: R.C.P. receives royalties from Oxford University Press and UpToDate and receives fees from Medscape for educational activities. J.L.K. and T.T. are co-investigators on a patent for Killing Senescent Cells and Treating Senescence-Associated Conditions Using an SRC Inhibitor and a Flavonoid and a patent for Treating Cognitive Decline and Other Neurodegenerative Conditions by Selectively Removing Senescent Cells from Neurological Tissue that are held by Mayo Clinic with royalties paid to Mayo Clinic by Unity Biotechnologies. S.C. reports Scientific Advisory Board membership for T3D Therapeutics and the Neurodegenerative Consortium, and reports other from vTv Therapeutics, Cylcerion, T3D Therapeutics, and Cognito Therapeutics, outside the submitted work. R.J.B. co-founded C2N Diagnostics. Washington University and has equity ownership interest in C2N Diagnostics and receives royalty income based on technology (stable isotope labeling kinetics, blood plasma assay, and methods of diagnosing AD with phosphorylation changes) licensed by Washington University to C2N Diagnostics. R.J.B. receives income from C2N Diagnostics for serving on the scientific advisory board. R.J.B. has received research funding from Avid Radiopharmaceuticals, Janssen, Roche/Genentech, Eli Lilly, Eisai, Biogen, AbbVie, Bristol Myers Squibb, and Novartis. M.M.G. reports personal stock in Abbvie. R.C.P. reports personal fees from Roche, Genetech, Eli Lilly, and Nestle, and no personal fees from Eisai, outside of the submitted work. M.E.O. has a patent Biosignature and Therapeutic Approach for Neuronal Senescence pending.
Figures
References
Publication types
Associated data
Grants and funding
- T32 AG021890/AG/NIA NIH HHS/United States
- R01 NS017950/NS/NINDS NIH HHS/United States
- R01 AG054076/AG/NIA NIH HHS/United States
- RF1 AG059421/AG/NIA NIH HHS/United States
- R01 AG069690/AG/NIA NIH HHS/United States
- P30 AG013319/AG/NIA NIH HHS/United States
- R01 AG068030/AG/NIA NIH HHS/United States
- R01 AG033193/AG/NIA NIH HHS/United States
- TL1 TR002647/TR/NCATS NIH HHS/United States
- P30 AG062677/AG/NIA NIH HHS/United States
- R01 AG068293/AG/NIA NIH HHS/United States
- P30 AG072947/AG/NIA NIH HHS/United States
- U01 DK114920/DK/NIDDK NIH HHS/United States
- I01 BX005717/BX/BLRD VA/United States
- R01 AG075684/AG/NIA NIH HHS/United States
- U24 AG057437/AG/NIA NIH HHS/United States
- U01 AG046170/AG/NIA NIH HHS/United States
- R37 AG013925/AG/NIA NIH HHS/United States
- UF1 NS125417/NS/NINDS NIH HHS/United States
- R01 AG077472/AG/NIA NIH HHS/United States
- U19 AG024904/AG/NIA NIH HHS/United States
- U24 AG059624/AG/NIA NIH HHS/United States
- I01 BX001340/BX/BLRD VA/United States
- R01 AG066524/AG/NIA NIH HHS/United States
- P01 AG062413/AG/NIA NIH HHS/United States
- P30 AG066546/AG/NIA NIH HHS/United States
- P30 AG044271/AG/NIA NIH HHS/United States
- U01 AG006786/AG/NIA NIH HHS/United States
- R33 AG061456/AG/NIA NIH HHS/United States
LinkOut - more resources
Full Text Sources
Medical
Research Materials
Miscellaneous
