

This is a preprint.
Analysis and visualization of quantitative proteomics data using FragPipe-Analyst
- PMID: 38496650
- PMCID: PMC10942459
- DOI: 10.1101/2024.03.05.583643
Analysis and visualization of quantitative proteomics data using FragPipe-Analyst
Update in
-
Analysis and Visualization of Quantitative Proteomics Data Using FragPipe-Analyst.J Proteome Res. 2024 Oct 4;23(10):4303-4315. doi: 10.1021/acs.jproteome.4c00294. Epub 2024 Sep 10. J Proteome Res. 2024. PMID: 39254081
Abstract
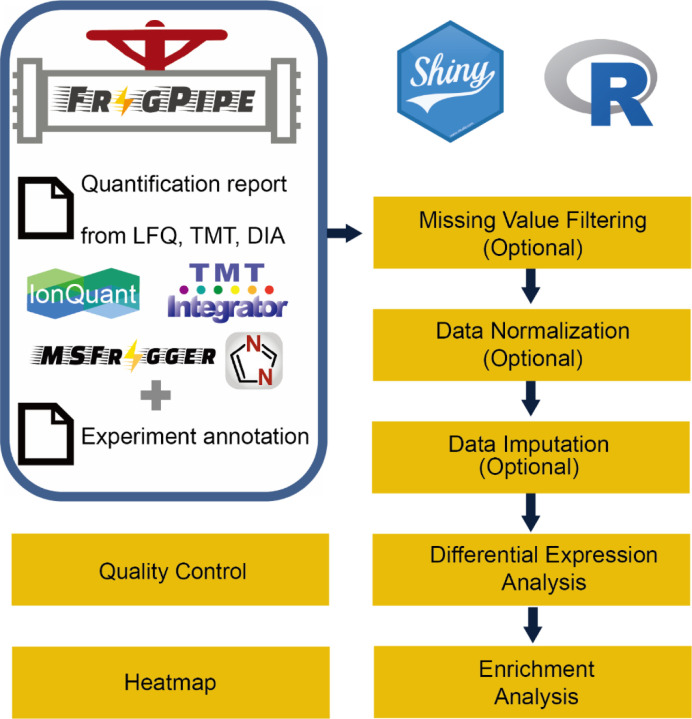
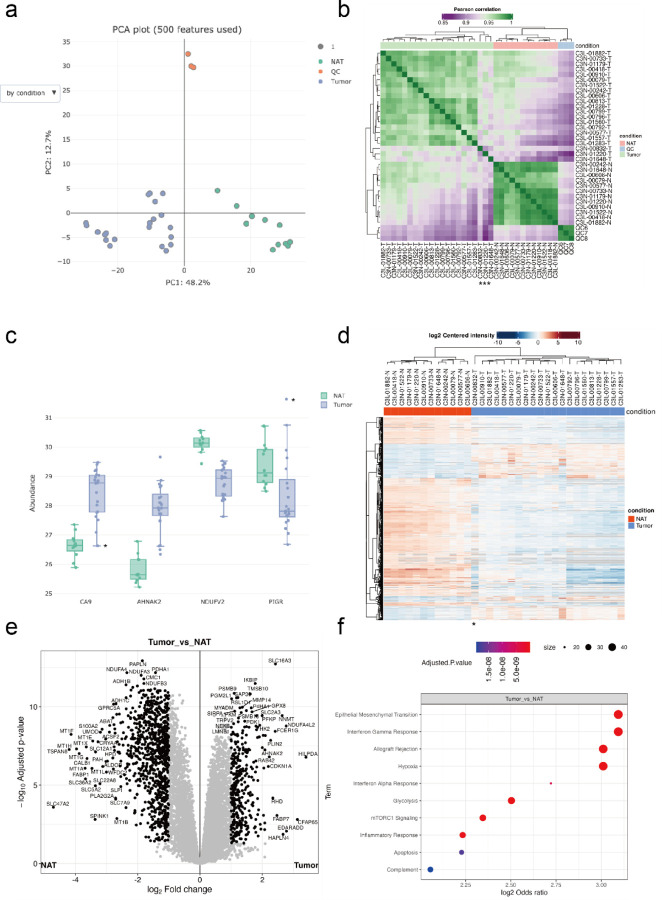
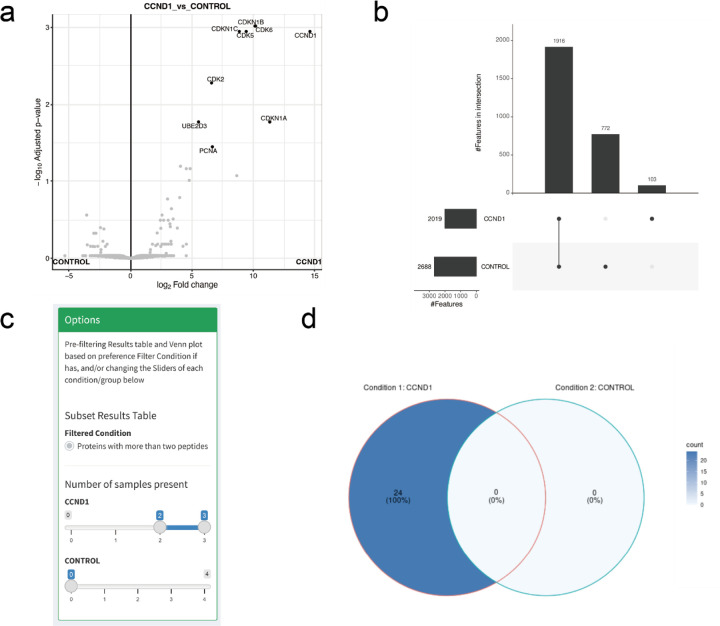
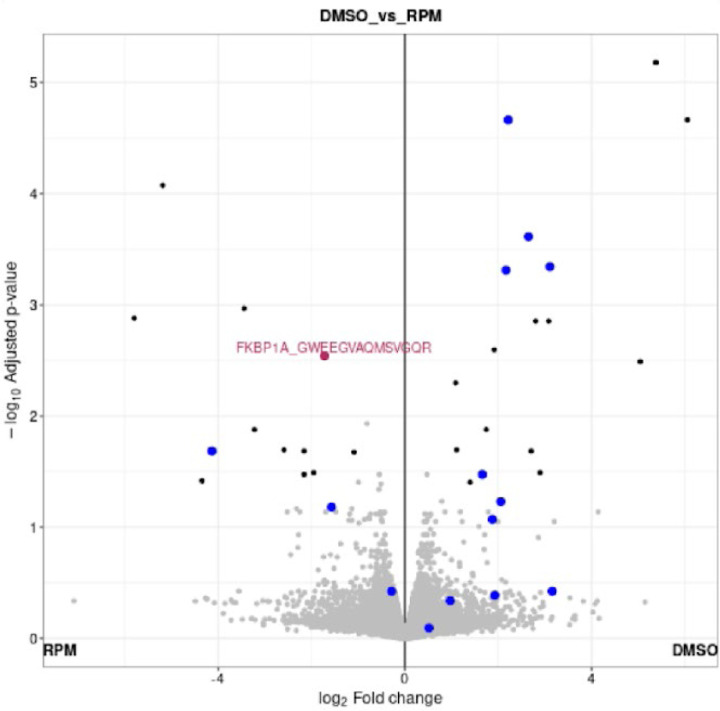
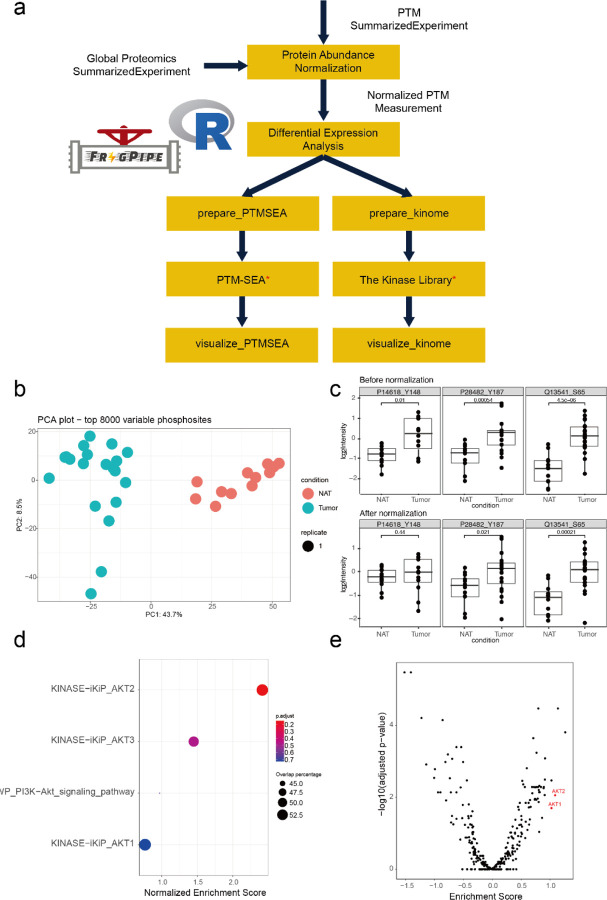
The FragPipe computational proteomics platform is gaining widespread popularity among the proteomics research community because of its fast processing speed and user-friendly graphical interface. Although FragPipe produces well-formatted output tables that are ready for analysis, there is still a need for an easy-to-use and user-friendly downstream statistical analysis and visualization tool. FragPipe-Analyst addresses this need by providing an R shiny web server to assist FragPipe users in conducting downstream analyses of the resulting quantitative proteomics data. It supports major quantification workflows including label-free quantification, tandem mass tags, and data-independent acquisition. FragPipe-Analyst offers a range of useful functionalities, such as various missing value imputation options, data quality control, unsupervised clustering, differential expression (DE) analysis using Limma, and gene ontology and pathway enrichment analysis using Enrichr. To support advanced analysis and customized visualizations, we also developed FragPipeAnalystR, an R package encompassing all FragPipe-Analyst functionalities that is extended to support site-specific analysis of post-translational modifications (PTMs). FragPipe-Analyst and FragPipeAnalystR are both open-source and freely available.
Keywords: AP-MS; FragPipe; LiP-MS; bioinformatics; downstream analysis; open source; protein phosphorylation; software.
Conflict of interest statement
CONFLICT OF INTEREST A.I.N. and F.Y. receive royalties from the University of Michigan for the sale of MSFragger and IonQuant software licenses to commercial entities. All license transactions are managed by the University of Michigan Innovation Partnerships office and all proceeds are subject to university technology transfer policy. The other authors have no competing interests to declare.
Figures
Similar articles
-
Analysis and Visualization of Quantitative Proteomics Data Using FragPipe-Analyst.J Proteome Res. 2024 Oct 4;23(10):4303-4315. doi: 10.1021/acs.jproteome.4c00294. Epub 2024 Sep 10. J Proteome Res. 2024. PMID: 39254081
-
LFQ-Analyst: An Easy-To-Use Interactive Web Platform To Analyze and Visualize Label-Free Proteomics Data Preprocessed with MaxQuant.J Proteome Res. 2020 Jan 3;19(1):204-211. doi: 10.1021/acs.jproteome.9b00496. Epub 2019 Nov 8. J Proteome Res. 2020. PMID: 31657565
-
Phospho-Analyst: An Interactive, Easy-to-Use Web Platform To Analyze Quantitative Phosphoproteomics Data.J Proteome Res. 2023 Sep 1;22(9):2890-2899. doi: 10.1021/acs.jproteome.3c00186. Epub 2023 Aug 16. J Proteome Res. 2023. PMID: 37584946
-
Open source libraries and frameworks for mass spectrometry based proteomics: a developer's perspective.Biochim Biophys Acta. 2014 Jan;1844(1 Pt A):63-76. doi: 10.1016/j.bbapap.2013.02.032. Epub 2013 Mar 1. Biochim Biophys Acta. 2014. PMID: 23467006 Free PMC article. Review.
-
Clinically Relevant Post-Translational Modification Analyses-Maturing Workflows and Bioinformatics Tools.Int J Mol Sci. 2018 Dec 20;20(1):16. doi: 10.3390/ijms20010016. Int J Mol Sci. 2018. PMID: 30577541 Free PMC article. Review.
References
-
- Djomehri S. I.; Gonzalez M. E.; da Veiga Leprevost F.; Tekula S. R.; Chang H.-Y.; White M. J.; Cimino-Mathews A.; Burman B.; Basrur V.; Argani P., Quantitative proteomic landscape of metaplastic breast carcinoma pathological subtypes and their relationship to triple-negative tumors. Nature communications 2020, 11 (1), 1723. - PMC - PubMed
-
- Zhang X.; Smits A. H.; Van Tilburg G. B. A.; Ovaa H.; Huber W.; Vermeulen M., Proteome-wide identification of ubiquitin interactions using UbIA-MS. Nature protocols 2018, 13 (3), 530–550. - PubMed
Publication types
Grants and funding
LinkOut - more resources
Full Text Sources
Miscellaneous