[Preprint]. 2024 Apr 17:2024.03.04.583374.
doi: 10.1101/2024.03.04.583374.

Sarm1 is not necessary for activation of neuron-intrinsic growth programs yet required for the Schwann cell repair response and peripheral nerve regeneration

Affiliations

Sarm1 is not necessary for activation of neuron-intrinsic growth programs yet required for the Schwann cell repair response and peripheral nerve regeneration

Ligia B Schmitd et al. bioRxiv. .

Abstract

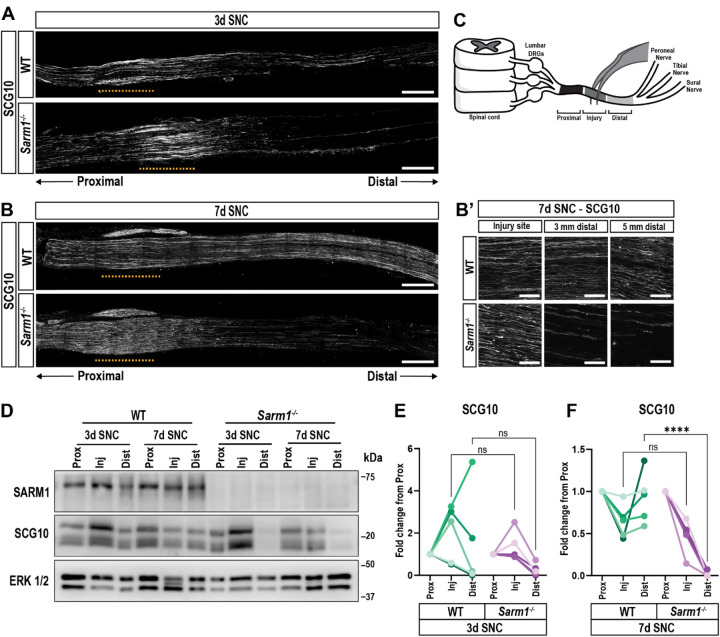
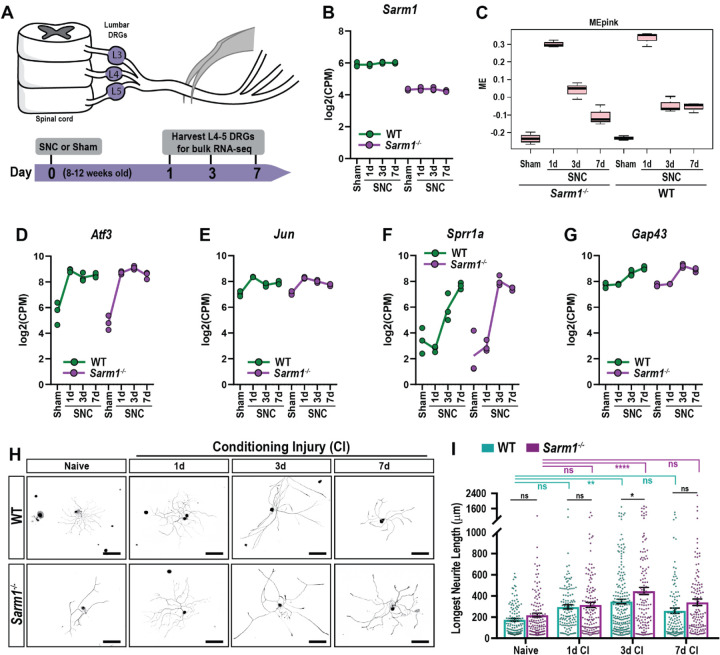
Upon peripheral nervous system (PNS) injury, severed axons undergo rapid SARM1-dependent Wallerian degeneration (WD). In mammals, the role of SARM1 in PNS regeneration, however, is unknown. Here we demonstrate that Sarm1 is not required for axotomy induced activation of neuron-intrinsic growth programs and axonal growth into a nerve crush site. However, in the distal nerve, Sarm1 is necessary for the timely induction of the Schwann cell (SC) repair response, nerve inflammation, myelin clearance, and regeneration of sensory and motor axons. In Sarm1-/- mice, regenerated fibers exhibit reduced axon caliber, defective nerve conduction, and recovery of motor function is delayed. The growth hostile environment of Sarm1-/- distal nerve tissue was demonstrated by grafting of Sarm1-/- nerve into WT recipients. SC lineage tracing in injured WT and Sarm1-/- mice revealed morphological differences. In the Sarm1-/- distal nerve, the appearance of p75NTR+, c-Jun+ SCs is significantly delayed. Ex vivo, p75NTR and c-Jun upregulation in Sarm1-/- nerves can be rescued by pharmacological inhibition of ErbB kinase. Together, our studies show that Sarm1 is not necessary for the activation of neuron intrinsic growth programs but in the distal nerve is required for the orchestration of cellular programs that underlie rapid axon extension.


Figures

Figure 1:
Figure 1:. Impaired PNS regeneration in Sarm1−/− mice.
(A) Schematic of mid-thigh sciatic nerve crush (SNC) injury. Brackets demark the location of injury site, proximal, and distal nerve segments. (B) Semi-thin sciatic nerve cross sections stained with toluidine blue from sham-operated WT and Sarm1−/− mice, and the distal nerve, 49 days post-SNC. Representative images; sham, n = 4 mice per genotype; 49 days post-SNC, n = 6 mice per genotype. Scale bars, 10 μm. (C–E) Quantification of axon diameter, fiber diameter, and g-ratio of sham-operated and distal nerve 49 days post-SNC of WT and Sarm1−/− mice. Data are represented as mean ± SEM. Student’s t-test with Mann-Whitney post hoc test; *p≤ 0.05; **p≤0.01; ***p≤0.001; ns, not significant. (F) Timeline of CAP recordings of acutely excised tibial nerves from naïve and injured WT and Sarm1−/− mice. (G–G”) Representative CAP recordings from naïve and injured WT and Sarm1−/− mice. Calibrations of amplitude (1 mV) and time (0.5 msec) are shown. (H) CAP amplitudes of WT and Sarm1−/− tibial nerves post-SNC, recorded after the designated time points. The amplitude inSarm1−/− nerves is significantly reduced. N = 6 injured mice per group, unilateral sciatic nerve crush (left leg; right leg was used as sham control); Student’s t-test; *p=0.014. (I) Analysis of foot placements on the horizontal ladder beam. The number of drags per 50 septs is shown for WT (green) and Sarm1−/− (purple) mice at 21d and 49d post-SNC. N = 6 mice per genotype, unilateral SNC (left leg). Data are represented as mean ± SEM. Each data point represents one biological replicate. *p = 0.036 by unpaired Student’s t-test. (j) Hindfeet, showing toe spreading of sham-operated, 21d, and 56d SNC WT and Sarm1−/− mice. Scale bar, 1 cm. (K) Longitudinal assessment of toe spreading reflex; mean distance between the tips of the first and fifth toes ± SEM is shown. WT pre-injury, 3d, 21d, and 35d, n = 10 mice; WT 14d and 49d, n = 6 mice; WT 7d, 10d, and 56d, n = 4 mice. Sarm1−/− pre-injury, 3d, 21d, and 35d, n = 9 mice; Sarm1−/− 14d and 49d, n = 5 mice; WT 7d, 10d, and 56d, n = 4 mice. Two-way ANOVA; *p≤ 0.05; ****p≤ 0.0001.
Figure 2:
Figure 2:. Sarm1−/− mice exhibit delayed motor axon regeneration and aberrant endplate innervation.
(A, D, and G) Representative images of whole-mount extensor digitorum longus (EDL) muscles of WT and Sarm1−/− at 14, 21, and 42 days post-SNC. Neuromuscular junctions (NMJ) stained with Bungarotoxin, BTX (postsynaptic), synapsin (pre-synaptic), and βIII tubulin; Tuj1 (axon). Yellow arrows indicate incomplete reinnervation (scores 0–4) and white arrows indicate complete reinnervation (score 5). Scale bar, 50 μm. (B, E, and H) Quantification of NMJ reinnervation by βIII tubulin-labeled axons at 14, 21, and 42 days post-SNC. (C, F, and I) Quantification of NMJ reinnervation by synapsin-labeled presynaptic terminals at 14, 21, and 42 days post-SNC. Number of NMJ analyzed at 14d (WT = 120; Sarm1−/− = 151; n = 3 mice per genotype), 21d (WT = 176, Sarm1−/− = 218; n= 3 mice per genotype), and 42d (WT = 221, Sarm1−/− = 278; n = 3 mice per genotype). Data are represented as mean ± SEM. *p≤0.05; **p≤0.01; ***p≤0.001, by two-Way ANOVA. Quantification of NMJ innervation at different post-injury time points followed the scoring system where score 0 = fully de-innervated and score 5 = fully innervated (Figure S2 for examples).
Figure 3:
Figure 3:. SARM1 is required for the timely regeneration of sensory axons.
(A) Longitudinal sections of 3 days post-SNC WT and Sarm1−/− sciatic nerves stained with anti-SGC10. Yellow dotted lines mark the injury site. Scale bar, 500 μm. (B) Longitudinal sections of 7 days post-SNC WT and Sarm1−/− sciatic nerves stained with anti-SGC10. Yellow dotted lines mark the injury site. Scale bar, 500 μm. (B’) Higher magnification images of SCG10 labeled 7days post-SNC nerves, at the injury site, 3 mm, and 7 mm distal to the injury site. Scale bar, 100 μm. (C) Schematic of lumbar spinal cord, DRGs, and sciatic nerve. Brackets depict nerve segments microdissected for Western blotting. (D) Immunoblots of nerve segments showing SARM1 and SCG10 in the proximal (Prox), injury site (Inj), and distal (Dist) segments of WT and Sarm1−/− mice at 3 and 7 days post-SNC (n = 5 mice per genotype per time point). Anti-ERK1/2 was used as a loading control. (E and F) Quantification of immunoblots shown in (D); n = 5 mice per genotype and time point. Data normalized to ERK1/2 and shown as fold change from proximal nerve for each biological replicate (one-way ANOVA; ****p≤0.0001; ns, not significant).
Figure 4:
Figure 4:. SARM1 is not required for the induction of neuron intrinsic regeneration-associated genes and neurite outgrowth.
(A) Representation timeline of bulk RNA-seq experiment of sciatic DRGs from sham-operated, 1, 3, and 7 days post-SNC (n = 3 mice per time point and genotype). (B)Expression of Sarm1 in WT and Sarm1−/− DRGs, assessed by bulk RNA-seq. CPM, counts per million. (C)Weighted gene co-expression network analysis (WGCNA) of WT and Sarm1−/− DRGs at different post-injury time points. Module Eigen (ME) scores for the Pink module, enriched for regeneration-associated genes. (D–G) Longitudinal expression of the regeneration-associated gene products Atf3, Jun, Sprr1a, and Gap43 in axotomized DRGs. Solid lines represent the mean of 3 biological replicates. CPM, counts per million. (H) Primary DRG neurons prepared from WT and Sarm1−/− mice; without or with a 1, 3, and 7-day conditioning injury (CI). Neurons were stained with anti-NF-H (inverted, black). Single neurons were cropped out of a tiled image. Brightness and contrast were adjusted for clarity, using the same parameters for all images. Scale bars, 200 μm. (I) Quantification of the longest neurite from cultures shown in (H). Each data point equals one neuron (WT and Sarm1−/− naïve, n = 247; WT 1d CI, n = 206; Sarm1−/− 1d CI, n = 252; WT 3d CI, n =434; Sarm1−/− 3d CI, n = 247; WT 7d CI, n = 333; Sarm1−/− 7d CI, n = 230). N = 3 biological replicates per group; one-way ANOVA, *p≤ 0.05; **p≤0.01; ****p≤0.0001; ns, not significant.
Figure 5:
Figure 5:. The Schwann cell repair response is delayed in injured Sarm1−/− mice.
(A and B) Representative images of longitudinal sciatic nerve sections of WT and Sarm1−/− mice at (A) 3 days and (B) 7 days post-SNC stained for Shh transcript (green) and cell nuclei (blue). Yellow dotted lines mark the injury site. Scale bars, 500 μm. (C) Quantification of Shh mean fluorescence intensity. Intervals in each graph represent intensity ± SEM. Letter a, comparison between WT and Sarm1−/− at 3 days post-SNC; b, comparison between WT and Sarm1−/− at 7 days post-SNC. Two-way ANOVA; the number of a and b letters is equivalent to the number of asterisks (*p<0.05; ****p<0.0001); a.u., arbitrary units. N = 3 mice per genotype and time point. (D) Representative images of longitudinal sciatic nerve sections of 3 days post-SNC WT and Sarm1−/− mice stained with anti-p75NTR. Yellow dotted lines mark the injury site. Scale bars, 500 μm; n = 5 mice per genotype. (E) Higher magnification images of p75NTR labeling at the injury site and distal nerve at 3 days post-SNC. Scale bars, 100 μm. (F) Representative images of longitudinal sciatic nerve sections of 7dpc WT and Sarm1−/− mice stained with anti-p75NTR. Yellow dotted lines mark the injury site. Scale bars, 500 μm; n = 5 mice per genotype. (G) Higher magnification images of p75NTR labeling at the injury site and distal nerve at 7 days post-SNC. Scale bar, 100 μm. (H) Western blots of nerve segments for p75NTR and SARM1. Prox (proximal nerve), Inj (injury site), Dist (distal nerve) of WT and Sarm1−/− mice at 3 and 7 days post-SNC (n = 5 mice per genotype; ERK1/2 is shown as loading control). (I and J) Quantification of Western blots shown in (I and J); n = 5 biological replicates with different color shades. Data normalized to ERK1/2 and shown as fold-change compared to the proximal nerve for each biological replicate (one-way ANOVA; **p≤0.01; ***p≤0.001). (K) Western blots of nerve segments for c-Jun and SARM1. Sham nerves, 7 days post-SNC Inj and Dist segments of WT and Sarm1−/− mice are shown (n = 5 mice per genotype; ERK1/2 used as loading control). (L) Quantification of Western blots shown in (K); n= 5 biological replicates with different color shades. Data normalized by ERK1/2 and shown as fold-change compared to sham-operated mice. One-way ANOVA; *p<0.05; ns, not significant.
Figure 6:
Figure 6:. A conditioning lesion is not sufficient to rescue regeneration in Sarm1−/− mice.
(A)Timeline of the double (d)SNC lesion paradigm. Ten days after the first SNC, a second lesion was placed immediately proximal, and nerves harvested 3 days after the second lesion. (B)Longitudinal sections of dSNC WT and Sarm1−/− sciatic nerves showing the injury site and nerve segments 3 mm and 5 mm distal from the injury site, stained for p75NTR (red) and c-Jun (green). Scale bars, 100 μm. (C)Western blots of nerve segments probed for p75NTR, c-Jun, and SARM1. WT and Sarm1−/− nerves from sham-operated mice, dSNC injury site and distal nerve are shown. ERK1/2 was used as loading control. (D, E) Quantification of Western blots shown in (H); 5 biological replicates with different color shades. Data was normalized to ERK1/2 and shown as fold change from sham-operated WT or Sarm1−/− nerves (one-way ANOVA; *p≤0.05; **p≤0.01); ns, not significant. (F)Anti-NF-H labeled DRG neurons from naïve WT mice co-cultured with SC harvested from WT and Sarm1−/− dSNC distal nerves. Scale bars, 250 μm. (G)Quantification of DRG neurite length in cultures shown in (D); WT, 188 cells (n = 3 experiments); Sarm1−/−, 146 cells (n = 3 experiments). Neurite length ± SEM is shown. Student’s t-test; ns; not significant. (H)Longitudinal sections of 3 days post-SNC (single crush) WT and Sarm1−/− nerves stained with anti-SCG10. The yellow dotted lines denote the injury site. Scale bars, 500 μm. (H’) Longitudinal sections of dSNC nerves of WT and Sarm1−/− mice stained with anti-SCG10. The second crush site is marked with white dotted lines. Scale bars, 500 μm (l)Higher magnification images of SCG10-labeled dSNC WT and Sarm1−/− mice at 3 and 5 mm distal to the injury site. Scale bars, 100 μm. (J)Quantification of SCG10 mean fluorescence intensity (MFI) measured at 500 μm intervals from the injury site. Yellow box denotes the first crush site in the dSNC paradigm or the single crush site for the 3 days post-SNC; a, WT single crush vs Sarm1−/− single crush; b, WT single crush vs WT dSNC; c, WT dSNC vs Sarm1−/− dSNC. MFI ± SEM is shown. Number of a, b, or c letters is equivalent to the number of asterisks (*p≤0.05; **p≤0.01; ***p≤0.001). N = 3 mice per group. (K) Longitudinal assessment of toe-spread reflex; mean distance between the tips of the first and fifth toes ± SEM is shown. N = 7 mice per genotype and time point. Two-way ANOVA; **p≤0.01; ***p≤0.001; ****p≤0.0001; ns, not significant
Figure 7:
Figure 7:. A conditioning lesion is not sufficient to rescue nerve inflammation in Sarm1−/− mice.
(A and B) Representative images of F4/80 immunostaining of WT and Sarm1−/− nerves subjected to dSNC (n = 3 mice per genotype). First crush site is marked with yellow dotted line; second crush site with white line. Scale bars (A), 500 μm; (B),100 μm. (C and D) Representative images of CD68 immunostaining of WT and Sarm1−/− nerves subjected to dSNC (n = 3 mice per genotype). First crush site is marked with yellow dotted line; second crush site with white line. Scale bar (C), 500 μm; (D),100 μm. (E) Western blots of nerve segments probed for CD11b and SARM1. Sham nerves, injury site (Inj) and distal nerve (Dist) of dSNC WT and Sarm1−/− nerves are shown. ERK1/2 was used as loading control. (F) Quantification of Western blots shown in (E); 5 biological replicates with different color shades. Data was normalized to ERK1/2 and shown as fold change from sham-operated WT or Sarm1−/− nerves (one-way ANOVA; **p≤0.01; ***p≤0.001; ns; not significant). (G and H) Flow cytometry dotplots for leucocytes (G) and macrophages (H) of dSNC WT and Sarm1−/− sciatic nerves. Nerves were microdissected into injury site and distal nerves. (I–K) Quantification of Myeloid cells (CD11bhi + CD45hi), Lymphocytes (CD11blo + CD45hi), and Macrophages (CD11bhi + F4/80hi) in dSNC nerves separated into injury site and distal nerve of WT and Sarm1−/− mice. N = 3 samples per genotype, with 5 mice per genotype per replica. Flow data are represented as mean ± SEM; two-way ANOVA; **p≤0.01; ***p<0.001.
Figure 8:
Figure 8:. Inhibition of ErbB signaling in Sarm1−/− nerves results in rapid activation of the Schwann cell repair response.
(A and B) Longitudinal nerve sections of dSNC WT and Sarm1−/− mice stained with fluoromyelin (yellow) and cell nuclei (DAPI, blue). First crush site is marked with yellow dotted line; second crush site with white dotted line. N = 5 mice per genotype. Scale bar, 1000 μm. (C) Western blots of nerve segments probed for myelin basic protein (MBP), myelin protein zero (P0), and SARM1. The injury site and distal nerve segments of WT and Sarm1−/− mice are shown, along with nerves from sham-operated mice for comparison. ERK1/2 was used as loading control. (D and E) Quantification of Western blots shown in (C); n = 5 biological replicates with different color shades. Data was normalized to ERK1/2 and shown as fold change compared to sham nerves (one-way ANOVA; *p≤0.05; **p≤0.01; ****p≤0.0001; ns, not significant). (F) Ex vivo cultures of WT and Sarm1−/− sciatic nerve trunks, sectioned after 7, 10, and 14 days in vitro (DIV), and stained with fluoromyelin and anti-p75NTR. Scale bars, 100 μm. (G) Quantification of labeled sections shown in (F). p75NTR mean fluorescence intensity (MFI); a.u., arbitrary units ± SEM. (n = 4 mice per genotype; Student’s t-test, ***p≤0.001; ns, not significant). (H) Ex vivo, Sarm1−/− nerves were cultured for 3 DIV in the presence of vehicle or Canertinib (50 μM). Nerves were stained for p75NTR and c-Jun. Scale bar, 100 μm. (I and J) Quantification of staining from ex vivo nerves treated with vehicle or Canertinib for 3 and 10 DIV. p75NTR MFI (I) and number of c-Jun+ nuclei per mm2 ± SEM (J). a.u., arbitrary units; n = 3–7 mice per genotype and time point; Two-way ANOVA for comparisons across genotypes and Student’s t-tests for comparisons within the same genotype; *p≤0.05; **p≤0.01; ****p≤0.0001; ns, not significant.
Figure 9:
Figure 9:. Sarm1−/− nerve microenvironment is not conducive for nerve regeneration.
(A)Schematic of the sciatic nerve grafting experiment. A WT or Sarm1−/− nerve segment was grafted into a WT host. Coaptation of the graft was done only at the proximal end. Intraoperative and harvested graft images are shown. Scale bars, 1 mm. (B)Representative longitudinal nerve sections showing WT and a Sarm1−/− grafts (dotted lines) after 14 days, stained with fluoromyelin (yellow), cell nuclei (DAPI, blue), and anti-p75NTR. High magnification images on the right show difference in myelin integrity between WT and Sarm1−/− grafts. Scale bars for low magnification, 500 μm; scale bars for high magnification, 100 μm. (C)Nerve sections of WT and Sarm1−/− grafts stained with anti-SCG10 and anti-p75NTR. (D)High magnification of WT and Sarm1−/− grafts stained with anti-p75NTR and anti-SCG10. Scale bars, 100 μm. (E and F) Quantification of p75NTR and SCG10 mean fluorescence intensity ± SEM at 500 μm intervals within the grafts (n = 4–6 biological replicates per genotype). Student’s t-tests at each individual distance; *p≤0.05; **p≤0.01; ****p≤0.0001; ns, not significant.

References

    1. Arthur-Farraj P. J., Latouche M., Wilton D. K., Quintes S., Chabrol E., Banerjee A., Woodhoo A., Jenkins B., Rahman M., Turmaine M., Wicher G. K., Mitter R., Greensmith L., Behrens A., Raivich G., Mirsky R., and Jessen K. R.. 2012. ‘c-Jun reprograms Schwann cells of injured nerves to generate a repair cell essential for regeneration’, Neuron, 75: 633–47. - PMC - PubMed
    1. Bartmeyer P. M., Biscola N. P., and Havton L. A.. 2021. ‘A shape-adjusted ellipse approach corrects for varied axonal dispersion angles and myelination in primate nerve roots’, Sci Rep, 11: 3150. - PMC - PubMed
    1. Bastien D., and Lacroix S.. 2014. ‘Cytokine pathways regulating glial and leukocyte function after spinal cord and peripheral nerve injury’, Exp Neurol, 258: 62–77. - PubMed
    1. Beirowski B., Adalbert R., Wagner D., Grumme D. S., Addicks K., Ribchester R. R., and Coleman M. P.. 2005. ‘The progressive nature of Wallerian degeneration in wild-type and slow Wallerian degeneration (WldS) nerves’, BMC Neurosci, 6: 6. - PMC - PubMed
    1. Belgrad J., De Pace R., and Fields R. D.. 2020. ‘Autophagy in Myelinating Glia’, J Neurosci, 40: 256–66. - PMC - PubMed

Publication types