. 2024 Mar 18:12:RP91433.
doi: 10.7554/eLife.91433.

Dynamic 1D search and processive nucleosome translocations by RSC and ISW2 chromatin remodelers

Affiliations

Dynamic 1D search and processive nucleosome translocations by RSC and ISW2 chromatin remodelers

Jee Min Kim et al. Elife. .

Abstract

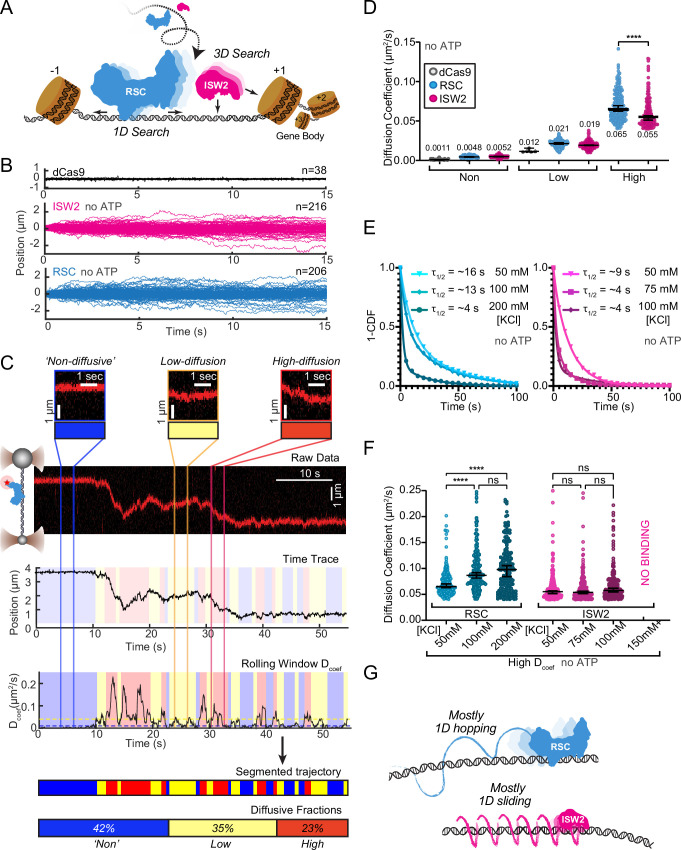
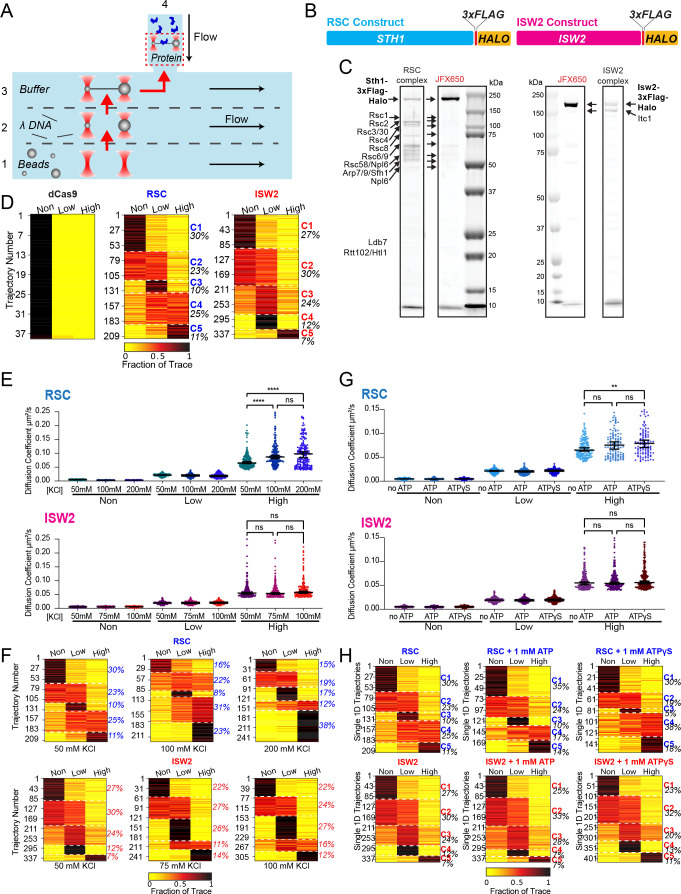
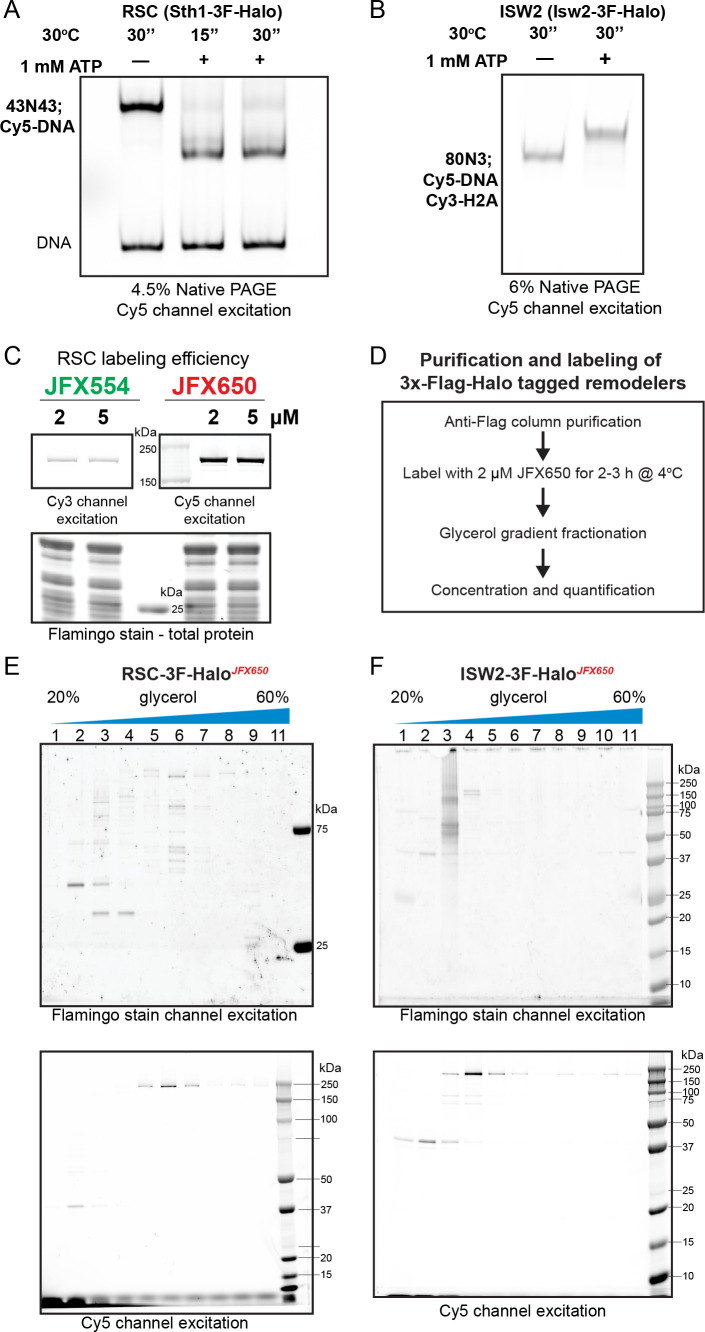
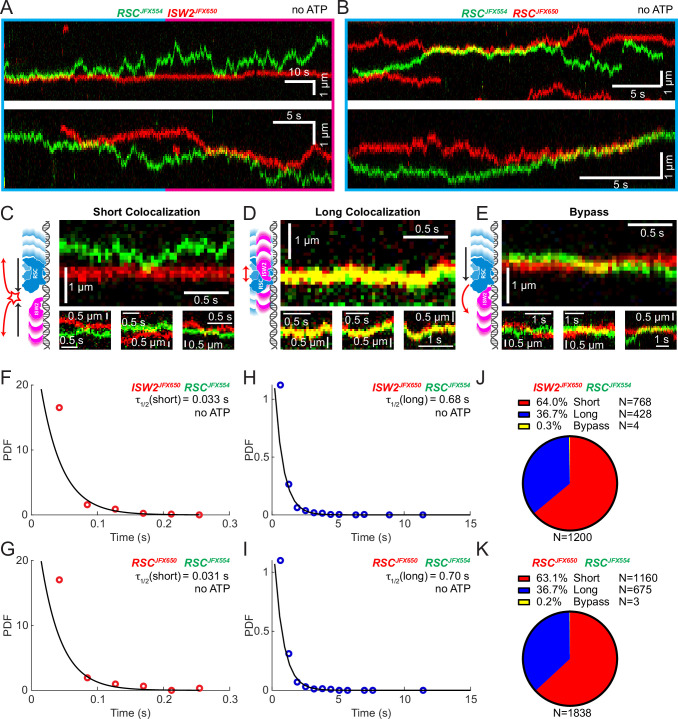
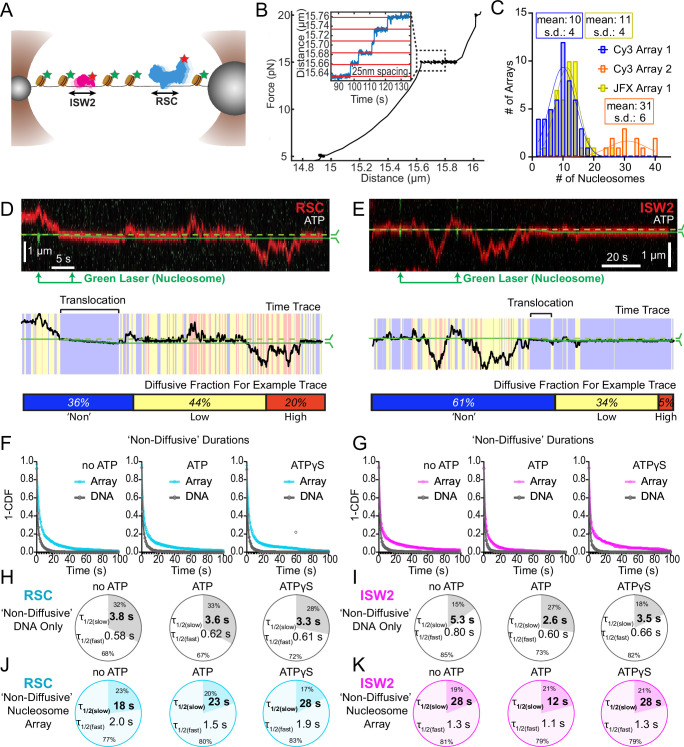
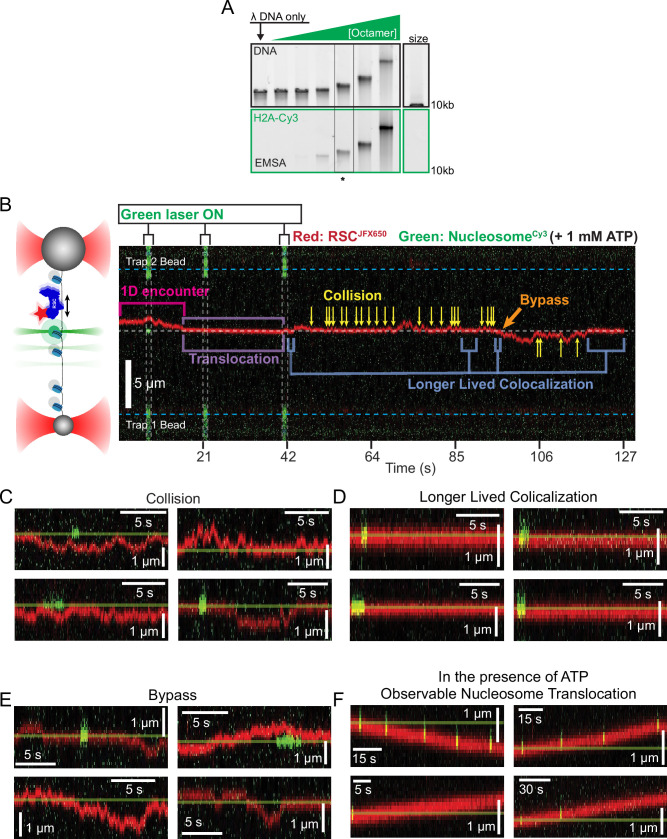
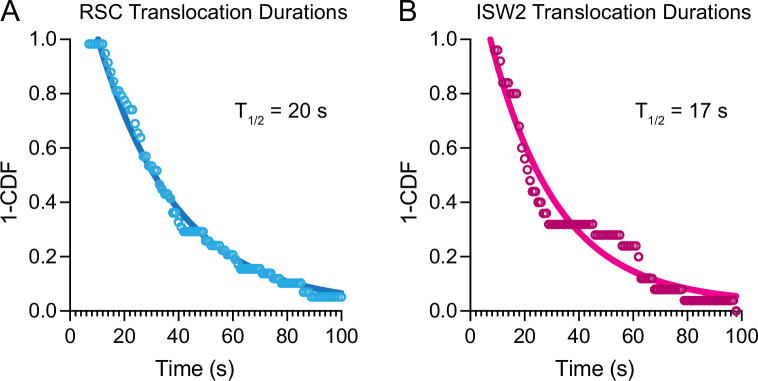
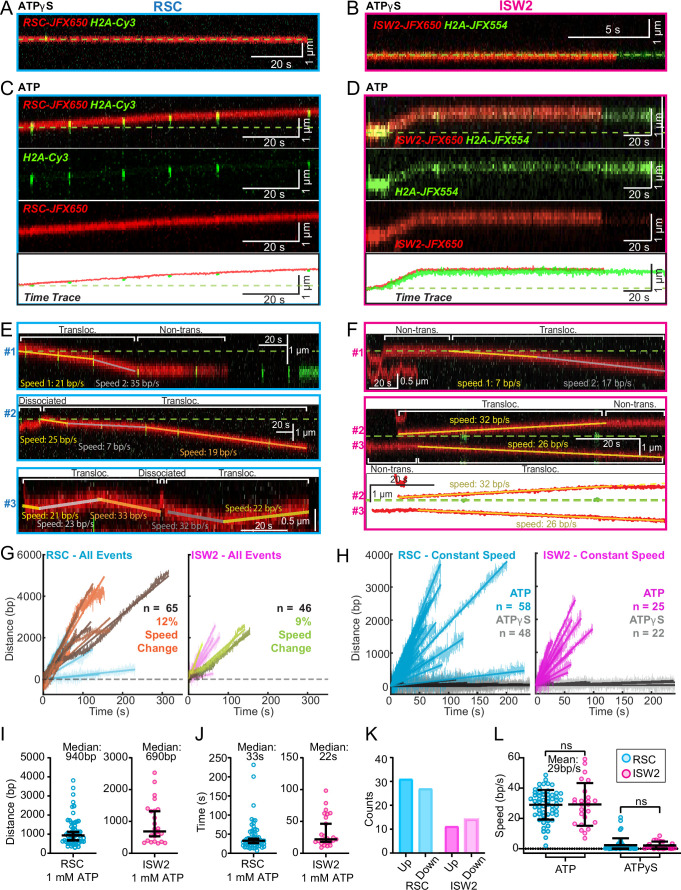
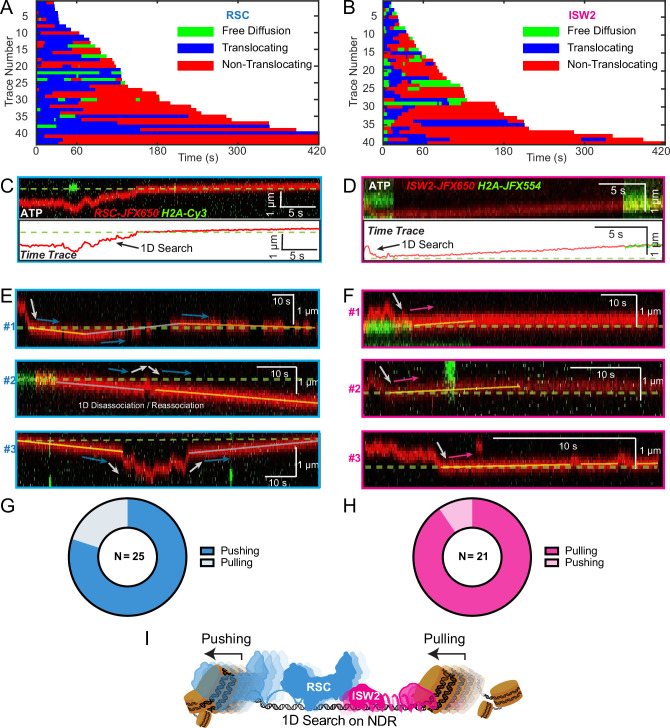
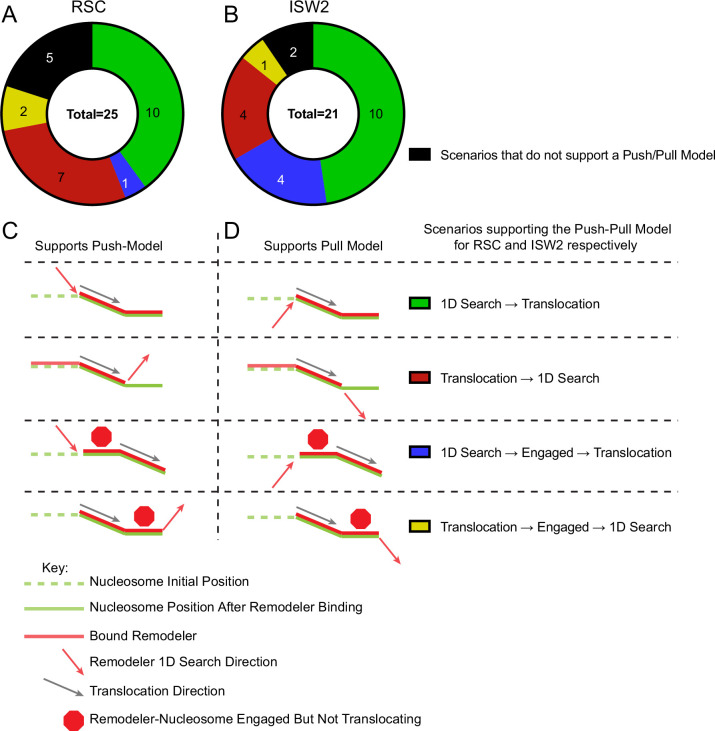
Eukaryotic gene expression is linked to chromatin structure and nucleosome positioning by ATP-dependent chromatin remodelers that establish and maintain nucleosome-depleted regions (NDRs) near transcription start sites. Conserved yeast RSC and ISW2 remodelers exert antagonistic effects on nucleosomes flanking NDRs, but the temporal dynamics of remodeler search, engagement, and directional nucleosome mobilization for promoter accessibility are unknown. Using optical tweezers and two-color single-particle imaging, we investigated the Brownian diffusion of RSC and ISW2 on free DNA and sparse nucleosome arrays. RSC and ISW2 rapidly scan DNA by one-dimensional hopping and sliding, respectively, with dynamic collisions between remodelers followed by recoil or apparent co-diffusion. Static nucleosomes block remodeler diffusion resulting in remodeler recoil or sequestration. Remarkably, both RSC and ISW2 use ATP hydrolysis to translocate mono-nucleosomes processively at ~30 bp/s on extended linear DNA under tension. Processivity and opposing push-pull directionalities of nucleosome translocation shown by RSC and ISW2 shape the distinctive landscape of promoter chromatin.

Keywords: ISW2; RSC; chromatin remodelers; chromosomes; gene expression; molecular biophysics; none; optical tweezers; single molecule; structural biology; target search.


Conflict of interest statement

JK, CC, SJ, ZX, XF, MY, MP, KH, TH, CW No competing interests declared, JG US Patent 11,091,643 describing deuterated fluorophores and variant compositions are assigned to HHMI, LL Founder and shareholder of Eikon Therapeutics. US Patent 11,091,643 describing deuterated fluorophores and variant compositions are assigned to HHMI

Figures

Figure 1.
Figure 1.. RSC and ISW2 diffusion on lambda DNA and impacts of ionic strength.
(A) Schematic: RSC and ISW2 bind nucleosome-free DNA at yeast promoters. (B) Aligned trajectories for RSC, ISW2, and dCas9. (C) Rolling-window analysis assigns diffusion coefficients (Dcoef) and percentages for non-diffusive, low, and high diffusion. (D) Heterogeneous one-dimensional (1D) diffusion of RSC and ISW2 on lambda DNA (50 mM KCl, no ATP). Scatter violin plots show mean Dcoef per diffusion type. Mann–Whitney tests compare RSC vs ISW2 distributions in the high-diffusive category, asterisks indicate significance. Median Dcoef values with 95% confidence intervals are shown. (E) Dwell times for RSC and ISW2 at varying KCl concentrations; single-exponential decay fit to the 1-cumulative distribution function (CDF) and half-lives shown. (F) Ionic strength impact on high-mobility diffusion at different KCl concentrations. Scatter violin plots depict median values and 95% confidence intervals, asterisks indicate significance. (G) Model: RSC primarily undergoes 1D hopping, while ISW2 performs helically coupled 1D sliding.
Figure 1—figure supplement 1.
Figure 1—figure supplement 1.. RSC and ISW2 diffusion analysis under varied conditions.
(A) Schematic of the microfluidics chamber used, with four solution compartments (1–3 separated by laminar flow, 4 as reservoir). (B) Construct map displaying RSC and ISW2 labeling via 3x-FLAG tag and HaloTag at C-terminus of ATPase subunits. (C) Sodium dodecyl sulfate–polyacrylamide gel electrophoresis (SDS–PAGE) gel showing JFX650-labeled purified RSC (left) and ISW2 (right) complexes, with protein visualization using Flamingo dye. (D) Proportion of dCas9, RSC, and ISW2 traces in three diffusion categories under baseline conditions (50 mM KCl, no ATP). K-means clustering identifies five distinct diffusion behaviors (C1–5), with percentage of traces in each group. (E, G) Scatter violin plots show mean diffusion coefficients for 'non-diffusive', low, and high diffusion groups. Mann–Whitney tests compare RSC and ISW2 distributions in the high-diffusive category, asterisks indicate significance. Median Dcoef values and 95% confidence intervals are represented. (F, H) Proportion of traces in the three diffusion categories; K-means clustering identifies five diffusion classes (C1–5) with percentage of each group printed. (E, F) Effects of salt on diffusion: 50, 100, and 200 mM KCl for RSC, and 50, 75, and 100 mM KCl for ISW2 (no binding detected at 200 mM KCl for ISW2). (G, H) Effects of nucleotide on diffusion: no ATP, 1 mM ATP, and 1 mM ATPγS.
Figure 1—figure supplement 2.
Figure 1—figure supplement 2.. Halo-tagged remodeler functional validation, labeling, and purification.
Native PAGE analysis of nucleosome sliding by HaloTagged RSC (A) and ISW2 (B). RSC shifts centered nucleosomes (43N43; Cy5-DNA) to end positions, while ISW2 moves end-positioned nucleosomes (80N3; Cy5-DNA, Cy3-H2A) to a centered position. (C) Assessment of protein labeling efficiency using fluorescence intensity of the fluorophore label; protein resolved via sodium dodecyl sulfate–polyacrylamide gel electrophoresis (SDS–PAGE) gel and scanned using a Typhoon imager. (D) Flow-chart of protein labeling and purification. Fractions from glycerol gradient purification of labeled protein run on SDS–PAGE gels and imaged for fluorophore label and total protein content using a Typhoon imager for (E) RSC-JFX650 and (F) ISW2-JFX650 preparations.
Figure 2.
Figure 2.. Bimolecular remodeler–remodeler interactions during one-dimensional (1D) encounters on DNA.
Two-color kymographs of RSC-JFX554 and ISW2-JFX650 (A) or RSC-JFX554 and RSC-JFX650 (B) diffusing together on naked DNA. Three types of encounter events are observed: short colocalizations (C), long colocalizations (D), and bypass events (E). Representative kymograph sections and corresponding cartoons illustrate each interaction. Dwell times of short colocalization events for RSC–ISW2 (F) and RSC–RSC (G). Dwell times of long colocalization events for RSC–ISW2 (H) and RSC–RSC (I). Interaction lifetimes are determined by measuring the time remodelers spend in close proximity. Interaction half-lives (τ) are calculated from single-exponential fits to probability distribution functions (PDF) plots of lifetimes. Proportions of each event type quantified as pie charts for RSC–ISW2 (J) and RSC–RSC (K).
Figure 2—figure supplement 1.
Figure 2—figure supplement 1.. Detection of remodeler–remodeler interactions and dwell-time estimation.
(A) Simulated images illustrating diffusive molecules and camera noise, with distinct molecule types shown in different colors. (B) Single-molecule trajectories obtained from the analysis of images in (A). (C) Plot of the distance between the two molecules (blue) with interaction length indicated by gray (longer-lived) or red (short-lived) shaded regions. Short interactions are defined as lasting less than 5 frames and showing higher distance changes compared to the mean displacement. (D–F) Magnified versions of (A–C) for improved visualization.
Figure 3.
Figure 3.. Nucleosomes constrain one-dimensional (1D) diffusion of RSC and ISW2.
(A) Optical tweezers and confocal microscopy assay for measuring remodeler diffusion on lambda DNA nucleosome arrays. (B) Force distance plots are used to assess the number of nucleosomes on arrays, with ~25 nm lengthening per nucleosome at 15 pN (inset). (C) Histograms show nucleosome numbers per array for three arrays used, with mean values and standard deviations. Kymograph segments of RSC (D) and ISW2 (E) encountering a nucleosome on the array with 1 mM ATP. Diffusion levels are binned on time trace plots. As a note, nucleosome translocation occurs in each example with the original position of the nucleosome marked by the dashed green line and the changing nucleosome position is marked by the solid green line. Translocation events fall into the ‘non-diffusive’ category due to their slow motion. Survival plots of dwell times in the ‘non-diffusive’ state for RSC (F) and ISW2 (G) on naked DNA or nucleosome array. (H–K) Half-lives are determined using double exponential fits and are indicated for the slow and fast percentages (pie charts). Values are given for various ATP conditions and for diffusion on naked DNA (RSC; H-ISW2; II) and nucleosome array (RSC; J-ISW2; K).
Figure 3—figure supplement 1.
Figure 3—figure supplement 1.. Remodeler–nucleosome interactions and nucleosome sliding assays.
(A) Electrophoretic mobility shift assay (EMSA) of lambda nucleosome arrays with increasing octamer concentration. The asterisk indicates a condition that produced ~10 nucleosomes/array. (B) Representative kymograph of remodeler diffusion on a nucleosome array, accompanied by a schematic for interpretation. The green laser is pulsed to extend the fluorophore’s lifetime. Remodeler–nucleosome interactions are indicated within the kymograph, with additional examples shown in panels C–F. (C, D) Examples of RSC–nucleosome interactions, which share visual similarities with ISW2–nucleosome interactions. (C) Remodelers colliding with nucleosomes without extended interaction. (D) Prolonged colocalization events without translocation. (E) Bypass events where the remodeler passes a nucleosome. (F) Observable nucleosome translocation events, with the starting position marked as a reference.
Figure 3—figure supplement 2.
Figure 3—figure supplement 2.. Nucleosome translocation durations and half-lives.
1-Cummulative distribution function (CDF) survival curves of nucleosome translocation events for (A) RSC and (B) ISW2 in the presence of 1 mM ATP. Half-lives from single-exponential fitting printed in graph.
Figure 4.
Figure 4.. ATP-dependent processive nucleosome translocation by RSC and ISW2.
Kymographs of RSC (A) and ISW2 (B) showing static colocalization in 1 mM ATPγS. Kymographs of RSC (C) and ISW2 (D) moving directionally with nucleosome signals in 1 mM ATP. The green laser is either blinked or continuous, and the initial position of the nucleosome is marked with a dashed green line. Additional examples of nucleosome translocation events for (E) RSC and (F) ISW2. Examples include cases with speed or direction changes and cases where speed remains constant. Speed changes or pauses are indicated by a dashed continuation of the translocation event line. Special events like bypass or brief periods of one-dimensional (1D) search are annotated. Speed values are directly displayed on the kymograph. An example of RSC translocation changing direction is provided, along with a kymograph showing two ISW2 translocation events in opposite directions with an immobile nucleosome as a reference. (G) Linear fit to all translocation events that are moving in the same direction, highlighting speed changes. (H) Linear fits to constant-speed segments (>300 bp, >5 s, r2 > 0.5), with ATPγS static colocalization controls in gray. (I) Scatter plot of distance (base pairs) covered by single-speed segments. (J) Scatter plot of time duration (seconds) of single-speed segments. (K) Directionality of translocation with respect to the tether orientation indicating random preference for translocation direction on DNA when not accounting for the 1D approach direction. (L) Scatter plots of translocation speeds for RSC (cyan) and ISW2 (magenta), including mean values and standard deviation error bars; ATPγS control shown alongside the hydrolysable ATP condition.
Figure 5.
Figure 5.. Translocation direction relative to one-dimensional (1D) diffusion on linker DNA supports RSC and ISW2 ‘push–pull’ models.
Trace fragmentation plots illustrate translocating regardless of changes in speed or changes in direction (blue), non-translocating (red), and free diffusion (green) segments for RSC (A) and ISW2 (B). Examples of translocation events following 1D encounter for RSC (C) and ISW2 (D) shown alongside single-particle traces for clarity. (E, F) Additional examples of RSC and ISW2 encountering a nucleosome through 1D diffusion and directionally translocating it. Arrows indicate the direction of the remodeler’s approach and subsequent nucleosome translocation. Pie charts of ‘pushing’ and ‘pulling’ counts for RSC (G) and ISW2 (H); all types of observations considered. (I) Summary schematic.
Figure 5—figure supplement 1.
Figure 5—figure supplement 1.. Various translocation scenarios support the push–pull model for RSC–ISW2.
Pie charts of ‘pushing’ and ‘pulling’ counts for RSC (A) and ISW2 (B); various translocation scenarios are displayed separately within the pie chart. The identities of the wedges are indicated with a legend shown alongside schematics of the various scenarios (C, D), where (C) shows scenarios that support the push model whereas (D) shows scenarios that support the pull model. A key to interpret the schematic is displayed below.

Update of

Similar articles

Cited by

References

    1. Ahmadi A, Rosnes I, Blicher P, Diekmann R, Schüttpelz M, Glette K, Tørresen J, Bjørås M, Dalhus B, Rowe AD. Breaking the speed limit with multimode fast scanning of DNA by Endonuclease V. Nature Communications. 2018;9:5381. doi: 10.1038/s41467-018-07797-4. - DOI - PMC - PubMed
    1. Albert I, Mavrich TN, Tomsho LP, Qi J, Zanton SJ, Schuster SC, Pugh BF. Translational and rotational settings of H2A.Z nucleosomes across the Saccharomyces cerevisiae genome. Nature. 2007;446:572–576. doi: 10.1038/nature05632. - DOI - PubMed
    1. Badis G, Chan ET, van Bakel H, Pena-Castillo L, Tillo D, Tsui K, Carlson CD, Gossett AJ, Hasinoff MJ, Warren CL, Gebbia M, Talukder S, Yang A, Mnaimneh S, Terterov D, Coburn D, Li Yeo A, Yeo ZX, Clarke ND, Lieb JD, Ansari AZ, Nislow C, Hughes TR. A library of yeast transcription factor motifs reveals A widespread function for Rsc3 in targeting nucleosome exclusion at promoters. Molecular Cell. 2008;32:878–887. doi: 10.1016/j.molcel.2008.11.020. - DOI - PMC - PubMed
    1. Bagchi B, Blainey PC, Xie XS. Diffusion constant of a nonspecifically bound protein undergoing curvilinear motion along DNA. The Journal of Physical Chemistry. B. 2008;112:6282–6284. doi: 10.1021/jp077568f. - DOI - PubMed
    1. Basu A, Bobrovnikov DG, Qureshi Z, Kayikcioglu T, Ngo TTM, Ranjan A, Eustermann S, Cieza B, Morgan MT, Hejna M, Rube HT, Hopfner K-P, Wolberger C, Song JS, Ha T. Measuring DNA mechanics on the genome scale. Nature. 2021;589:462–467. doi: 10.1038/s41586-020-03052-3. - DOI - PMC - PubMed

MeSH terms