. 2024 Jun 3;223(6):e202312106.
doi: 10.1083/jcb.202312106. Epub 2024 Mar 18.

Fascin-induced bundling protects actin filaments from disassembly by cofilin

Affiliations

Fascin-induced bundling protects actin filaments from disassembly by cofilin

Jahnavi Chikireddy et al. J Cell Biol. .

Abstract

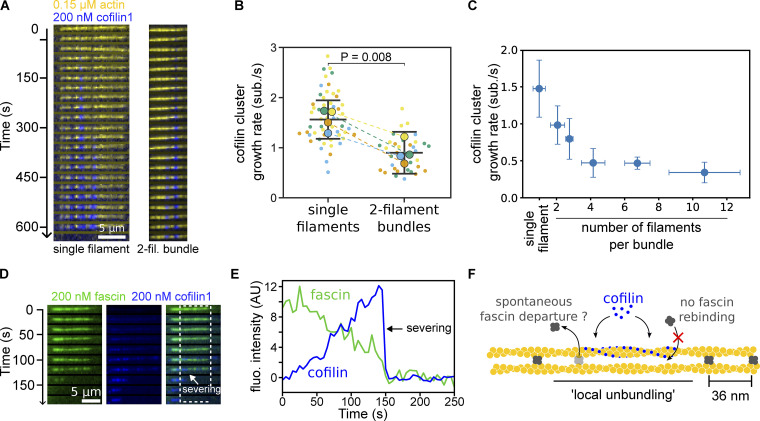
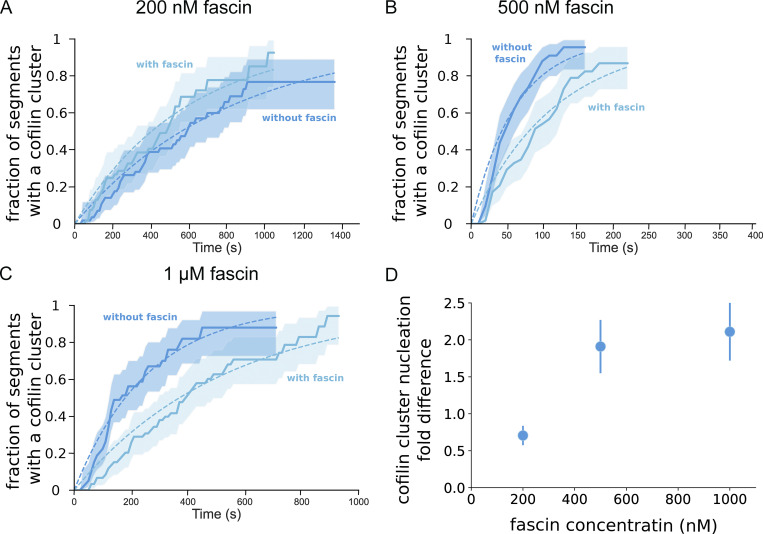
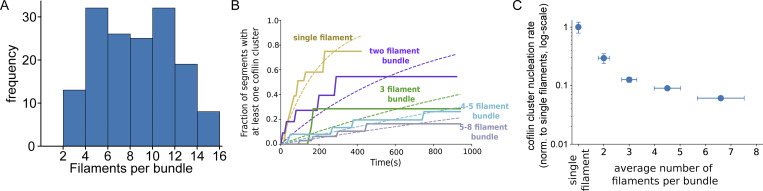
Actin filament turnover plays a central role in shaping actin networks, yet the feedback mechanism between network architecture and filament assembly dynamics remains unclear. The activity of ADF/cofilin, the main protein family responsible for filament disassembly, has been mainly studied at the single filament level. This study unveils that fascin, by crosslinking filaments into bundles, strongly slows down filament disassembly by cofilin. We show that this is due to a markedly slower initiation of the first cofilin clusters, which occurs up to 100-fold slower on large bundles compared with single filaments. In contrast, severing at cofilin cluster boundaries is unaffected by fascin bundling. After the formation of an initial cofilin cluster on a filament within a bundle, we observed the local removal of fascin. Notably, the formation of cofilin clusters on adjacent filaments is highly enhanced, locally. We propose that this interfilament cooperativity arises from the local propagation of the cofilin-induced change in helicity from one filament to the other filaments of the bundle. Overall, taking into account all the above reactions, we reveal that fascin crosslinking slows down the disassembly of actin filaments by cofilin. These findings highlight the important role played by crosslinkers in tuning actin network turnover by modulating the activity of other regulatory proteins.


Conflict of interest statement

Disclosures: The authors declare no competing interests exist.

Figures

Figure 1.
Figure 1.
Fascin-induced actin filament bundling slows down the recruitment of cofilin. (A) 10% Alexa-488 labeled actin filaments, grown and aged for 15 min from surface-anchored seeds, in the absence or presence of 200 nM human-fascin1, in a buffer containing 0.2% methylcellulose, are subsequently exposed to 80 nM mCherry-cofilin1 at time 0 (see Materials and methods). (B) Fluorescence images showing the different channels from the white box shown in A, in the presence of fascin. (C) Fluorescence intensity of bound cofilin, normalized by the amount of F-actin, as a function of time. Both curves increase roughly linearly. Linear fitting indicates that cofilin binding to single actin filaments is 15 times faster than on fascin-induced actin filament bundles (N = 3 independent experiments). Shaded areas represent SD.
Figure 2.
Figure 2.
Cofilin fragments fascin-induced bundles slower than single filaments. (A) Schematics of the sequential steps to investigate fascin-induced two-filament bundle fragmentation by cofilin. Inside a microfluidic chamber, actin filaments were grown from randomly positioned surface-anchored seeds and aligned by the flow (step 1). Once elongated, filaments were aged and allowed to form two-filament bundles in the presence of fascin and actin for 15 min (step 2). They are then exposed to cofilin, actin, and fascin (step 3). Note that isolated filaments did not bundle and were used as reference single filaments for side-by-side comparison. (B) Result from a typical experiment showing the fragmentation, over time, of single actin filaments (n = 53) and two-filament bundles (n = 47) upon exposure to 200 nM cofilin, 0.15 µM actin, and 200 nM fascin. 95% confidence intervals are shown as shaded surfaces. There is an approximately ninefold difference in the rate of decay of those two populations, as obtained by single exponential fits (lines). (C) Fragmentation rates of single actin filaments and two-filament bundles when exposed to 200 nM cofilin. Rates are obtained from exponential fits as shown in B. Dashed lines indicate paired data points from single filament and bundle populations acquired simultaneously in the same microfluidics chamber (N = 3 independent experiments; n = 53, 21, 29 single filaments; n = 47, 21, 30 two-filament bundles). Rates and error bars are obtained from exponential fits as shown in B. (D) Actin filaments were polymerized from spectrin–actin seeds adsorbed onto micron-sized glass beads to create larger bundles in an experiment otherwise similar to the one shown in A. Note that non-productive spectrin–actin seeds on beads are targeted by cofilin (blue), as revealed by the cofilin fluorescence appearing on the surface of the bead. (E) Survival fractions of intact 5-µm long segments of single actin filaments (n = 12) or filament bundles (n = 30, average size 9.3 (±3.2) filaments per bundle), upon exposure to 200 nM cofilin and 200 nM fascin, as a function of time. 95% confidence intervals are shown as shaded surfaces. There is a ∼40-fold difference in the rates at which these two populations decrease, as obtained by single exponential fits (lines). (F) Schematics of the reactions that lead to cofilin-induced severing. The fragmentation of single filaments (left) results from the severing of one cofilin cluster, whereas the fragmentation of two-filament bundles (right) requires the severing of two “co-localized” cofilin clusters, one on each filament.
Figure 3.
Figure 3.
Cofilin cluster initiation is slowed down by fascin-induced filament bundling. (A) Time-lapse images of a two-filament bundle (yellow) showing the initiation of cofilin clusters (blue). (B) The fraction of 5-µm segments of single filaments (light blue, n = 63 segments) or 2.5-µm segments of two-filament bundles (dark blue, n = 47 segments) with at least one cofilin cluster, over time. 95% confidence intervals are shown as shaded surfaces. Black lines are single exponential fits. (C) The rate of initiation of cofilin clusters (log-scale), per cofilin binding site along actin filaments, measured from six independent experiments (n > 30 segments for each population), in the presence of 200 nM cofilin, 200 nM fascin, and 0.15 µM actin. For each condition, the black dot represents the average, and the error bars represent the SD of the distribution. Rates were obtained from exponential fits as shown in B. Dashed lines indicate paired data points from populations acquired simultaneously in the same microchamber. The paired data shows consistently a sixfold difference in the cofilin cluster initiation rate. The P value is from a paired t test. (D) Impact of fascin concentration on the initiation rate of cofilin clusters on two-filament bundles, normalized by the rate on single filaments (n = 4, 9, and 4 independent experiments at 100, 200, and 500 nM fascin respectively, with >20 segments analyzed for each experiment). Rates were derived as shown in B. All conditions with 200 nM cofilin and 0.15 µM actin. For each fascin concentration, the error bar represents the SD of the distribution. (E) Timelapse images showing the appearance of cofilin clusters (blue) on either a single actin filament or a seven-filament bundle (yellow) grown from a micrometer-size glass bead, in conditions similar to A. (F) Impact of bundle size on the initiation rate of cofilin clusters (per cofilin binding site), normalized by the rate on single filaments, when exposed to 200 nM cofilin, 200 nM fascin and 0.15 µM actin (N = 1 experiment, with 22, 10, 20, 40, and 25 segments analyzed for single filaments, and bundles of size 2, 3, 4–5, and 5–8 filaments, respectively). Horizontal error bars are SD for bundle size, and vertical error bars are the SD of the normalized cofilin initiation rates.
Figure 4.
Figure 4.
Cofilin and fascin compete to bind filaments in bundles. (A) Time-lapse images showing the growth of a cofilin cluster (blue) on a two-filament bundle (yellow). (B) Cofilin cluster growth rates on single filaments and two-filament bundles, in the presence of 200 nM cofilin, 200 nM fascin, and 0.15 µM Alexa488(10%)-G-actin (N = 4 repeats, each shown in a different color, with at least 10 cofilin clusters observed in each condition). Small data points are individual measurements (one per cluster) and the large points are the averages per repeat. Dashed lines indicate paired averages from populations acquired simultaneously in the same microchamber. The P value is from a paired t test. (C) Cofilin cluster growth rates as a function of bundle size (n = 11, 4, 6, 7, 6, and 9 cofilin clusters analyzed on single filaments and bundles of an average size of 2, 3, 4, 7, and 11 filaments, respectively). Error bars are SD. (D) Time-lapse images showing a two-filament bundle with Alexa568-fascin (green) and exposed to eGFP-cofilin1 (blue). (E) Fluorescence intensity of fascin and cofilin, integrated over the region shown in D (dashed rectangle), as a function of time. (F) Schematics of the irreversible departure of fascin, caused by a cofilin cluster growing on a two-filament bundle.
Figure 5.
Figure 5.
Interfilament cooperativity leads to bundle fragmentation. (A) Schematic representation of the two routes leading to the fragmentation of a two-filament actin bundle, after the first cofilin cluster has appeared, at a rate kinit,1.2Lfil, where Lfil is the segment length of each filament of the bundle. For route 1, the initial cofilin cluster severs at its two boundaries (see main text), at a rate ksev,1, before another cofilin cluster is initiated on the other filament of the bundle, in the region facing the first cofilin cluster. Subsequently, the initiation of a cluster on the remaining filament, followed by its severing, leads to bundle fragmentation, but these two final steps were never observed experimentally (shaded steps). For route 2, a cofilin cluster forms on the second filament in the region facing the first cofilin cluster before the latter severs, leading to the presence of two clusters in the same region. The sequential severing of the two clusters fragments the bundle. (B) An example illustrating the route 1 type of events: a single cofilin cluster (blue) severs a region of one filament in a two-filament bundle, while no other cofilin cluster has formed on the adjacent filament. The graph shows the intensity of the cofilin cluster in the dashed rectangle, as a function of time. (C) Fraction of bundles for which the first cofilin cluster severs, leaving behind no detectable cofilin, as a function of time. The fit of the experimental curve (see Materials and methods) yields ksev,1 = 3 × 10⁻³ s−1 and kinit,2 = 1 × 10⁻⁴ sub−1.s−1 (n = 71 events). The dashed line shows the best fit, using a chi-square minimization procedure (see Materials and methods). Three additional experiment repeats are shown in Fig. S10. In total, N = 4 independent experiments, with n = 101, 71, 17, 28 events, yield the following average values of ksev,1 = 1.5 × 10⁻³ s−1 and kinit,2 = 4.7 × 10⁻⁵ sub−1.s−1. (D) Average fluorescence intensity of cofilin clusters over a 1 µm wide segment on single filaments (light blue, n = 10) and on two-filament bundles (dark blue, n = 29), as a function of time, in the presence of 200 nM fascin and 200 nM cofilin, normalized by the maximum fluorescence intensity on single filaments. (E) Examples of cofilin intensity on a single filament (light blue) and a two-filament bundle (dark blue) as a function of time. The drop in intensity for the single filament is accompanied by the fragmentation of the single filament. For the two-filament bundle, a drop in the intensity to a lower value reveals the existence of two “co-localized” cofilin clusters. The second drop in intensity is accompanied by the complete fragmentation of the bundle. (F) Fraction of colocalized cluster regions that have not yet had a severing event, versus time (n = 31 events). The dashed line shows the best fit by a computed curve (see Materials and methods), using a chi-square minimization procedure. Three experimental repeats, with n = 31, 33, 39 events each, yield an average ksev,2 = 1.06 (±0.2).10−3 s−1 (± SD). (G) Fraction of cofilin clusters remaining after the first severing event and that have not yet had the second severing event, versus time (n = 53 events, pooled from four independent experiments). Fit of the experimental curve by a single exponential yields ksev,final = 2.25 (±0.6).10−3 s−1 (±95% confidence interval).
Figure 6.
Figure 6.
Constraining two-filament bundles in twist highly enhances their fragmentation. (A) Top: Schematics illustrating the numerical simulations of two 5-µm long actin filaments (yellow) interconnected by fascin (dark gray), where cofilin clusters (light blue) can form and sever filaments (dark blue). Bottom: Kymographs of two interconnected simulated filaments, showing cofilin cluster initiation (arrow) and severing (thunderbolt) events on each filament. The kymographs stop when the severing events on the two filaments result in the fragmentation of the bundle. Numerical values of reaction rates are summarized in Table S1. (B and C) Fraction of unsevered 5-µm segments that are (B) twist-unconstrained or (C) twist-constrained by being doubly attached to the glass surface, for single actin filaments (light blue, n = 53, 34 for filaments unconstrained and constrained in twist respectively) or two-filament bundles (dark blue, n = 47, 16 for bundles unconstrained and constrained in twist, respectively) upon exposure to 200 nM cofilin and 200 nM fascin, as a function of time. 95% confidence intervals are shown as shaded surfaces. Dashed lines correspond to the results obtained from numerically simulated segments (n = 200 for twist-unconstrained, 50 for twist-constrained segments), using experimentally determined rates and considering no inter-filament cooperativity in twist-constrained bundles (see main text). (D) Schematics of the interfilament cooperative twisting model. For a fascin-induced two-filament bundle, a first cofilin cluster on one of the filaments is initiated and starts growing, preventing fascin from binding locally. Local over-twisting caused by cofilin decoration is transmitted to the adjacent filament in the region devoid of fascin. This favors the binding of cofilin on the undecorated filament: the initiation rate of the second cofilin cluster is 48-fold higher than for the first cofilin cluster.
Figure S1.
Figure S1.
Cofilin binds less efficiently to larger filament bundles. Fluorescence intensity of cofilin, normalized by the amount of F-actin, bound after 8 min after cofilin introduction in the “open chamber,” on segments of typically 4 µm of fascin-induced filament bundles of average size 3 (±0.8, SD, n = 8 segments) and 10 (±4, n = 10 segments) filaments. The large dots represent the median value of each population.
Figure S2.
Figure S2.
Fascin crosslinking does not appear to slow down Pi release in actin filaments. Actin filaments elongated from spectrin–actin seeds in microfluidics chambers were bundled and aged for 15 min by exposing them to 0.15 µM actin and 200 nM fascin. Actin filaments were then unbundled and they depolymerized as single filaments upon exposure to buffer only. In the absence of fascin in solution, bundled filaments become individual isolated filaments after typically 30 s. The depolymerization rates (measured over 3 min) of individual actin filaments that were initially either isolated filaments or part of two-filament bundles when exposed to fascin, were quantified (N = 3 repeats, with n = 44, 47, and 44 for single filaments, and n = 45, 63, and 42 for two-filament bundles, respectively). Large symbols represent median values. The P value is calculated from the comparison of the paired median values.
Figure S3.
Figure S3.
Fascin decreases the rate of cofilin cluster initiation on single actin filaments. (A–C) Two side-by-side populations of single actin filaments are exposed in a microfluidics chamber to 200 nM cofilin, 0.15 µM actin, and either no or (A) 200 nM, (B) 500 nM, (C) 1 µM fascin (n = 54, 58, 60 segments with fascin, and n = 57, 53, 60 segments without fascin). Fraction of 5-µm segments of single actin filaments with at least one cofilin cluster, as a function of time. 95% confidence intervals are shown as shaded surfaces. Curves are fitted with a single exponential function to derive the cofilin cluster initiation rate for each population. (D) Cofilin cluster initiation rate fold difference between the population of single actin filaments exposed to fascin or not. Error bars for each condition are 95% confidence intervals, based on the sample sizes of the two survival fractions.
Figure S4.
Figure S4.
Cofilin clusters appear homogeneously along two-filament bundles. Cumulative distribution of the localization of n = 32 cofilin clusters along 7-µm two-filament bundles, when exposed to 200 nM mCherry-cofilin-1, 200 nM fascin, and 0.15 µM actin. The first micron of the bundle was excluded to avoid any effect due to curvature close to the anchorage point of the filaments. The straight dashed line represents the case where clusters would be perfectly homogeneously distributed.
Figure S5.
Figure S5.
The rate of initiation of cofilin clusters decreases with bundle size. (A) Size distribution of fascin-induced bundles formed from actin filaments polymerized from individual beads in the presence of 200 nM fascin. Average size = 9.7 (±4.8) filaments per bundle, n = 179 bundles. Size is determined by the actin fluorescent intensity relative to the intensity of single actin filaments (n = 10 filaments). (B) Fraction of 5-µm segment filament bundles harboring at least one cofilin cluster, over time, as a function of bundle size (single filaments n = 22, 2-fil. n = 10, 3-fil. n = 20, 4–5-fil. n = 40 and 5–8-fil. bundles n = 25). Bundle sizes were determined based on the relative fluorescence intensity of actin compared to single filaments. (C) Impact of bundle size on the rate of appearance of cofilin clusters, normalized by the rate on single filaments and by the number of filaments in bundles. Values are obtained from exponential fits of curves shown in A. Error bars are SD.
Figure S6.
Figure S6.
Impact of fascin on the growth rates of cofilin clusters. (A) Growth rates of cofilin clusters on single filaments exposed to 200 nM mCherry-cofilin1 in the presence or absence of 200 nM fascin, N = 3 experiments, n > 40 cofilin clusters for each experiment. Large symbols represent averages over individual measures from independent experiments. Paired t test P value = 0.494. (B) Growth rates of cofilin clusters on two-filament bundles exposed to 200 nM cofilin and various fascin concentrations (n = 9, 7, 5 cofilin clusters for 200, 500, and 1,000 nM fascin respectively). One-way ANOVA test P value = 0.56.
Figure S7.
Figure S7.
Cofilin fluorescence reveals the presence of overlapping cofilin clusters along two-filament bundles. Maximum fluorescence intensity of cofilin measured over 1 µm stretches on two-filament bundles compared with the intensity of cofilin clusters on single actin filaments (N = 3 experiments, with n = 23 (blue), 8 (green), 8 (orange) spots analyzed on two-filament bundles, and n = 35, 5, 18 cofilin clusters on single filaments, respectively). Large symbols represent averages over individual measures from independent experiments.
Figure S8.
Figure S8.
Curvature of cofilin-actin segments induced by the flow may accelerate severing. (A) Schematics illustrating how a microfluidics flow may accelerate severing at the barbed end side of a cofilin-decorated segment. Once a cofilin cluster has severed at its pointed end side, the flow may induce a high curvature at its barbed end side, which results in an increase of the severing at this boundary (Wioland et al., 2019b). (B) Microfluidics assay where single filaments and two-filament bundles are exposed to fascin and cofilin in the absence of actin. Severing at the pointed end side of cofilin clusters creates free barbed ends which depolymerize. Representative kymographs are shown (scale bar = 5 µm). Red arrows indicate pointed end side severing events which are accompanied with the departure of the cofilin cluster (i.e., due to accelerated severing at the barbed end side, as depicted in A), and black arrows severing events where it is not. 46% of the severing events leads to accelerated cofilin-segment departure (n = 26 events).
Figure S9.
Figure S9.
Fraction of cofilin clusters that will sever before a cofilin cluster is initiated on an adjacent filament of a two-filament bundle in the region facing the first cofilin cluster. Fraction of cofilin clusters that will sever before a cofilin cluster is initiated on an adjacent filament of a two-filament bundle in the region facing the first cofilin cluster, as a function of time, from three independent experiments (n = 101, 17, and 28 cofilin clusters, from top to bottom curves). Fits of the curves (dashed lines, see Materials and methods) yield fractions of 0.3, 0.2, and 0.15.
Figure S10.
Figure S10.
Cofilin cluster severing rate on single actin filaments. (A) Cofilin cluster severing rate on single actin filaments from three independent experiments (n = 19, 88, 45 filaments from lighter to darker blue curves). Single exponential fits (black lines) yield cofilin cluster severing rates on single filaments of 1.7, 2.15, and 2.4 × 10⁻³ s−1. (B) Cofilin cluster severing rate on single actin filaments at 100 and 200 nM cofilin (n = 31 and 53 filaments, respectively). Single exponential fits (black lines) yield cofilin cluster severing rates of 2.86 and 2.31 × 10⁻³ s−1.
Figure S11.
Figure S11.
Fraction of colocalized cofilin clusters leading to two-filament bundle fragmentation. Related to Fig. 5. At 100 nM cofilin, a fraction of colocalized cluster regions on two-filament bundles that have not yet led to the fragmentation of the bundle, versus time (n = 36 events). The dashed line shows the best fit by a computed curve (with kinit,2 = 8 × kinit,SF, see Materials and methods), using a chi-square minimization procedure, yielding a cofilin cluster severing rate ksev,2 = 2.7 × 10⁻³ s−1 (±0.8, SD), close to the one observed on single filaments (see Fig. S10).
Figure S12.
Figure S12.
Observations of colocalized cofilin clusters on bundles composed of more than two filaments. Cofilin fluorescence intensity of cofilin clusters on bundles larger than two filaments, showing several colocalized cofilin clusters, with multiple decreasing steps indicating cluster severing.
Figure S13.
Figure S13.
Negative staining EM images of fascin-induced actin filaments exposed to cofilin. Preformed 1 μM F-actin filament bundles, 10× diluted in a F-buffer solution containing 200 nM fascin, (top) with or (bottom) without 500 nM cofilin, were deposited on an EM grid and negatively stained. Bundles display clear cuts in the presence of cofilin (black arrows) with filament ends extending over 60 nm (±42 nm, SD, n = 37 breaks analyzed). Scale bars are 200 nm.
Figure S14.
Figure S14.
Numerical simulations indicating the impact of inter-filament cooperativity for the initiation of cofilin clusters on the fragmentation of two-filament bundles. Fraction of intact single filaments or two-filament bundles over time (n = 100 simulated two-filament bundles for each condition) upon exposure to cofilin. The reference initiation rate of cofilin clusters is the one on single filaments (blue curve, kinit,SF). On bundles, the initiation rate of the first cofilin cluster is either the one observed experimentally for fascin-induced two-filament bundles (orange and red curves, 1/6 kinit,SF) or similar to the one measured on single actin filaments (green curve, kinit,SF). The initiation rate of a second cofilin cluster, i.e., on a filament in the region facing a first cofilin cluster on the other filament, either results from interfilament cooperativity imposed by fascin bundling (see main text) (orange curve, 8 × kinit,SF) or not (red curve, 1/6 kinit,SF, and green curve, kinit,SF). Experimental data for single actin filaments and two-filament bundles (from Fig. 2 B) are shown for comparison.
Figure S15.
Figure S15.
Twist-constraining two-filament bundles lead to its faster fragmentation by cofilin. Survival fractions of unsevered 5-µm long segments from unanchored bundles (twist-unconstrained, n = 20) or anchored bundles (twist-constrained, n = 16) as a function of time, when exposed to 200 nM mCherry-cofilin1 and 200 nM fascin. 95% confidence intervals are shown as shaded surfaces. Log-rank test P value <0.005.
Figure S16.
Figure S16.
Initiation of cofilin clusters on twist-constrained filaments. Fraction of 5-µm segments with at least one cofilin cluster on twist-constrained (n = 16 segments, blue) or twist-unconstrained (n = 20 segments, orange) bundles. Log-rank test P value = 0.45.
Figure S17.
Figure S17.
Numerical simulations showing the impact of inter-filament cooperativity for the initiation of cofilin clusters on the fragmentation of twist-constrained two-filament bundles. Results of numerical simulations show that fragmentation of twist-constrained two-filament bundles (n = 50 simulated two-filament bundles) is faster with interfilament cooperativity for the initiation of cofilin clusters than without. Simulations with no interfilament cooperativity seem to better reflect the experimental observations (data from Fig. 6 C, n = 16 segments of two-filament bundles).

Comment in

Similar articles

Cited by

References

    1. Adams, J.C., and Schwartz M.A.. 2000. Stimulation of fascin spikes by thrombospondin-1 is mediated by the GTPases Rac and Cdc42. J. Cell Biol. 150:807–822. 10.1083/jcb.150.4.807 - DOI - PMC - PubMed
    1. Aramaki, S., Mayanagi K., Jin M., Aoyama K., and Yasunaga T.. 2016. Filopodia formation by crosslinking of F-actin with fascin in two different binding manners. Cytoskeleton. 73:365–374. 10.1002/cm.21309 - DOI - PubMed
    1. Aratyn, Y.S., Schaus T.E., Taylor E.W., and Borisy G.G.. 2007. Intrinsic dynamic behavior of fascin in filopodia. Mol. Biol. Cell. 18:3928–3940. 10.1091/mbc.e07-04-0346 - DOI - PMC - PubMed
    1. Atherton, J., Stouffer M., Francis F., and Moores C.A.. 2022. Visualising the cytoskeletal machinery in neuronal growth cones using cryo-electron tomography. J. Cell Sci. 135:jcs259234. 10.1242/jcs.259234 - DOI - PMC - PubMed
    1. Banerjee, S., Gardel M.L., and Schwarz U.S.. 2020. The actin cytoskeleton as an active adaptive material. Annu. Rev. Condens. Matter Phys. 11:421–439. 10.1146/annurev-conmatphys-031218-013231 - DOI - PMC - PubMed

Publication types