. 2024 May 6;223(5):e202302069.
doi: 10.1083/jcb.202302069. Epub 2024 Mar 18.

The phospholipids cardiolipin and phosphatidylethanolamine differentially regulate MDC biogenesis

Affiliations

The phospholipids cardiolipin and phosphatidylethanolamine differentially regulate MDC biogenesis

Tianyao Xiao et al. J Cell Biol. .

Abstract

Cells utilize multiple mechanisms to maintain mitochondrial homeostasis. We recently characterized a pathway that remodels mitochondria in response to metabolic alterations and protein overload stress. This remodeling occurs via the formation of large membranous structures from the mitochondrial outer membrane called mitochondrial-derived compartments (MDCs), which are eventually released from mitochondria and degraded. Here, we conducted a microscopy-based screen in budding yeast to identify factors that regulate MDC formation. We found that two phospholipids, cardiolipin (CL) and phosphatidylethanolamine (PE), differentially regulate MDC biogenesis. CL depletion impairs MDC biogenesis, whereas blocking mitochondrial PE production leads to constitutive MDC formation. Additionally, in response to metabolic MDC activators, cellular and mitochondrial PE declines, and overexpressing mitochondrial PE synthesis enzymes suppress MDC biogenesis. Altogether, our data indicate a requirement for CL in MDC biogenesis and suggest that PE depletion may stimulate MDC formation downstream of MDC-inducing metabolic stress.


Conflict of interest statement

Disclosures: The authors declare no competing interests exist.

Figures

Figure 1.
Figure 1.
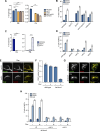
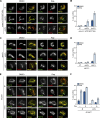
An imaging-based screen identifies genetic regulators of MDC biogenesis. (A) Widefield images of wild-type yeast cells endogenously expressing Tom70-yeGFP (Tom70-GFP) and Tim50-mCherry (Tim50-mCh) treated with DMSO or rapamycin (Rap) for 2 h. White arrows mark the positions of MDCs. Scale bar = 2 µm. (B) Schematic of the genome-wide screen to identify genetic regulators of Rap-induced MDC biogenesis. A query strain containing endogenously expressing Tom70-GFP and Tim50-mCh was mated to the yeast non-essential deletion collection to obtain a new collection in which all mutants are labeled with Tom70-GFP and Tim50-mCh after several steps of selection. The collection was treated with Rap in 96-well plates for 2 h and imaged by automated microscopy. MDCs were identified as Tom70-positive, Tim50-negative mitochondria-associated structures. Images were manually assessed and quantified to determine the percentages of cells with MDCs in each well. (C) Fan plot of the MDC screen results showing the ratio of mutants that could not screened (no growth or low image quality), grew poorly (≤5 cells per well), or formed MDCs in the indicated percentages of cells, to the total number of open reading frames (ORFs) contained in the yeast deletion collection. (D) Categories of gene deletions that led to decreased MDC biogenesis (≤20% cells form MDCs) or enhanced MDC biogenesis (≥60% cells form MDCs). For a complete list of all genes, their descriptions, and gene ontology analysis, see Table S1.
Figure 2.
Figure 2.
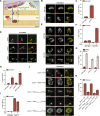
UPS1 and UPS2 regulate MDC biogenesis in opposing directions. (A) Model of intramitochondrial transport of substrates for CL and PE synthesis on the IMM mediated by IMS proteins Ups1 and Ups2. Ups1 transports PA for CL synthesis and Ups2 transports PS for PE synthesis. Ups1 and Ups2 are stabilized against degradation by binding to Mdm35. (B) Widefield images of wild-type cells or the indicated mutant yeast endogenously expressing Tom70-GFP and Tim50-mCh treated with DMSO or Rap for 2 h. White arrows mark the positions of MDCs. Scale bar = 2 µm. (C) Quantification of (B) showing the percentage of cells with MDCs. N > 100 cells per replicate, error bars = SEM of three replicates.
Figure S1.
Figure S1.
Suppressing CL production inhibits MDC formation (related to Figs. 2 and 3). (A) The relative amounts of the indicated phospholipids in whole-cell lysates of wild-type or the indicated mutant cells were determined by mass spectrometry-based lipidomic analysis. Amount of each lipid relative to total lipids was determined. Error bars = SEM of three replicates. Statistical comparison shows the difference to the corresponding wild-type control. n.s., not significant, *P < 0.0332, ***P < 0.0002, ****P < 0.0001, two-way ANOVA with Holm-Šídák test. For a complete profile of all major phospholipid species, including their amount relative to total lipids and absolute abundance detected by mass spectrometry-based lipidomic analysis, see Table S2. (B) Quantification of MDC formation in wild-type cells or the indicated mutant cells treated with DMSO, ConcA, or CHX for 2 h. N > 100 cells per replicate, error bars = SEM of three replicates. (C) The relative amounts of the indicated phospholipids in whole-cell lysates of wild-type or the indicated mutant cells determined by mass spectrometry-based lipidomic analysis. The amount of each lipid relative to total lipids was determined. Error bars = SEM of three replicates. Statistical comparison shows difference to the corresponding wild-type control. ****P < 0.0001, two-way ANOVA with Holm-Šídák test. For a complete profile of all major phospholipid species, including their amount relative to total lipids and absolute abundance detected by mass spectrometry-based lipidomic analysis, see Table S2. (D) Quantification of MDC formation in wild-type cells or the indicated mutant cells treated with DMSO, ConcA, or CHX for 2 h. N > 100 cells per replicate, error bars = SEM of three replicates. (E) Super-resolution images of crd1∆ mutants endogenously expressing MDC cargos tagged with GFP and Tom70-mCh treated with Rap for 2 h. Images show a single focal plane. Scale bar = 2 µm. (F) Quantification of DNM1 mRNA relative abundance by RT-qPCR in wild-type cells or tet-dnm1 mutant cells in the absence or presence of Dox. Error bars = SEM of three replicates. (G) Widefield images of tet-dnm1 mutants endogenously expressing Tom70-GFP and Tim50-mCh in the absence or presence of Dox. Scale bar = 2 µm. (H) Quantification of MDC formation in the indicated mutant cells treated with DMSO, ConcA, or CHX for 2 h in the absence or presence of Dox. Ø, no gene is deleted. N > 100 cells per replicate, error bars = SEM of three replicates.
Figure 3.
Figure 3.
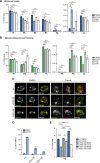
CL is required for MDC biogenesis. (A) Model of the mitochondrial CL synthesis pathway. After the translocation of PA from the OMM to IMM by the Ups1-Mdm35 complex, CL is produced via several reaction steps. Gep4 catalyzes the synthesis of PG, an intermediate substrate for CL synthesis, and the CL synthase Crd1 converts PG to premature CL (pCL). Cld1 removes one acyl-chain from pCL to generate monolyso-CL (MLCL), followed by the readdition of an acyl-chain to form mature CL (mCL) by Taz1. (B) Widefield images of wild-type cells or the indicated mutant yeast endogenously expressing Tom70-GFP and Tim50-mCh treated with DMSO or Rap for 2 h. White arrows mark the positions of MDCs. Scale bar = 2 µm. (C) Quantification of (B) showing the percentage of cells with MDCs. N > 100 cells per replicate, error bars = SEM of three replicates. (D) Super-resolution images of crd1∆ mutants endogenously expressing MDC cargos tagged with GFP and Tim50-mCh treated with Rap for 2 h. Images show a single focal plane. Scale bar = 2 µm. (E) Quantification of wild-type cells or crd1∆ mutants showing the percentage of cells with larger MDCs, smaller vesicle-like structures that resemble MDCs, or no MDCs by super-resolution microscopy. Microscopy images on the left show examples of these three types. Scale bar = 2 µm. N = 50 cells per replicate, error bars = SEM of three replicates. (F) Quantification of the percentage of cells with MDCs in the indicated mutant yeast treated with DMSO or Rap for 2 h in the absence or presence of Doxycycline (Dox). Ø, no gene is deleted. N > 100 cells per replicate, error bars = SEM of three replicates.
Figure 4.
Figure 4.
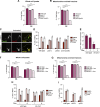
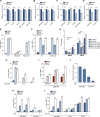
PE depletion constitutively activates MDC biogenesis. (A) Model of PE synthesis pathways. PS, the substrate for PE synthesis, is synthesized from PA on the ER membrane. The last step of PS synthesis is catalyzed by ER-localized Cho1. After transfer from the OMM to the IMM by the Ups2-Mdm35 complex, PS is converted to PE by an IMM-localized decarboxylase Psd1. PE produced in mitochondria is further transferred to the ER for PC synthesis, which is mediated by Cho2 and Opi3 in the ER. Psd1 can also dually localize to the ER membrane. Two alternative PE synthesis pathways include (1) PE production mediated by Psd2 which is localized on the endosomal membrane and (2) PE generation from exogenous ethanolamine (Etn) via the Kennedy pathway. (B) Widefield images of wild-type cells or psd1∆ mutants endogenously expressing Tom70-GFP and Tim50-mCh. White arrows mark the positions of MDCs. Scale bar = 2 µm. (C) Quantification of (B) showing the percentage of cells with MDCs. N > 100 cells per replicate, error bars = SEM of three replicates. (D) Super-resolution images of psd1∆ mutants endogenously expressing MDC cargos tagged with GFP and Tim50-mCh. White arrows mark the positions of MDCs. Images show single focal plane. Scale bar = 2 µm. (E) Widefield images of wild-type cells or tet-cho1 mutants endogenously expressing Tom70-GFP and Tim50-mCh in the absence or presence of Dox. White arrows mark the positions of MDCs. Scale bar = 2 µm. (F) Quantification of D showing the percentage of cells with MDCs. N > 100 cells per replicate, error bars = SEM of three replicates. (G) Quantification of MDC formation in wild-type cells and the indicated mutant yeast treated with DMSO or Rap for 2 h. N > 100 cells per replicate, error bars = SEM of three replicates. (H) Quantification of MDC formation in wild-type cells and the indicated mutant yeast. N > 100 cells per replicate, error bars = SEM of three replicates. (I) Quantification of MDC formation in wild-type cells or psd1∆ mutants in the presence or absence of 5 mM Etn. N > 100 cells per replicate, error bars = SEM of three replicates. (J) Widefield images of psd1∆ mutants containing an empty vector (EV) or the indicated Psd1-FLAG constructs endogenously expressing Tom70-GFP and Tim50-mCh. White arrows mark the positions of MDCs. Scale bar = 2 µm. (K) Quantification of (J) showing the percentage of cells with MDCs. N > 100 cells per replicate, error bars = SEM of three replicates.
Figure S2.
Figure S2.
Defective mitochondrial PE synthesis activates MDC biogenesis (related to Fig. 4). (A and B) The relative amounts of PE in whole-cell lysates (A) or mitochondria-enriched membrane fractions (B) isolated from wild-type or the indicated mutant cells were determined by mass spectrometry-based lipidomic analysis. Amounts of each lipid relative to total lipids were determined. Error bars = SEM of three replicates. Statistical comparison shows difference to the corresponding wild-type control. n.s., not significant, *P < 0.0332, **P < 0.0021, ****P < 0.0001, two-way ANOVA with Holm-Šídák test. For a complete profile of all major phospholipid species, including their amount relative to total lipids and absolute abundance detected by mass spectrometry-based lipidomic analysis, see Table S2. (C) Super-resolution images of crd1∆ mutants endogenously expressing MDC cargos tagged with GFP and Tom70-mCh treated with Rap for 2 h. White arrows mark positions of MDCs. Images show single focal plane. Scale bar = 2 µm. (D) Quantification of MDC formation in wild-type cells or the indicated mutant cells treated with DMSO, Rap, ConcA, or CHX for 2 h. N > 100 cells per replicate, error bars = SEM of three replicates. (E) Quantification of CHO1 mRNA abundance by RT-qPCR in wild-type cells or tet-cho1 mutants in the absence or presence of Dox. Error bars = SEM of three replicates. (F and G) The relative amounts of the indicated phospholipids in whole-cell lysates (F) or mitochondria-enriched membrane fractions (G) isolated from wild-type or tet-cho1 mutants in the absence or presence of Dox determined by mass spectrometry-based lipidomic analysis. Amounts of each lipid relative to total lipids were determined. Error bars = SEM of four replicates. Statistical comparison shows difference to the corresponding wild-type control. n.s., not significant, ****P < 0.0001, two-way ANOVA with Holm-Šídák test. For a complete profile of all major phospholipid species, including their amount relative to total lipids and absolute abundance detected by mass spectrometry-based lipidomic analysis, see Table S2. (H) Quantification of MDC formation in wild-type cells or tet-cho1 cells treated with DMSO, Rap, ConcA, or CHX for 2 h in the absence or presence of Dox. N > 100 cells per replicate, error bars = SEM of three replicates. (I) Quantification of MDC formation in wild-type cells or the indicated mutant cells treated with DMSO, ConcA, or CHX for 2 h. N > 100 cells per replicate, error bars = SEM of three replicates.
Figure S3.
Figure S3.
PE synthesized in the IMM is required for MDC biogenesis (related to Figs. 4 and 5). (A) Fivefold serial dilutions of wild-type cells or the indicated mutant cells on YPAD, SD, or SD+ 5 mM Etn agar plates. (B) Schematic of the indicated Psd1-FLAG constructs containing TMD of Psd1 (orange), Sec66 (light blue), Tom70 (turquoise), or Mic60 (purple) used in Fig. 4, J and K. (C) Widefield images of indirect immunofluorescence staining against the FLAG epitope and endogenous Tom70 in psd1∆ mutants expressing an empty vector (EV) or the indicated Psd1-FLAG constructs. Nucleus is stained with NucBlue. White arrow marks perinuclear ER. Images show a single focal plane. Scale bar = 2 μm. (D) Fivefold serial dilutions of psd1∆ mutants expressing an empty vector (EV) or the indicated Psd1-FLAG constructs on SD agar plates. (E) Quantification showing the percentage of cells with tubular, aggregated, or fragmented mitochondrial morphology in psd1∆ mutants expressing an empty vector (EV) or the indicated Psd1-FLAG constructs. Microscopy images on the left show examples of these three mitochondrial morphologies. Scale bar = 2 μm. N > 100 cells per replicate, error bars = SEM of three replicates. (F) Quantification of MDC formation in psd1∆ mutants containing an empty vector (EV) or the indicated Psd1-FLAG constructs treated with Rap, ConcA, or CHX for 2 h. N > 100 cells per replicate, error bars = SEM of three replicates. (G) Quantification of MDC formation in mmm1∆ VPS13(D716H) cells or mmm1∆ VPS13(D716H) cells with the indicated gene deletions treated with DMSO, ConcA, or CHX for 2 h. Ø, no gene is deleted. N > 100 cells per replicate, error bars = SEM of three replicates. (H) Quantification of MDC formation in gem1∆ mutant cells or gem1∆ cells with the indicated gene deletions treated with DMSO, ConcA, or CHX for 2 h. Ø, no gene is deleted. N > 100 cells per replicate, error bars = SEM of three replicates. (I) Tetrads of psd1∆/+ crd1∆/+ diploid cells dissected on YPAD or YPAD + 5 mM Etn. (J) Quantification of PSD1 mRNA abundance by RT-qPCR in wild-type cells or tet-psd1 mutants in the absence or presence of Dox. Error bars = SEM of three replicates.
Figure 5.
Figure 5.
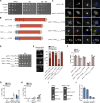
PSD1 depletion partially restores MDC biogenesis in ERMES/Gem1 mutants but is hypostatic of CRD1 deletion. (A) Widefield images of mmm1∆ VPS13(D716H) cells or mmm1∆ VPS13(D716H) cells with the indicated gene deletions endogenously expressing Tom70-GFP and Tim50-mCh treated with DMSO or Rap for 2 h. Ø, no gene is deleted. White arrows mark the positions of MDCs. Scale bar = 2 µm. (B) Quantification of A showing the percentage of cells with MDCs. N > 100 cells per replicate, error bars = SEM of three replicates. (C) Widefield images of gem1∆ cells or gem1∆ cells with the indicated gene deletions endogenously expressing Tom70-GFP and Tim50-mCh treated with DMSO or Rap for 2 h. Ø, no gene is deleted. White arrows mark the positions of MDCs. Scale bar = 2 µm. (D) Quantification of C showing the percentage of cells with MDCs. N > 100 cells per replicate, error bars = SEM of three replicates. (E) Widefield images of tet-psd1 mutants with or without CRD1 deletion endogenously expressing Tom70-GFP and Tim50-mCh treated with DMSO or Rap for 2 h in the absence or presence of Dox. Ø, no gene is deleted. White arrows mark the positions of MDCs. Scale bar = 2 µm. (F) Quantification of (E) showing the percentage of cells with MDCs. Ø, no gene is deleted. N > 100 cells per replicate, error bars = SEM of three replicates.
Figure 6.
Figure 6.
Cellular and mitochondrial PE decline in response to MDC-inducing agents. (A and B) The relative amounts of the indicated phospholipids in whole-cell lysates (A) or mitochondria-enriched membrane fractions (B) isolated from yeast cells treated with DMSO, ConcA, Rap, or CHX for 2 h detected by mass spectrometry-based lipidomic analysis. Amounts of each lipid relative to total lipids were determined. Error bars = SEM of three replicates. Statistical comparison shows difference to the corresponding DMSO control. n.s., not significant, *P < 0.0332, **P < 0.0021, ****P < 0.0001, two-way ANOVA with Holm-Šídák test. For the absolute abundance of each phospholipid species detected by mass spectrometry-based lipidomic analysis, see Table S2. (C) Widefield images of yeast cells with genomic integration of an empty vector (EV), UPS2 overexpressing vector (UPS2 OE), or PSD1 overexpressing vector (PSD1 OE) endogenously expressing Tom70-GFP and Tim50-mCh treated with DMSO or ConcA for 2 h. White arrows mark the positions of MDCs. Scale bar = 2 µm. (D) Quantification of C showing the percentage of cells with the indicated integrated vectors with MDCs. N > 100 cells per replicate, error bars = SEM of three replicates. (E) The relative amounts of PE in whole-cell lysates from yeast cells with genomic integration of an empty vector (EV), UPS2 overexpressing vector (UPS2 OE), or PSD1 overexpressing vector (PSD1 OE) treated with DMSO or ConcA for 2 h detected by mass spectrometry-based lipidomic analysis. Amounts of PE relative to total lipids were determined. Error bars = SEM of four replicates. The statistical comparison shows a difference to the corresponding DMSO control. n.s., not significant, *P < 0.0332, **P < 0.0021, ****P < 0.0001, two-way ANOVA with Holm-Šídák test. For a complete profile of all major phospholipid species, including their amount relative to total lipids and absolute abundance detected by mass spectrometry-based lipidomic analysis, see Table S2.
Figure S4.
Figure S4.
MDC-inducing conditions trigger PE depletion (related to Figs. 6, 7, and 8). (A–D) The relative amounts of PE in whole-cell lysate of wild-type cells or the indicated mutant yeast cells treated with DMSO or Rap for 2 h. The average amounts of PE in DMSO-treated cells were set to 100%. Error bars = SEM of three replicates. Statistical comparison shows a difference to the corresponding DMSO control. n.s., not significant, *P < 0.0332, **P < 0.0021, ***P < 0.0002, ****P < 0.0001, two-way ANOVA with Holm-Šídák test. (E) Quantification of MDC formation in cells with genomic integration of an empty vector (EV), UPS2 overexpressing vector (UPS2 OE), or PSD1 overexpressing vector (PSD1 OE) treated with DMSO, Rap, or CHX for 2 h. N > 100 cells per replicate, error bars = SEM of three replicates. (F) Quantification of MDC formation in cells with genomic integration of an empty vector (EV) or CRD1 overexpressing vector (CRD1 OE) treated with DMSO, Rap, ConcA, or CHX for 2 h. N > 100 cells per replicate, error bars = SEM of three replicates. (G) The relative amounts of MMPE and DMPE in whole-cell lysate of yeast cells with genomic integration of an empty vector (EV), UPS2 overexpressing vector (UPS2 OE), or PSD1 overexpressing vector (PSD1 OE) treated with DMSO or ConcA for 2 h. Amounts of each lipid relative to total lipids were determined. Error bars = SEM of three replicates. Statistical comparison shows difference to the corresponding DMSO control. n.s., not significant, *P < 0.0332, **P < 0.0021, ***P < 0.0002, ****P < 0.0001, two-way ANOVA with Holm-Šídák test. (H) Quantification of MDC formation in yeast cells grown in amino acid-rich media, synthetic media that contains low levels of amino acid, or minimal media that excludes amino acids (indicated as High, Low, and −, respectively) treated with DMSO, Rap, or CHX for 2 h. N > 100 cells per replicate, error bars = SEM of three replicates. (I) Quantification of MDC formation in wild-type cells or the indicated mutant cells grown in synthetic media that contains low levels of amino acid (Low AA) treated with DMSO, Rap, or CHX for 2 h. N > 100 cells per replicate, error bars = SEM of three replicates. (J) Quantification of MIM1 mRNA abundance by RT-qPCR in wild-type cells or tet-mim1 mutants in the absence or presence of Dox. Error bars = SEM of three replicates. (K) Quantification of MDC formation in wild-type cells or tet-mim1 mutants treated with DMSO, ConcA, or CHX for 2 h in the absence or presence of Dox. N > 100 cells per replicate, error bars = SEM of three replicates. (L) Quantification of MDC formation in wild-type cells or the indicated mutant yeast with genomic integration of an empty vector (EV) or MIM1 overexpressing vector (MIM1 OE) treated with DMSO, ConcA, or CHX for 2 h. N > 100 cells per replicate, error bars = SEM of three replicates.
Figure 7.
Figure 7.
Cellular and mitochondrial PE abundance correlates with amino acid levels. (A) Quantification of MDC formation in yeast cells grown in amino acid-rich media, synthetic media that contains low levels of amino acid, and minimal media that exclude amino acids (indicated as High, Low, and −, respectively) treated with DMSO or ConcA for 2 h. N > 100 cells per replicate, error bars = SEM of three replicates. (B–E) The relative amounts (B and D) or absolute abundance (C and E) of PE in whole-cell lysates (B and C) or mitochondria-enriched membrane fractions (D and E) isolated from yeast cells grown in amino acid-rich media, synthetic media that contains low levels of amino acid, and minimal media that exclude amino acids (indicated as High, Low, and −, respectively) treated with DMSO or ConcA for 2 h detected by mass spectrometry-based lipidomic analysis. For relative amounts of PE, PE abundance relative to total lipids were determined. The absolute amounts are normalized to spiked internal standards used by mass spectrometry-based lipidomic analysis, indicating pmol lipid per mg sample for whole-cell lysates, or pmol lipid per mg protein for mitochondria-enriched membrane fractions. Error bars = SEM of four replicates. The statistical comparison shows a difference to the corresponding DMSO control. n.s., not significant, *P < 0.0332, **P < 0.0021, ***P < 0.0002, ****P < 0.0001, two-way ANOVA with Holm-Šídák test. For a complete profile of all major phospholipid species, including their amount relative to total lipids and absolute abundance detected by mass spectrometry-based lipidomic analysis, see Table S2. (F) Widefield images of wild-type cells or the indicated mutant yeast endogenously expressing Tom70-GFP and Tim50-mCh grown in media containing low levels of amino acids. White arrows mark the positions of MDCs. Scale bar = 2 µm. (G) Quantification of MDC formation in wild-type cells or the indicated mutant cells treated with DMSO or ConcA. N > 100 cells per replicate, error bars = SEM of three replicates.
Figure 8.
Figure 8.
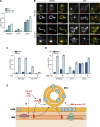
CRD1 and PSD1 may impact MDC formation through effects on the OMM. (A) Quantification of MDC formation in wild-type cells or the indicated mutant yeast with genomic integration of an empty vector (EV), AAC1 overexpressing vector (AAC1 OE), or OAC1 overexpressing vector (OAC1 OE). N > 100 cells per replicate, error bars = SEM of three replicates. (B) Widefield images of wild-type cells or tet-mim1 mutants endogenously expressing Tom70-GFP and Tim50-mCh treated with DMSO or Rap for 2 h in the absence or presence of Dox. White arrows mark the positions of MDCs. Cyan arrows mark mislocalized Tom70. Scale bar = 2 µm. (C) Quantification of B showing the percentage of cells with MDCs. N > 100 cells per replicate, error bars = SEM of three replicates. (D) Quantification of MDC formation in wild-type cells or the indicated mutant yeast with genomic integration of an empty vector (EV) or MIM1 overexpressing vector (MIM1 OE) treated with DMSO or Rap for 2 h. N > 100 cells per replicate, error bars = SEM of three replicates. (E) Model of MDC formation regulated by CL and PE in response to MDC-inducing stress.

References

    1. Aaltonen, M.J., Friedman J.R., Osman C., Salin B., di Rago J.-P., Nunnari J., Langer T., and Tatsuta T.. 2016. MICOS and phospholipid transfer by Ups2-Mdm35 organize membrane lipid synthesis in mitochondria. J. Cell Biol. 213:525–534. 10.1083/jcb.201602007 - DOI - PMC - PubMed
    1. Acoba, M.G., Senoo N., and Claypool S.M.. 2020. Phospholipid ebb and flow makes mitochondria go. J. Cell Biol. 219:e202003131. 10.1083/jcb.202003131 - DOI - PMC - PubMed
    1. AhYoung, A.P., Jiang J., Zhang J., Khoi Dang X., Loo J.A., Zhou Z.H., and Egea P.F.. 2015. Conserved SMP domains of the ERMES complex bind phospholipids and mediate tether assembly. Proc. Natl. Acad. Sci. 112:E3179–E3188. 10.1073/pnas.1422363112 - DOI - PMC - PubMed
    1. Aliu, E., Kanungo S., and Arnold G.L.. 2018. Amino acid disorders. Ann. Transl. Med. 6:471. 10.21037/atm.2018.12.12 - DOI - PMC - PubMed
    1. Andersen, M.P., Nelson Z.W., Hetrick E.D., and Gottschling D.E.. 2008. A genetic screen for increased loss of heterozygosity in Saccharomyces cerevisiae. Genetics. 179:1179–1195. 10.1534/genetics.108.089250 - DOI - PMC - PubMed

Publication types

MeSH terms