Estimated Childhood Lead Exposure From Drinking Water in Chicago
- PMID: 38497944
- PMCID: PMC10949143
- DOI: 10.1001/jamapediatrics.2024.0133
Estimated Childhood Lead Exposure From Drinking Water in Chicago
Abstract
Importance: There is no level of lead in drinking water considered to be safe, yet lead service lines are still commonly used in water systems across the US.
Objective: To identify the extent of lead-contaminated drinking water in Chicago, Illinois, and model its impact on children younger than 6 years.
Design, setting, and participants: For this cross-sectional study, a retrospective assessment was performed of lead exposure based on household tests collected from January 2016 to September 2023. Tests were obtained from households in Chicago that registered for a free self-administered testing service for lead exposure. Machine learning and microsimulation were used to estimate citywide childhood lead exposure.
Exposure: Lead-contaminated drinking water, measured in parts per billion.
Main outcomes and measures: Number of children younger than 6 years exposed to lead-contaminated water.
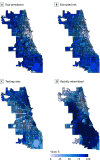
Results: A total of 38 385 household lead tests were collected. An estimated 68% (95% uncertainty interval, 66%-69%) of children younger than 6 years were exposed to lead-contaminated water, corresponding to 129 000 children (95% uncertainty interval, 128 000-131 000 children). Ten-percentage-point increases in block-level Black and Hispanic populations were associated with 3% (95% CI, 2%-3%) and 6% (95% CI, 5%-7%) decreases in odds of being tested for lead and 4% (95% CI, 3%-6%) and 11% (95% CI, 10%-13%) increases in having lead-contaminated drinking water, respectively.
Conclusions and relevance: These findings indicate that childhood lead exposure is widespread in Chicago, and racial inequities are present in both testing rates and exposure levels. Machine learning may assist in preliminary screening for lead exposure, and efforts to remediate the effects of environmental racism should involve improving outreach for and access to lead testing services.
Conflict of interest statement
Figures

References
-
- United States Environmental Protection Agency . Lead and copper rule. October 13, 2015. Accessed December 26, 2023. https://www.epa.gov/dwreginfo/lead-and-copper-rule
-
- Reuben A, Caspi A, Belsky DW, et al. . Association of childhood blood lead levels with cognitive function and socioeconomic status at age 38 years and with IQ change and socioeconomic mobility between childhood and adulthood. JAMA. 2017;317(12):1244-1251. doi:10.1001/jama.2017.1712 - DOI - PMC - PubMed
Publication types
MeSH terms
Substances
LinkOut - more resources
Full Text Sources
Medical

