. 2024 Aug;27(3):351-373.
doi: 10.1007/s10456-024-09909-9. Epub 2024 Mar 18.

Granzyme B degrades extracellular matrix and promotes inflammation and choroidal neovascularization

Affiliations

Granzyme B degrades extracellular matrix and promotes inflammation and choroidal neovascularization

Gideon Obasanmi et al. Angiogenesis. 2024 Aug.

Erratum in

Abstract

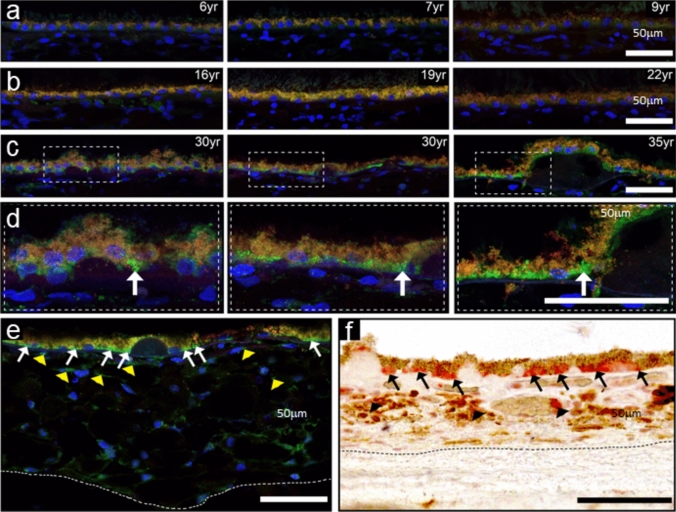
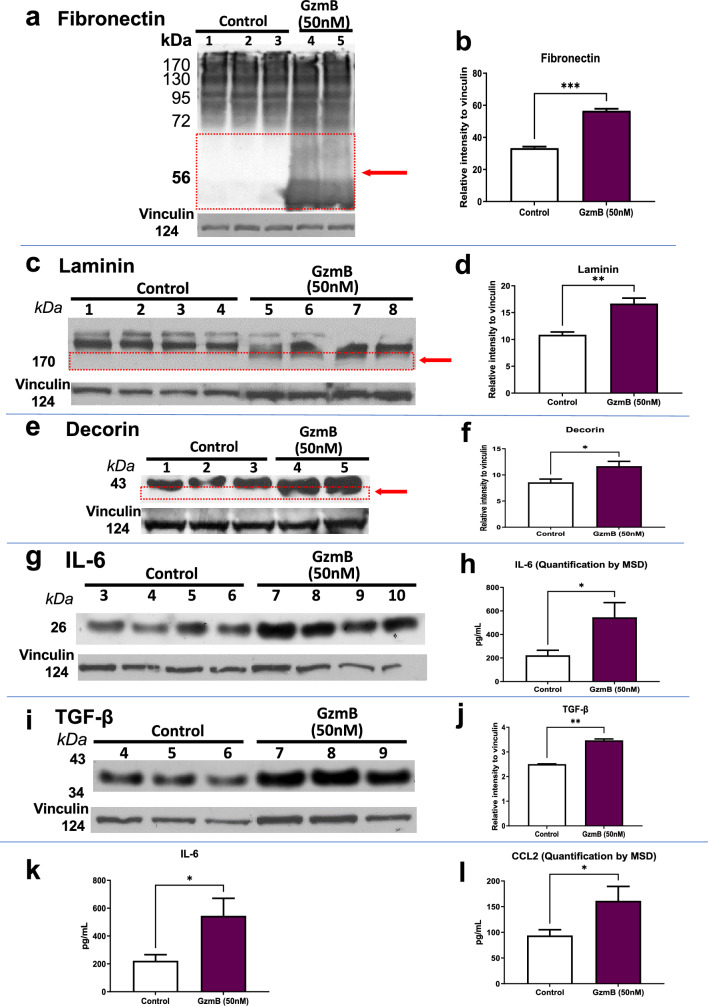
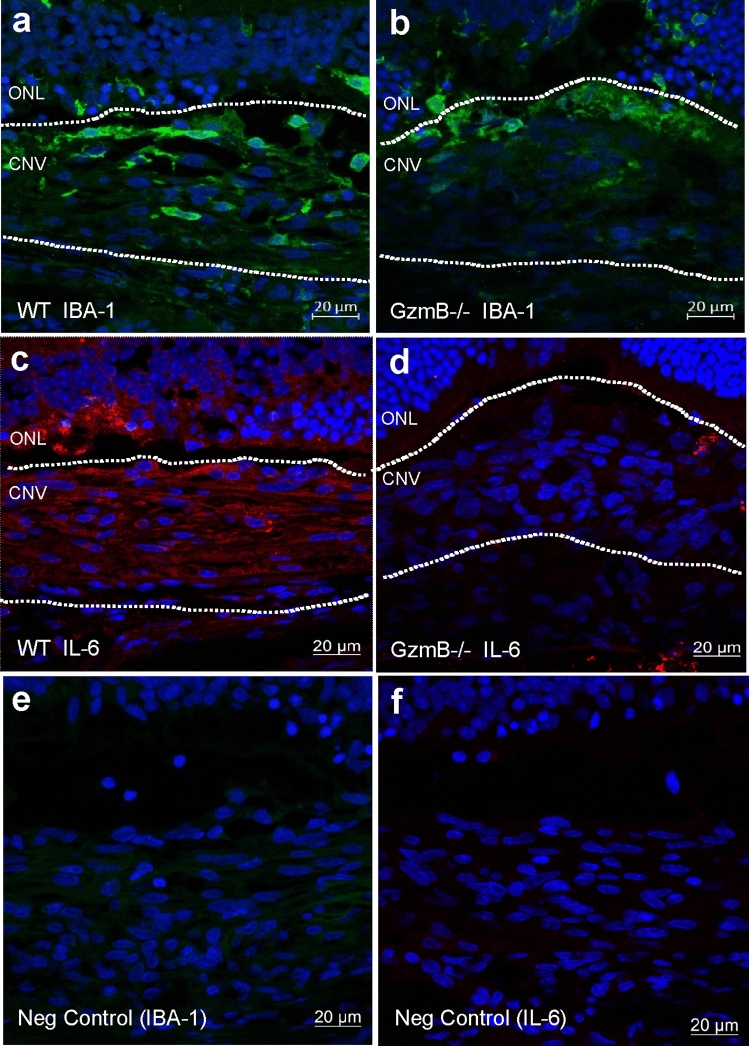
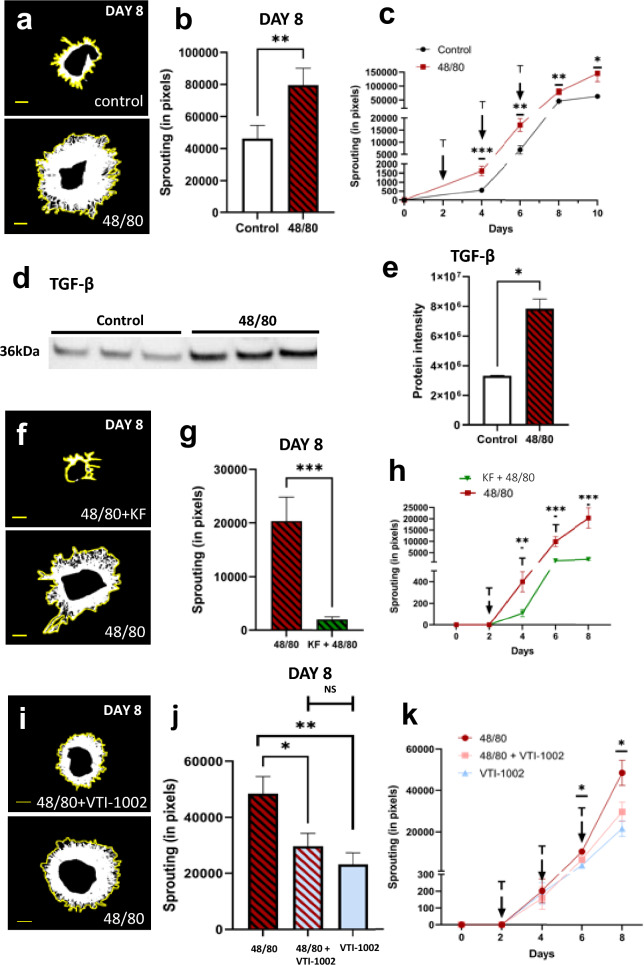
Age-related macular degeneration (AMD) is a common retinal neurodegenerative disease among the elderly. Neovascular AMD (nAMD), a leading cause of AMD-related blindness, involves choroidal neovascularization (CNV), which can be suppressed by anti-angiogenic treatments. However, current CNV treatments do not work in all nAMD patients. Here we investigate a novel target for AMD. Granzyme B (GzmB) is a serine protease that promotes aging, chronic inflammation and vascular permeability through the degradation of the extracellular matrix (ECM) and tight junctions. Extracellular GzmB is increased in retina pigment epithelium (RPE) and mast cells in the choroid of the healthy aging outer retina. It is further increased in donor eyes exhibiting features of nAMD and CNV. Here, we show in RPE-choroidal explant cultures that exogenous GzmB degrades the RPE-choroid ECM, promotes retinal/choroidal inflammation and angiogenesis while diminishing anti-angiogenic factor, thrombospondin-1 (TSP-1). The pharmacological inhibition of either GzmB or mast-cell degranulation significantly reduces choroidal angiogenesis. In line with our in vitro data, GzmB-deficiency reduces the extent of laser-induced CNV lesions and the age-related deterioration of electroretinogram (ERG) responses in mice. These findings suggest that targeting GzmB, a serine protease with no known endogenous inhibitors, may be a potential novel therapeutic approach to suppress CNV in nAMD.

Keywords: Age-related macular degeneration; Angiogenesis; Choroidal neovascularization; Extracellular matrix; Granzyme B; Inflammation; Mast cell.


Conflict of interest statement

D.J.G. is co-founder and chief scientific officer of viDA Therapeutics. We received VTI-1002 as a generous gift. The remaining authors declare no competing interests.

Figures

Fig. 1
Fig. 1
Comparison of GzmB immunoreactivity in primate and human outer retina. AC Cross sections of RPE and choroid from young (A), middle aged (B) and older (C) rhesus monkey demonstrate age-related increase in GzmB immunofluorescence (green) in the basal compartment of the RPE in 30–35 year old rhesus surrounding drusen sites. Enlargement of dashed boxes shown in (D). D–E GzmB immunoreactivity in 35 year old rhesus with GzmB immunofluorescence evident in RPE (white arrows) and in choroid (yellow arrowheads). F A 70-year old human donor eye demonstrates GzmB immunolabeling in basal compartment of RPE (AEC red chromogenic label, black arrows) surrounding soft drusen indicating similarity between rhesus and human eye tissues. The choroidal mast cells (black arrowheads) are also immunoreactive for GzmB. Dotted line demarcates choroidal/scleral interface
Fig. 2
Fig. 2
GzmB promotes vascular sprouting and VEGF-A expression while reducing TSP-1 in the RPE-choroid. A Representative images show the effects of exogenous GzmB treatment compared with controls at Day 8 of explant culture. Yellow lines around sprouting area show maximum extent of sprouting. B Quantification of vascular sprouting at Day 8 of CSA. Choroid sprouting is significantly increased with GzmB treatment compared with control (PBS) treatment. CE Western blot and MesoScale Discovery (MSD) multiplex assays reveal GzmB-induced increased expression of VEGF-A in CSA supernatant. C Representative western blot of VEGF-A and its total protein control blot for total protein normalization (iBright Imaging Systems) D Densitometric quantification of VEGF-A in western blot. E Quantification of VEGF-A in MSD multiplex assays. FG Western blot assays reveal GzmB-induced proteolysis of TSP-1 in CSA supernatant. The total protein control blot is shown in Supplementary Fig. 1. F Representative western blot of TSP-1. G Densitometric quantification of TSP-1 western blot. Results are presented as mean ± SEM. *p < 0.05 in T-test. n of A–D, F and G = 6 per group, n of E = 4–6 per group
Fig. 3
Fig. 3
GzmB degrades the extracellular matrix and promotes inflammation in the RPE-Choroid. A, C, E Western blot reveals cleavage of extracellular matrix proteins by exogenous GzmB. Representative western blot of ECM proteins in CSA supernatant for A fibronectin; C laminin and E: decorin. Note cleavage bands at lower molecular weight, identified by the red box and arrow in A (fibronectin) and C (laminin). Vinculin bands are shown as loading controls. B, D, F Densitometric quantification of degradation by western blot—the additional cleavage bands at lower molecular weight were quantified. B Fibronectin; D laminin and F decorin. Results are presented as mean ± SEM. *p < 0.05, ***p < 0.001 in T-test. n = 4 per group. G, I Next, we tested pro-inflammatory cytokines by western blot in CSA supernatant after exogenous GzmB. Representative western blot of inflammatory cytokines in CSA supernatant: G IL-6; I TGF-β. H, J Densitometric quantification of western blots. H IL-6; J TGF-β. K, L Two additional pro-inflammatory cytokines were quantified by MSD multiplex assay: K IL-6; L CCL2. Results are presented as mean ± SEM. *p < 0.05, **p < 0.01, ***p < 0.001 in T-test. n = 4–6 per group
Fig. 4
Fig. 4
GzmB deficiency reduces angiogenic growth factor, VEGF, and macrophages in outer retina. A–C Vascular endothelial growth factor (VEGF) immunofluorescence is robust in outer retina of WT but dramatically reduced in the GzmB−/−. A, B VEGF immunofluorescence (IF) reveals strongly labeled RPE (arrows) and endothelial cells in walls of vessels (arrowheads) in WT compared to GzmB−/−. C Negative control demonstrates the specificity of the IF in which the primary VEGF antibody was omitted and replaced with a non-immune antibody of the same isotype, while keeping all other steps identical during processing. D Average percentage of pixels positive for VEGF immunofluorescence is significantly greater in WT compared to GzmB−/− (n = 4, * p < 0.05, Mann–Whitney U Test). E, F Perivascular macrophage markers F4/80 immuno-fluorescence (green, arrow) is significantly more robust in outer retina of WT vs. GzmB−/−. G Negative control demonstrates the specificity of the IF in which the primary F4/80 antibody was omitted and replaced with a non-immune antibody of the same isotype, while keeping all other steps identical during processing H, I NSE IF (red, arrows), labels macrophages and is significantly more robust in outer retina of WT vs GzmB−/−. J Negative control demonstrates the specificity of the IF in which the NSE reagent was omitted and replaced while keeping all other steps identical during processing. KL Number of labeled profiles is significantly greater in WT compared to GzmB−/− (n = 4, * = p < 0.05, Mann–Whitney U Test). All tissue samples are from 9-month-old WT or GzmB−/− mice
Fig. 5
Fig. 5
GzmB deficiency improves ERG and minimizes laser-induced CNV. ERG a- and b-wave amplitude significantly decrease with aging in the WT, while the age-related alterations in ERGs in GzmB−/− mice are not significant. A Representative images of scotopic ff-ERG wave form in young (2 to 5-month-old) and old (11 to 15-month-old) C57BL/6 J WT and GzmB−/− mouse respectively. B Significant a-wave amplitude was observed in WT young vs. old in flash value 0.6, 1.4 and 2.1 log(cds/m2), while changes in GzmB−/− young vs. old mice were not significant. C Significant b-wave amplitude was observed in WT young vs. old in flash value 0, 0.6, 1.4 and 2.1 log (cds/m2), while only slight differences were detected in GzmB−/− young vs. old mice at flash value of 1.4 log(cds/m2). *p < 0.05, **p < 0.01, ***p < 0.001, mean ± SEM. N = 4–5 per strain and age groups. D In vivo retinal OCT imaging at Day 7 post laser induction demonstrates reduced CNV lesions in the GzmB−/− compared to WT. Multi-contrast en-face projection images of the CNV lesions in a WT retina demonstrated large structural lesions (yellow arrowheads) with large vascular loops (yellow arrows) and elevated melanin-containing regions (black arrows). Laser-induced CNV lesions in the GzmB−/− retina were smaller structural lesions (yellow arrowheads) that are clearly delineated by melanin contrast displaying focal elevated melanin-containing regions (black arrow), with a confined vascular extent (yellow arrows), which are indicative of a lower angiogenic response associated with the laser induction. Circularly projected multi-contrast cross-sectional images of WT and GzmB−/− retina were extracted from the white dotted lines marked at structural en-face projection images
Fig. 6
Fig. 6
GzmB deficiency suppresses VEGF and neovascularization after laser induction. AE Hematoxylin-stained cross-sections through the center of CNV lesion in WT (A, C) and GzmB−/− mouse (B, D). CNV lesions in WT mouse extend into the ONL and INL, while lesions in the GzmB−/− mouse extend in the ONL, but is less disruptive of the neuroretinal layers. Quantification of the CNV was undertaken by measuring the thickness within the center of the CNV lesion (m) and compared to the thickness of the adjacent, intact, unaffected choroidal and RPE layer (n). The ratio of m/n demonstrates that the CNV lesions in the WT were significantly more robust than those in the GzmB−/− mice (E). FH: Confocal images of VEGF-A IF (green) adjacent to the CNV lesion reveals stronger IF in choroid of WT (F) compared to GzmB−/− (G) (arrow). H Average fluorescence rating of VEGF IF is higher in WT compared to GzmB-KO. p < 0.05 N = 5; Mann–Whitney U, one tailed). I-K: CD31 IF reveals strongly labeled endothelial cells in walls of vessels (arrows) after CNV induction in WT (I), lower IF in GzmB−/− mice (J) after CNV induction. K Average number of vessels/cross section positive for CD31 in significantly greater in WT vs GzmB−/−. p < 0.05. n = 5 Mann–Whitney U, one tailed. LM Fluorescent image of IB-4 (for proliferating endothelial cells) in choroid flatmounts after laser-induced CNV in WT. Note large extent of CNV membrane as indicated by green fluorescence when compared to images in GzmB−/− after CNV induction (OP). Q: Areal measurements reveal a significant reduction of CNV membrane growth in GzmB−/− mice; p < 0.01 n = 3 GzmB−/− and n = 5 WT
Fig. 7
Fig. 7
GzmB deficiency suppresses inflammation after laser induction. A-D: Cross-sections through CNV lesions (white outlines) in WT (A, C) and GzmB−/− (B, D). Cross sections were immunoreacted for IBA-1 with a 488 nm labeled secondary antibody (green; A, B) or IL-6 with a 546 nm labeled secondary antibody (red; C, D). Note that in the WT, the immunofluorescence associated with IBA-1 (a microglia marker) and IL-6 (pro-inflammatory cytokine associated with CNV) is greater than seen in the GzmB−/−. Negative control (E, F) images reveal a lack of non-specific immunofluorescence. ONL outer nuclear layer, CNV choroidal neovascular lesion
Fig. 8
Fig. 8
Mast cells stain positive for Toluidine blue, NSE, GzmB, and C-kit in mouse choroid/sclera and positive for GzmB in human. A Representative image showing the presence of toluidine blue positive mast cells (in pink) in an albino mouse choroidal wholemount at 100X magnification. B Representative image revealing mast cells in the process of degranulation in an albino mouse choroidal wholemount. C Image showing the presence of NSE positive cells in the choroid of a mouse choroid cross section at 40X magnification. Red color represents NSE, a marker of mast cells and macrophages and the blue color is DAPI [43, 44]. Arrows point to NSE label that is from Mast cells. D Showcases a granular GzmB positive cell in a mouse choroid/sclera cross-section. Arrow points to an example cell at 20X magnification. E Representative image of a mast cell positive for GzmB in the upper choroid in mouse. FH Double label image of C-kit (green) and GzmB (red) in mouse choroid wholemount showing mast cells at 20X magnification. While the majority of the cells co-label GzmB and C-kit, the arrow points to a C-kit only cell, suggesting different populations of mast cells based on types of proteases. Asterisk highlights extracellular GzmB in choroid. I Human choroidal wholemount pie piece labelled with GzmB showing relative distribution to choroidal vasculature. JK Representative image showcasing non-dengranulated and degranulating mast cells in Human choroidal wholemount. Scale bar in A, B, E, JK is 10um. Scale bar in C, D, FH is 20um. Scale bar in I is 1 mm
Fig. 9
Fig. 9
Inhibition of choroidal mast cell degranulation suppresses choroidal angiogenesis. (A) Representative images showing the effects of 48/80 treatment compared to control at Day 8 of explant culture. Yellow lines outline and show maximum extent of sprouting area. (B-C) Quantification of vascular sprouting at Day 8 of CSA. Choroid sprouting is significantly increased with 48/80 treatment compared with control (HBSS) treatment. Sprouting curve shown from Day 0 to 10. (D-E) Western blot reveal 48/80-induced increased expression of TGF-B in CA supernatant. (D) Representative western blot of TGF-B. (E) Densitometric quantification of TGF-B western blot. (F) Representative images showing decreased sprouting caused by KF. (G-H) Quantification of vascular sprouting at Day 8 of CSA. Choroid sprouting is significantly decreased in KF + 48/80 treatment compared with only 48/80 treatment. Sprouting curve shown from Day 0 to 8. (I) Representative images showing decreased sprouting caused by VTI-1002 despite mast cell activation. (J-K) Quantification of sprouting at Day 8 of CSA. Choroidal sprouting is significantly decreased in VTI-1002 + 48/80 treatment compared with only 48/80. Sprouting curve shown from Day 0 to 8. Results are presented as mean ‡ SEM. *p < 0.05 in T-test. n of A-C, = 4 per group, n of D-E and F–H = 3 per group. 6600 pixels = 1mm2 sprouting. Scale bar = 1 mm

References

    1. Pascolini D, Mariotti SP (2012) Global estimates of visual impairment: 2010. Br J Ophthalmol 96:614–618 10.1136/bjophthalmol-2011-300539 - DOI - PubMed
    1. Bressler NM, Bressler SB, Fine SL (1988) Age-related macular degeneration. Surv Ophthalmol 32:375–413 10.1016/0039-6257(88)90052-5 - DOI - PubMed
    1. Chen M, Xu H (2015) Parainflammation, chronic inflammation, and age-related macular degeneration. J Leukoc Biol 98:713–725 10.1189/jlb.3RI0615-239R - DOI - PMC - PubMed
    1. van Lookeren Campagne M, Le Couter J, Yaspan BL, Ye W (2014) Mechanisms of age-related macular degeneration and therapeutic opportunities. J Pathol 232:151–164 10.1002/path.4266 - DOI - PubMed
    1. Kaiser PK (2008) Ranibizumab: the evidence of its therapeutic value in neovascular age-related macular degeneration. Core Evid 2:273–294 - PMC - PubMed

MeSH terms

LinkOut - more resources