

Socioeconomic Inequalities in SARS-CoV-2 Infection and COVID-19 Health Outcomes in Urban Italy During the COVID-19 Vaccine Rollout, January-November 2021
- PMID: 38498248
- PMCID: PMC11052739
- DOI: 10.1007/s11524-024-00844-0
Socioeconomic Inequalities in SARS-CoV-2 Infection and COVID-19 Health Outcomes in Urban Italy During the COVID-19 Vaccine Rollout, January-November 2021
Abstract
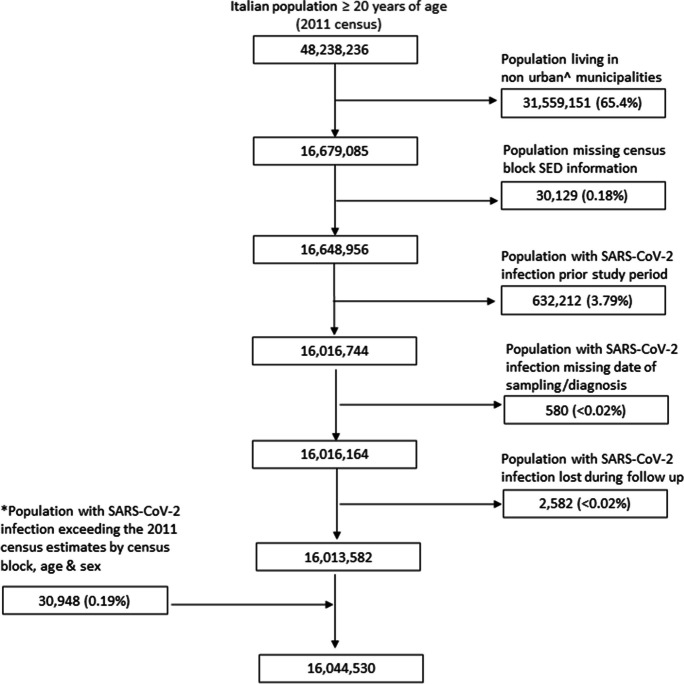
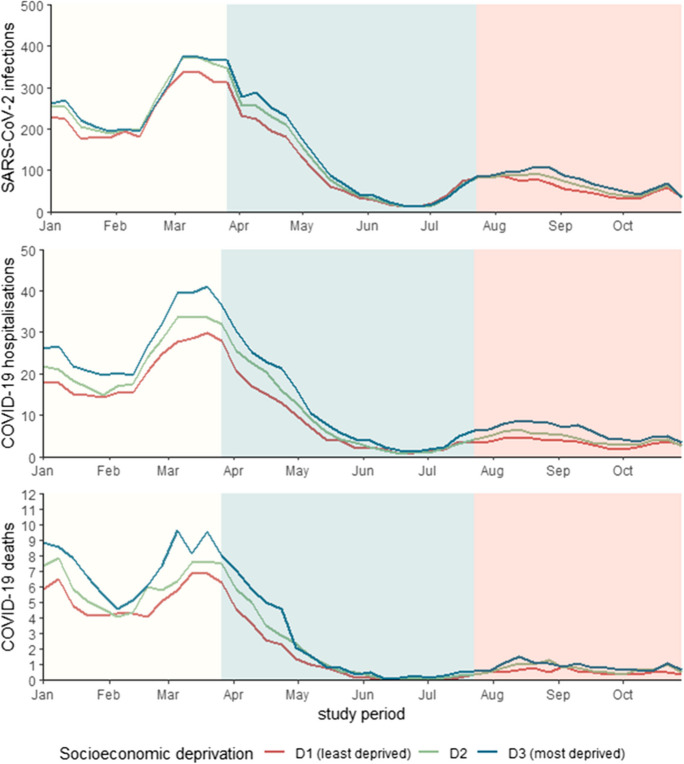
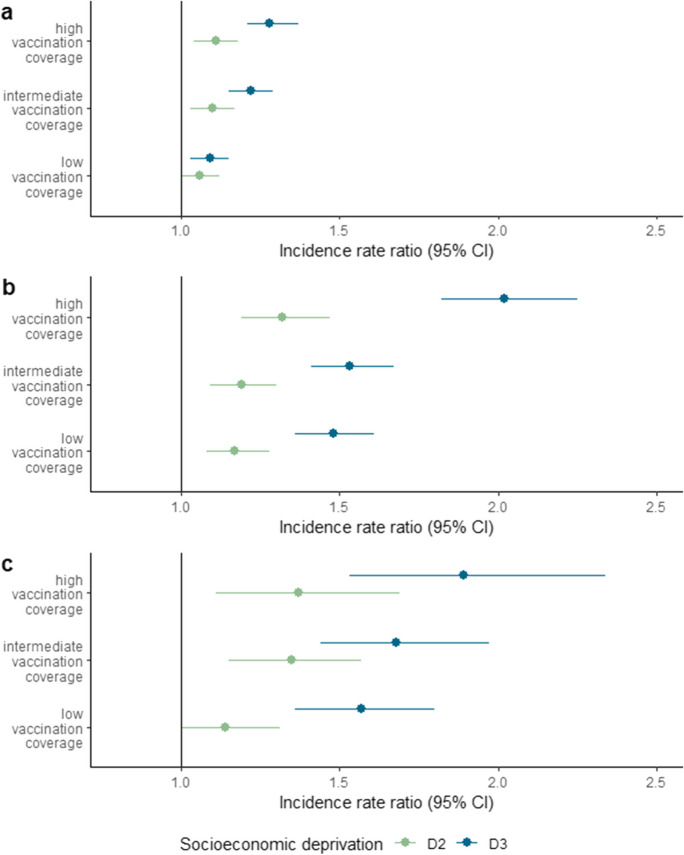
This study analysed the evolution of the association of socioeconomic deprivation (SED) with SARS-CoV-2 infection and COVID-19 outcomes in urban Italy during the vaccine rollout in 2021. We conducted a retrospective cohort analysis between January and November 2021, comprising of 16,044,530 individuals aged ≥ 20 years, by linking national COVID-19 surveillance system data to the Italian SED index calculated at census block level. We estimated incidence rate ratios (IRRs) of infection and severe COVID-19 outcomes by SED tercile relative to the least deprived tercile, over three periods defined as low (0-10%); intermediate (> 10-60%) and high (> 60-74%) vaccination coverage. We found patterns of increasing relative socioeconomic inequalities in infection, hospitalisation and death as COVID-19 vaccination coverage increased. Between the low and high coverage periods, IRRs for the most deprived areas increased from 1.09 (95%CI 1.03-1.15) to 1.28 (95%CI 1.21-1.37) for infection; 1.48 (95%CI 1.36-1.61) to 2.02 (95%CI 1.82-2.25) for hospitalisation and 1.57 (95%CI 1.36-1.80) to 1.89 (95%CI 1.53-2.34) for death. Deprived populations in urban Italy should be considered as vulnerable groups in future pandemic preparedness plans to respond to COVID-19 in particular during mass vaccination roll out phases with gradual lifting of social distancing measures.
Keywords: COVID-19 vaccination; Health inequalities; Socioeconomic deprivation.
© 2024. The Author(s).
Figures
Similar articles
-
Socioeconomic Inequalities in COVID-19 Vaccination and Infection in Adults, Catalonia, Spain.Emerg Infect Dis. 2022 Nov;28(11):2243-2252. doi: 10.3201/eid2811.220614. Epub 2022 Oct 11. Emerg Infect Dis. 2022. PMID: 36220130 Free PMC article.
-
Assessing New York City's COVID-19 Vaccine Rollout Strategy: A Case for Risk-Informed Distribution.J Urban Health. 2024 Oct;101(5):923-933. doi: 10.1007/s11524-024-00853-z. Epub 2024 Apr 5. J Urban Health. 2024. PMID: 38578336 Free PMC article.
-
Incidence of severe and non-severe SARS-CoV-2 infections in children and adolescents: a population-based cohort study using six healthcare databases from Italy, Spain, and Norway.Eur J Pediatr. 2024 Nov 13;184(1):6. doi: 10.1007/s00431-024-05864-1. Eur J Pediatr. 2024. PMID: 39535547
-
SARS-CoV-2 incidence, seroprevalence, and COVID-19 vaccination coverage in the homeless population: a systematic review and meta-analysis.Front Public Health. 2023 Oct 10;11:1044788. doi: 10.3389/fpubh.2023.1044788. eCollection 2023. Front Public Health. 2023. PMID: 37900041 Free PMC article.
-
Social Inequalities in Long-Term Health Effects After COVID-19-A Scoping Review.Int J Public Health. 2024 Feb 7;69:1606739. doi: 10.3389/ijph.2024.1606739. eCollection 2024. Int J Public Health. 2024. PMID: 38384747 Free PMC article.
Cited by
-
Short-term acute outcomes by clinical and socioeconomic characteristics in adults with SARS-CoV-2: a population-based cohort study focused on the first two years of the COVID-19 pandemic.Arch Public Health. 2025 Mar 24;83(1):76. doi: 10.1186/s13690-025-01537-z. Arch Public Health. 2025. PMID: 40122827 Free PMC article.
References
-
- Istituto Superiore di Sanità. COVID-19 integrated surveillance data in Italy. Accessed November 7, 2023. https://www.epicentro.iss.it/en/coronavirus/sars-cov-2-dashboard
MeSH terms
Substances
Grants and funding
LinkOut - more resources
Full Text Sources
Medical
Miscellaneous
