. 2024 Mar 16;24(4):939-951.
doi: 10.17305/bb.2024.10103.

Dynamic network biomarker C1QTNF1 regulates tumor formation at the tipping point of hepatocellular carcinoma

Affiliations

Dynamic network biomarker C1QTNF1 regulates tumor formation at the tipping point of hepatocellular carcinoma

Haoyuan Yu et al. Biomol Biomed. .

Abstract

Identifying the precise moment before the onset of hepatocellular carcinoma (HCC) remains a significant challenge in the medical field. The existing biomarkers fall short of pinpointing the critical point preceding HCC formation. This study aimed to determine the exact tipping point for the transition from cirrhosis to HCC, identify the core Dynamic Network Biomarker (DNB), and elucidate its regulatory effects on HCC. A spontaneous HCC mouse model was established to mimic HCC formation in patients with chronic hepatitis. Using the DNB method, C1q and tumor necrosis factor (TNF) related 1 (C1QTNF1) protein was identified as the key DNB at the crucial tipping time of spontaneous HCC development. Both in vitro and in vivo studies showed that C1QTNF1 could inhibit tumor growth. Overexpression of C1QTNF1 before the tipping point effectively prevented HCC occurrence. Patients with elevated C1QTNF1 expression demonstrated improved overall survival (OS) (P = 0.03) and disease-free survival (DFS) (P = 0.03). The diagnostic value of C1QTNF1 was comparable to that of alpha-fetoprotein (AFP) (area under the curve [AUC] = 0.84; sensitivity 85%; specificity 80%). Furthermore, our research indicated that platelet-expressed C1QTNF1 is involved in cancer-associated signaling pathways. Our findings introduce a novel perspective by highlighting C1QTNF1 as the pivotal biomarker at the tipping point of primary HCC formation using DNB. We propose C1QTNF1 as a prognostic biomarker for HCC, potentially influencing tumor development through a platelet-related cancer signaling pathway.


Conflict of interest statement

Conflicts of interest: Authors declare no conflicts of interest.

Figures

Figure 1.
Figure 1.
Dynamic gene expression changes in primary tumors during the progression in spontaneous HCC models. (A) Depicting the process of establishing the spontaneous HCC mouse model. Mice received intraperitoneal injections of DEN (30 mg/kg) to induce the subcutaneous xenograft model. Liver tissues were collected monthly, and sections were stained with H&E. The spontaneous tumor (indicated by a green arrow) was observed in the 8th month; magnification ×200. (B) Heatmap illustrating unsupervised hierarchical clustering analysis based on DEGs. Gene expression patterns from liver tissues in the 6th month post-DEN injection did not cluster with other time points, suggesting a distinct profile at this stage. (C) Diagram series showcasing the dynamic patterns of DEG changes throughout the development of the spontaneous tumor. HCC: Hepatocellular carcinoma; DEN: N-nitrosodiethylamine; H&E: Hematoxylin and eosin; DEGs: Differentially expressed genes.
Figure 2.
Figure 2.
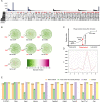
Prioritizing of C1QTNF1 as one of the core DNBs in HCC development. (A) An UpSet plot depicting the overlap of gene expression patterns each month with that of the first month, highlighting the sixth month as the point of most significant differential expression; (B) Network diagrams illustrating the dynamic changes in gene expression and network structure characteristic of HCC development beginning in the sixth month; (C) A schematic representation of the phase transition during HCC development, segmented into three stages: normal liver, pre-HCC stage, and HCC stage; (D) Graph indicating that the critical transition occurs at six months post-DEN injection, as inferred from the CI calculated from gene expression data across all time points; (E) A bar graph presenting the ranking of DNB genes based on four prioritized criteria during HCC progression, with C1QTNF1 emerging as the leading candidate for subsequent functional analyses. C1QTNF1: C1q and tumor necrosis factor (TNF)-related 1; DNBs: Dynamic network biomarkers; HCC: Hepatocellular carcinoma; DEN: N-nitrosodiethylamine; CI: Criticality index; M: Month; DEGs: Differentially expressed genes.
Figure 3.
Figure 3.
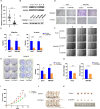
CIQTNF1 is an HCC invasion suppressor in vitro and in vivo. (A) q-PCR detecting the C1QTNF1 mRNA expression in tumor and adjacent non-tumor tissues from 37 HCC patients; (B) Western blot analysis depicting the C1QTNF1 protein expression levels in HCC tumor and non-tumor tissue samples; (C) Western blot analysis depicting the C1QTNF1 protein expression levels in a normal liver cell line (THLE-2) and hepatoma cell lines (Huh7, Hep3B, SNU398, SNU449); (D and E) Transwell migration and invasion assays demonstrating the effects of C1QTNF1 overexpression vs control on the chemotactic behavior of Huh7 and SNU449 hepatoma cell lines under monolayer conditions; magnification ×200; (F and G) The scratch assay evaluating the migratory response into wound areas by Huh7 and SNU449 cells with C1QTNF1 overexpression; (H) The clonogenic assay assessing the proliferation ability of Huh7 and SNU449 hepatoma cells upon C1QTNF1 overexpression; (I) Tumor volume comparison in nude mice injected in the inguinal region with SNU449 cells transfected with either scramble control or C1QTNF1-overexpressing lentivirus; (J and K) Tumors harvested from nude mice injected with SNU449 cells transfected with scramble control or C1QTNF1-overexpressing lentivirus after 16 days. * P < 0.05; **P < 0.01; ***P < 0.005; ****P < 0.0001. C1QTNF1: C1q and tumor necrosis factor (TNF)-related 1; HCC: Hepatocellular carcinoma; q-PCR: Quantitative real-time polymerase chain reaction; mRNA: Messenger RNA; T: Tumor; N: Non-tumor tissue; GAPDH: Glyceraldehyde 3-phosphate dehydrogenase.
Figure 4.
Figure 4.
Rewiring of C1QTNF1-subnet before the HCC formation tipping point. (A) Depicting a spontaneous HCC mouse model establishment. At the fifth month, AAV9-C1QTNF1 was administered to induce C1QTNF1 overexpression in the liver, with CON404 serving as the control, both delivered through the tail vein. The livers were harvested after 12 months. (B) Western blot analysis assessing C1QTNF1 expression in the livers of mice from both the AAV9-C1QTNF1 and CON404 groups. (C–F) Graphs depicting the assessment of tumor development (C), liver/body weight ratio (D), serum AFP levels (E), and serum ALT levels (F), at 12 months post-DEN injection. *P < 0.05. C1QTNF1: C1q and tumor necrosis factor (TNF)-related 1; HCC: Hepatocellular carcinoma; AAV9: Adeno-associated virus 9; CON: Control; AFP: Alpha-fetoprotein; ALT: Alanine aminotransferase; DEN: N-nitrosodiethylamine; GAPDH: Glyceraldehyde 3-phosphate dehydrogenase; NULL: No tumor was observed; NS: No significance.
Figure 5.
Figure 5.
Assessment of the prognostic and diagnostic value of C1QTNF1 in HCC patients. (A) Immunohistochemical staining of C1QTNF1 in 96 HCC tissue samples; magnification ×200. (B and C) Kaplan–Meier survival curves displaying the OS (B) and DFS (C) based on C1QTNF1 expression levels measured using the immunohistological staining score. Group differences were evaluated using the log-rank test (P ═ 0.03 for both). (D) ROC curve analysis comparing the diagnostic value of C1QTNF1 levels in HCC tissues with serum AFP levels. The AUC for C1QTNF1 and AFP were 0.84 and 0.83, respectively. C1QTNF1: C1q and tumor necrosis factor (TNF)-related 1; HCC: Hepatocellular carcinoma; OS: Overall survival; DFS: Disease-free survival; ROC: Receiver operating characteristic; AFP: Alpha-fetoprotein; AUC: Area under the curve.
Figure 6.
Figure 6.
Dynamic gene changes associated with C1QTNF1 during HCC progression. (A) Heatmap displaying gene dynamics associated with C1QTNF1 during HCC progression; (B) Heatmap illustrating the dynamic activity of related KEGG pathways involving C1QTNF1 and its correlated DEGs; (C) Diagram depicting the top 20 most relevant genes identified each month, based on an overall final ranking across the timeline from the first to the eighth month; (D) Graph illustrating the top ten genes and their proportion in all correlation weights around the tipping point; (E) Immunofluorescent staining displaying the correlation of C1QTNF1 (green fluorescence) and CD41 (red fluorescence), a platelet marker, in both normal and tumor tissues; magnification ×200; (F) Western blot analysis comparing C1QTNF1 expression in THLE-2 and SNU449 cell lines and platelets isolated from healthy donors. Furthermore, C1QTNF1 expression was compared between platelets from HCC patients and healthy controls. C1QTNF1: C1q and tumor necrosis factor (TNF)-related 1; HCC: Hepatocellular carcinoma; KEGG: Kyoto Encyclopedia of Genes and Genomes; DEGs: Differentially expressed genes; CD: Cluster of differentiation; NF: Nuclear factor; Pecam1: Platelet and endothelial cell adhesion molecule 1; DAPI: 4′, 6-diamidino-2-phenylindole; GAPDH: Glyceraldehyde 3-phosphate dehydrogenase; HC: Healthy controls.

Similar articles

Cited by

References

    1. Sung H, Ferlay J, Siegel RL, Laversanne M, Soerjomataram I, Ahmedin Jemal DMV, et al. Global Cancer Statistics 2020: GLOBOCAN estimates of incidence and mortality worldwide for 36 cancers in 185 countries. CA Cancer J Clin. 2021;71(3):209–49. https://doi.org/10.3322/caac.21660. - PubMed
    1. European Association for the Study of the Liver. EASL clinical practice guidelines: management of hepatocellular carcinoma. J Hepatol. 2018;69(1):182–236. https://doi.org/10.1016/j.jhep.2018.03.019. - PubMed
    1. Llovet JM, De Baere T, Kulik L, Haber PK, Greten TF, Meyer T, Lencioni R, et al. Locoregional therapies in the era of molecular and immune treatments for hepatocellular carcinoma. Nat Rev Gastroenterol Hepatol. 2021;18(5):293–313. https://doi.org/10.1038/s41575-020-00395-0. - PubMed
    1. Vogel A, Meyer T, Sapisochin G, Salem R, Saborowski A, et al. Hepatocellular carcinoma. Lancet. 2022;400(10360):1345–62. https://doi.org/10.1016/S0140-6736(22)01200-4. - PubMed
    1. Rizzo A, Ricci AD, and Brandi G. Atezolizumab in advanced hepatocellular carcinoma: good things come to those who wait. Immunotherapy. 2021;13(8):637–44. https://doi.org/10.2217/imt-2021-0026. - PubMed