

doi: 10.1002/cac2.12536.
Epub 2024 Mar 18.
Positive regulation of cell proliferation by the miR-1290-EHHADH axis in hepatocellular carcinoma
Affiliations
- PMID: 38498379
- PMCID: PMC11194445
- DOI: 10.1002/cac2.12536
Item in Clipboard
Positive regulation of cell proliferation by the miR-1290-EHHADH axis in hepatocellular carcinoma
Cancer Commun (Lond).
2024 Jun.
No abstract available
Conflict of interest statement
The authors have declared that no competing interest exists.
Figures
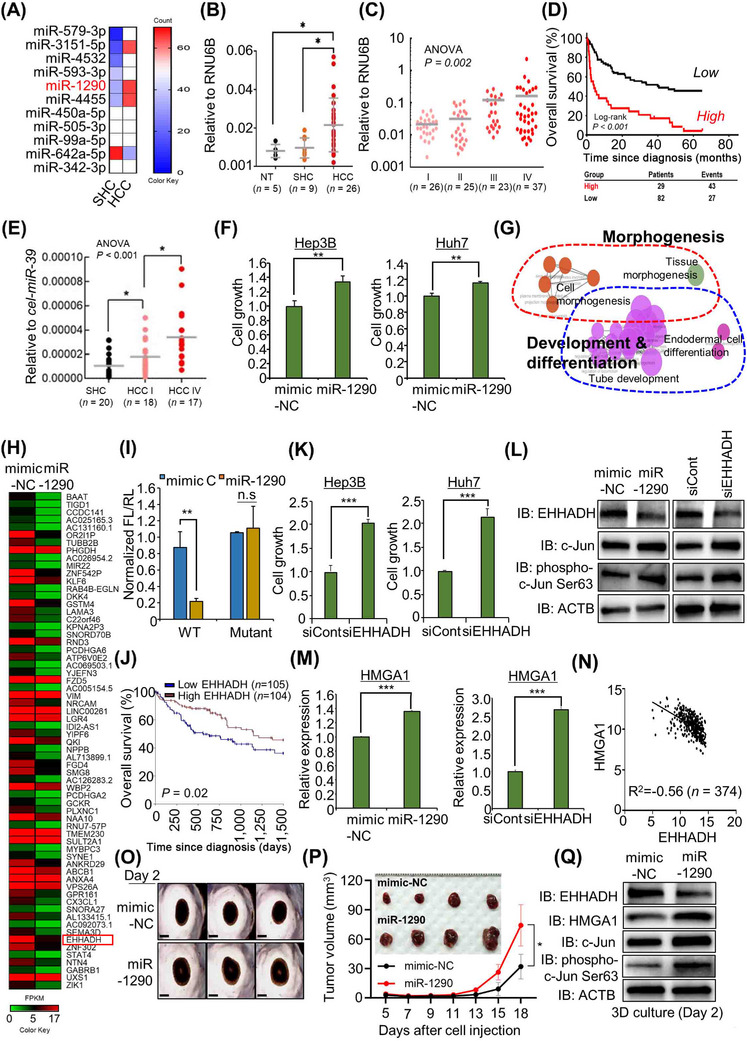
miR‐1290 is a potential therapeutic and diagnostic marker for HCC. (A) Eleven differentially expressed HCC‐specific microRNAs between SHC and HCC tissues in NanoString analysis (white; middle‐expression, red; high‐expression, blue; low‐expression). (B) Expression status of miR‐1290 in NT, SHC tissues, and HCC tissues. The gray horizontal bars represent mean expression levels. The RNU6B is used as a reference in miR‐1290 expression analysis; *P < 0.05, student t‐tests. (C) Expression level of miR‐1290 in different TNM stages (I‐IV) of HCC (n = 111) in the 8th editions of the AJCC TNM staging system. The RNU6B is used as a reference in miR‐1290 expression analysis; P = 0.002, ANOVA. (D) Kaplan‒Meier overall survival analysis based on miR‐1290 expression in HCC patients (n = 111; P < 0.001, log‐rank test). (E) Expression status of exosomal‐miR‐1290 in sera from SHC patients, TNM stage I of HCC patients, and TNM stage IV of HCC patients. The gray horizontal bars represent mean expression levels. The synthetic cel‐miR‐39 is added for spike‐in during RNA extraction in serum samples, which is used as a reference in exosomal‐miR‐1290 expression analysis; *P < 0.05, student t‐test. (F) CCK‐8 solution was added to the culture medium, and the cells were incubated for 5 min at 37°C. Cell growth was assessed by detecting the absorbance with a microplate reader (450 nm). The mean ± SD of three independent experiments are shown, and P‐values were calculated using Student's t‐tests (**P < 0.01). (G) GO pathway term enrichment networks. GO pathway term networks in the miR‐1290‐mimic and control groups were functionally grouped by ClueGO. Terms in the functionally grouped networks were cut off at P‐values > 0.05. (H) Heatmap of RNA‐seq data in the control and miR‐1290 mimic groups. (I) Construction of a dual luciferase reporter vector including normal seed match sequences (WT) or mutant sequences (MUT) of the miR‐1290 binding site in the EHHADH 3’ UTR (upper). Luciferase reporter assay of the 3’ UTR of EHHADH in HEK293T cells transfected with miR‐1290 mimic and the luciferase reporter vector. The mean ± SD of three independent experiments are shown, and P‐values were calculated using Student's t‐tests (** P < 0.01, n.s. not significant). (J) Kaplan‒Meier plot of overall survival for HCC patients in the TCGA cohort. The survival rate of the high EHHADH group was significantly increased compared with that of the low EHHADH group (P = 0.02). (K) CCK‐8 solution was added to the culture medium, and the cells were incubated for 5 min at 37°C. Cell growth was assessed by detecting the absorbance with a microplate reader (450 nm). The mean ± SD of three independent experiments are shown, and P‐values were calculated using Student's t‐tests (***P < 0.001). (L) Western blot analysis after transfection with miR‐1290 (left) and siEHHADH (right) using anti‐EHHADH, anti‐c‐JUN, anti‐phospho‐c‐Jun (Ser63), and anti‐ACTB antibodies. ACTB was used as the internal control in Hep3B cells. (M) qRT‒PCR analysis of HMGA1 expression after transfection with miR‐1290 (left) and siEHHADH (right). The mean ± SD of three independent experiments are shown, and P‐values were calculated using Student's t‐tests (***P < 0.001). (N) Scatter plots of HMGA1 and EHHADH in the TCGA portal. Each dotted line indicates a linear regression line of the expression of HMGA1 and EHHADH. P‐values and correlation coefficients (r) between two genes were obtained using the Pearson correlation method. (O) The 3D spheroid formation assay. Hep3B cells transfected with miR‐1290 or mimic‐NC were loaded onto ULA plates and incubated until 48 h when the spheroids were photographed under a microscope, scale bar, 500 µm. (P) 3 × 10⁶ Huh7 cells with mimic‐NC or miR‐1290 mimic were subcutaneously injected into NOG mice. After cell injection, the tumor volume and body weight of mice were measured every 2‐3 days. The mean ± SEM from four independent experiments is shown, with P‐values calculated using Two‐way ANOVA (*P < 0.05) (below graph). Eighteen days after cell injection, all tumors were isolated from mice (upper picture). (Q) Western blot analysis after miR‐1290 and mimic‐NC transfection using anti‐EHHADH, anti‐HMGA1, anti‐c‐JUN, anti‐phospho‐c‐Jun (Ser63), and anti‐ACTB antibodies. ACTB was used as the internal control in Hep3B spheroids. Abbreviations: ACTB, β‐actin; ANOVA, Analysis of Variance; AT‐hook 1; c‐JUN, Jun Proto‐Oncogene protein; CCK‐8, Cell Counting Kit‐8; EHHADH, enoyl‐CoA, hydratase/3‐hydroxyacyl CoA dehydrogenase; GO, gene ontology; HCC, hepatocellular carcinoma; HMGA1, high‐mobility group AT‐hook 1; M stage, distant metastasis according to the International Union Against Cancer; miR‐1290, microRNA‐1290; mimic‐NC, control‐mimic; NT, normal healthy liver tissues; N stage, lymph node metastasis according to the International Union Against Cancer; SD, Standard Deviation; SHC, steatohepatitis cirrhosis; T stage, tumor depth according to the International Union Against Cancer; TCGA, The Cancer Genome Atlas; ULA, ultralow attachment; UTR, untranslated region.
References
-
- Sung H, Ferlay J, Siegel RL, Laversanne M, Soerjomataram I, Jemal A, et al. Global Cancer Statistics 2020: GLOBOCAN Estimates of Incidence and Mortality Worldwide for 36 Cancers in 185 Countries. CA Cancer J Clin. 2021;71(3):209–49. - PubMed
Publication types
MeSH terms
Substances
Grants and funding
- National Research Foundation of Korea
- 2018M3A9H3023077/ 2021M3A9H3016046/Ministry of Science, ICT and Future Planning
- 2020R1C1C100743/Ministry of Science, ICT and Future Planning
- 2019R1A2C1083892/Ministry of Science, ICT and Future Planning
- 2021R1A5A2021614/Ministry of Science, ICT and Future Planning
LinkOut - more resources
Full Text Sources
Medical
Molecular Biology Databases
