

Biodiversity mitigates drought effects in the decomposer system across biomes
- PMID: 38498717
- PMCID: PMC10990129
- DOI: 10.1073/pnas.2313334121
Biodiversity mitigates drought effects in the decomposer system across biomes
Abstract
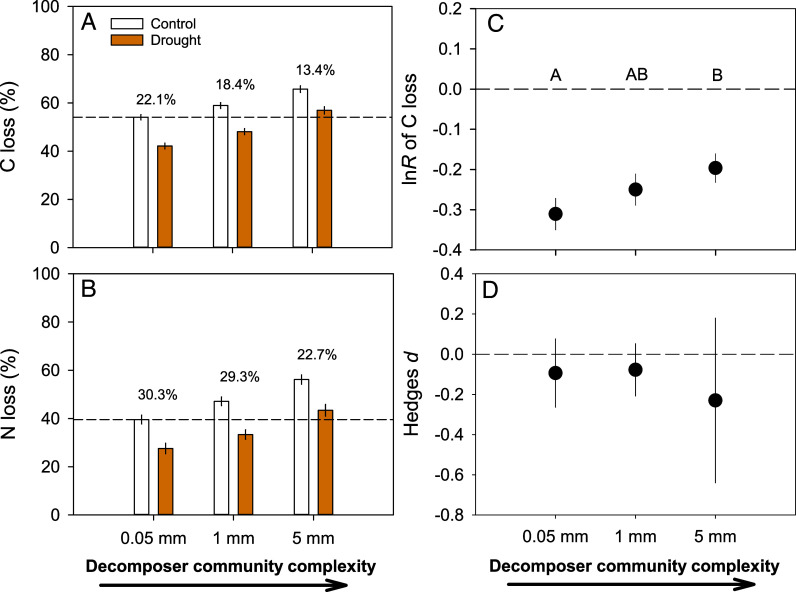
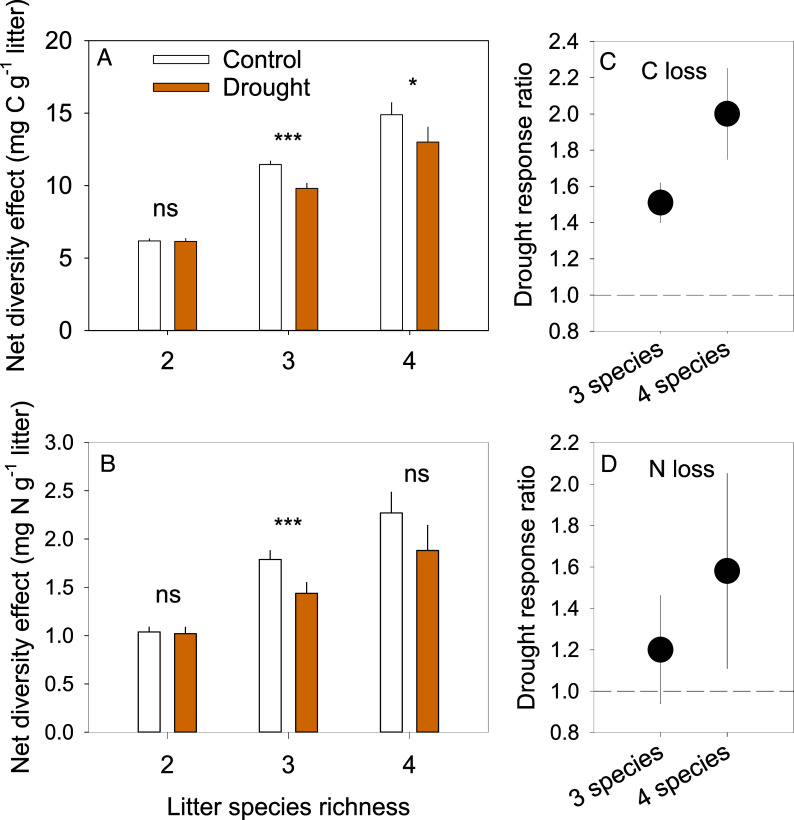
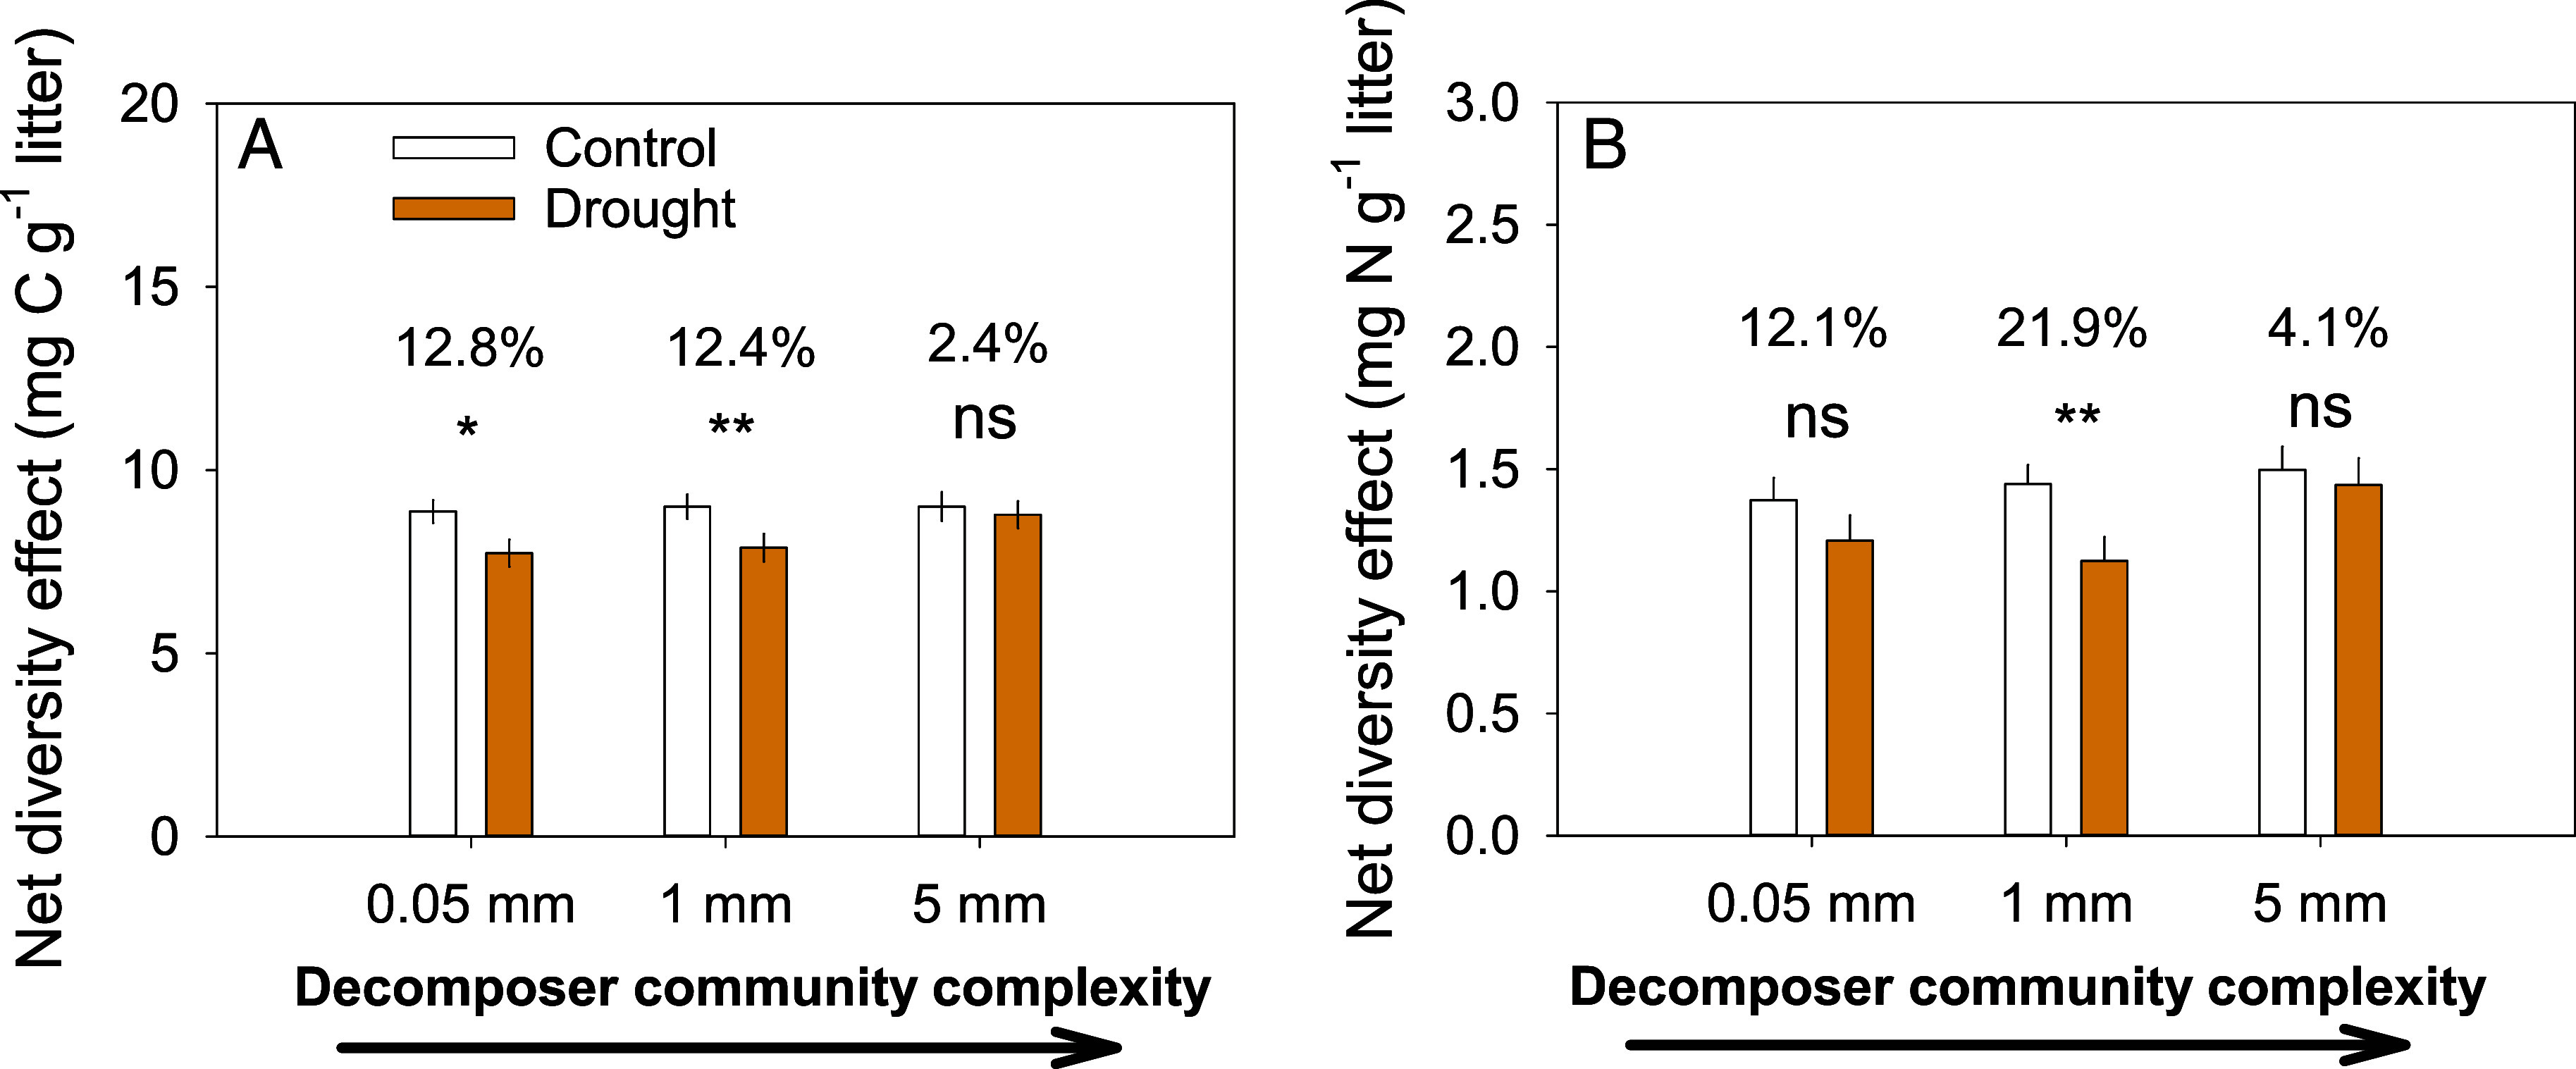
Multiple facets of global change affect the earth system interactively, with complex consequences for ecosystem functioning and stability. Simultaneous climate and biodiversity change are of particular concern, because biodiversity may contribute to ecosystem resistance and resilience and may mitigate climate change impacts. Yet, the extent and generality of how climate and biodiversity change interact remain insufficiently understood, especially for the decomposition of organic matter, a major determinant of the biosphere-atmosphere carbon feedbacks. With an inter-biome field experiment using large rainfall exclusion facilities, we tested how drought, a common prediction of climate change models for many parts of the world, and biodiversity in the decomposer system drive decomposition in forest ecosystems interactively. Decomposing leaf litter lost less carbon (C) and especially nitrogen (N) in five different forest biomes following partial rainfall exclusion compared to conditions without rainfall exclusion. An increasing complexity of the decomposer community alleviated drought effects, with full compensation when large-bodied invertebrates were present. Leaf litter mixing increased diversity effects, with increasing litter species richness, which contributed to counteracting drought effects on C and N loss, although to a much smaller degree than decomposer community complexity. Our results show at a relevant spatial scale covering distinct climate zones that both, the diversity of decomposer communities and plant litter in forest floors have a strong potential to mitigate drought effects on C and N dynamics during decomposition. Preserving biodiversity at multiple trophic levels contributes to ecosystem resistance and appears critical to maintain ecosystem processes under ongoing climate change.
Keywords: biodiversity; climate change; ecosystem functioning; forest carbon cycling; litter decomposition.
Conflict of interest statement
Competing interests statement:The authors declare no competing interest.
Figures
Similar articles
-
Biodiversity mediates the effects of stressors but not nutrients on litter decomposition.Elife. 2020 Jun 26;9:e55659. doi: 10.7554/eLife.55659. Elife. 2020. PMID: 32589139 Free PMC article.
-
Consequences of biodiversity loss for litter decomposition across biomes.Nature. 2014 May 8;509(7499):218-21. doi: 10.1038/nature13247. Nature. 2014. PMID: 24805346
-
Plant diversity does not buffer drought effects on early-stage litter mass loss rates and microbial properties.Glob Chang Biol. 2013 Sep;19(9):2795-803. doi: 10.1111/gcb.12225. Epub 2013 May 29. Glob Chang Biol. 2013. PMID: 23606531
-
Global contribution of invertebrates to forest litter decomposition.Ecol Lett. 2024 Apr;27(4):e14423. doi: 10.1111/ele.14423. Ecol Lett. 2024. PMID: 38584578 Review.
-
Biodiversity as a solution to mitigate climate change impacts on the functioning of forest ecosystems.Biol Rev Camb Philos Soc. 2018 Feb;93(1):439-456. doi: 10.1111/brv.12351. Epub 2017 Jul 10. Biol Rev Camb Philos Soc. 2018. PMID: 28695682 Review.
Cited by
-
Nitrogen trade-offs between roots and leaves of Moso bamboo and different effects of management practices on root traits and processes in subtropical forests.Front Plant Sci. 2025 May 15;16:1583127. doi: 10.3389/fpls.2025.1583127. eCollection 2025. Front Plant Sci. 2025. PMID: 40453335 Free PMC article.
-
Functional diversity of soil macrofauna may contribute to microbial community stabilization under drought stress.Front Microbiol. 2025 Jun 13;16:1597272. doi: 10.3389/fmicb.2025.1597272. eCollection 2025. Front Microbiol. 2025. PMID: 40584030 Free PMC article.
References
-
- Reichstein M., et al. , Climate extremes and the carbon cycle. Nature 500, 287–295 (2013). - PubMed
-
- Davidson E. A., Janssens I. A., Temperature sensitivity of soil carbon decomposition and feedbacks to climate change. Nature 440, 165–173 (2006). - PubMed
-
- Coûteaux M.-M., Bottner P., Berg B., Litter decomposition, climate and liter quality. Trends Ecol. Evol. 10, 63–66 (1995). - PubMed
-
- Aerts R., Climate, leaf litter chemistry and leaf litter decomposition in terrestrial ecosystems: A triangular relationship. Oikos 79, 439–449 (1997).
MeSH terms
Substances
Grants and funding
- 2021YFD2200403/MOST | National Key Research and Development Program of China (NKPs)
- 31930078 31971461 32101500/National Natural Science fundation of China
- 1632021023; 1632019006/National Natural Science fundation of China
- 42073080/Fundamental Research Funds for ICBR
- 2021YFD2200405/MOST | National Key Research and Development Program of China (NKPs)
LinkOut - more resources
Full Text Sources
