. 2024 Mar 26;121(13):e2312664121.
doi: 10.1073/pnas.2312664121. Epub 2024 Mar 18.

Sleep deprivation drives brain-wide changes in cholinergic presynapse abundance in Drosophila melanogaster

Affiliations

Sleep deprivation drives brain-wide changes in cholinergic presynapse abundance in Drosophila melanogaster

Jacqueline T Weiss et al. Proc Natl Acad Sci U S A. .

Abstract

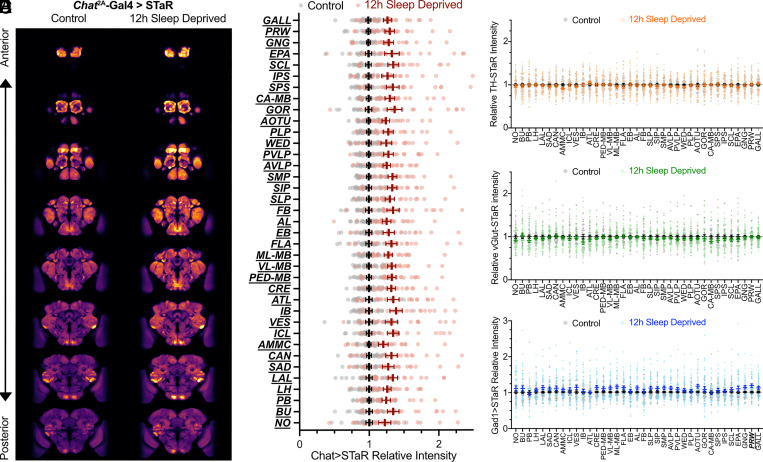
Sleep is an evolutionarily conserved state that supports brain functions, including synaptic plasticity, in species across the animal kingdom. Here, we examine the neuroanatomical and cell-type distribution of presynaptic scaling in the fly brain after sleep loss. We previously found that sleep loss drives accumulation of the active zone scaffolding protein Bruchpilot (BRP) within cholinergic Kenyon cells of the Drosophila melanogaster mushroom body (MB), but not in other classes of MB neurons. To test whether similar cell type-specific trends in plasticity occur broadly across the brain, we used a flp-based genetic reporter to label presynaptic BRP in cholinergic, dopaminergic, GABAergic, or glutamatergic neurons. We then collected whole-brain confocal image stacks of BRP intensity to systematically quantify BRP, a marker of presynapse abundance, across 37 neuropil regions of the central fly brain. Our results indicate that sleep loss, either by overnight (12-h) mechanical stimulation or chronic sleep disruption in insomniac mutants, broadly elevates cholinergic synapse abundance across the brain, while synapse abundance in neurons that produce other neurotransmitters undergoes weaker, if any, changes. Extending sleep deprivation to 24 h drives brain-wide upscaling in glutamatergic, but not other, synapses. Finally, overnight male-male social pairings induce increased BRP in excitatory synapses despite male-female pairings eliciting more waking activity, suggesting experience-specific plasticity. Within neurotransmitter class and waking context, BRP changes are similar across the 37 neuropil domains, indicating that similar synaptic scaling rules may apply across the brain during acute sleep loss and that sleep need may broadly alter excitatory-inhibitory balance in the central brain.

Keywords: Drosophila; plasticity; sleep.


Conflict of interest statement

Competing interests statement:The authors declare no competing interest.

Figures

Fig. 1.
Fig. 1.
Overnight sleep deprivation increases overall brain-wide BRP abundance in cholinergic neurons, but not in dopaminergic, glutamatergic, or GABAergic neurons. (A) Average brains for control (Left) and sleep-deprived (Right) Chat2A-Gal4>STaR flies. (A′) Cumulative distribution plots of total pixel intensities of Chat2A-Gal4>STaR brains for control (gray) and sleep-deprived (maroon) flies. The Kolmogorov–Smirnov test finds D = 0.134, n = 4.63 × 10⁸ to 5.03 × 108 pixels/group. (B) Average brains for control (Left) and sleep-deprived (Right) TH-Gal4>STaR flies. (B′) Cumulative distribution plots of total pixel intensities of TH-Gal4>STaR brains for control (gray) and sleep-deprived (orange) flies. The Kolmogorov–Smirnov test finds D = 0.047, n = 8.25 × 10⁸ to 8.65 × 108 pixels/group. (C) Average brains for control (Left) and sleep-deprived (Right) VGlut-Gal4>STaR flies. (C′) Cumulative distribution plots of total pixel intensities of VGlut-Gal4>STaR brains for control (gray) and sleep-deprived (green) flies. The Kolmogorov–Smirnov test finds D = 0.029, n = 7.85 × 10⁸ to 8.85 × 108 pixels/group. (D) Average brains for control (Left) and sleep-deprived (Right) Gad1-Gal4>STaR flies. (D′) Cumulative distribution plots of total pixel intensities of Gad1-Gal4>STaR brains for control (gray) and sleep-deprived (blue) flies. The Kolmogorov–Smirnov test finds D = 0.056, n = 8.05 × 10⁸ to 8.65 × 108 pixels/group. For panels (A′–D′), dotted lines represent group mean pixel intensity values, and box plots depict quartile ranges with group mean. See also SI Appendix, Fig. S2 A–D for sleep traces and Movies S1–S4 for z-stack animations from experimental groups in (AD).
Fig. 2.
Fig. 2.
Neuropil regions within each neurotransmitter group are similarly affected by sleep loss. (A) Sections along the z-axis through average brains for control (Left) and sleep-deprived (Right) Chat2A-Gal4>STaR flies. (B) Regional analysis of BRP intensity Chat2A-Gal4>STaR flies after 12 h of overnight sleep loss (maroon) normalized to the average BRP pixel intensity of rested controls (gray). Two-way ANOVA finds a significant effect of SD [F(1,46) = 19.98, P < 0.0001, n = 24 to 25 brains/group]. Pairwise comparisons using Sidak’s multiple comparisons test found significant increases in BRP::V5 intensity in each neuropil region after sleep deprivation relative to rested siblings (P < 0.05 for each test). (C) Regional analysis of BRP intensity TH-Gal4>STaR flies after 12 h of overnight sleep loss (orange) normalized to rested controls (gray). Two-way ANOVA finds no significant effect of SD [F(1,80) = 0.2679, P = 0.6061, n = 41 brains/group]. (D) Regional analysis of BRP intensity VGlut-Gal4>STaR flies after 12 h of overnight sleep loss (green) normalized to rested controls (gray). Mixed-effects analysis finds no significant main effect of SD [F(1,81) = 0.9435, P = 0.3343, n = 36 to 44 flies/group]. Pairwise comparisons using Sidak’s multiple comparisons test found no significant changes in BRP::V5 intensity in each neuropil region after sleep deprivation relative to rested siblings (P > 0.805 for each test). (E) Regional analysis of BRP intensity Gad1-Gal4>STaR flies after 12 h of overnight sleep loss (blue) normalized to rested controls (gray). Two-way ANOVA finds a significant group-by-region interaction [F(36,2875) = 2.713, P < 0.001, n = 40 to 43 brains/group]. Pairwise comparisons using Sidak’s multiple comparisons test found a significant increase in BRP::V5 intensity in the prow after sleep deprivation relative to rested siblings (P = 0.030), but no significant changes in BRP::V5 intensity in other neuropil regions (P > 0.2199 for each test). For (BE), circles show individual data points; data are normalized to the average BRP pixel intensity of rested controls. Group averages and error bars depict means ± SEM. Pairwise significance is denoted by bolded and underlined region labels.
Fig. 3.
Fig. 3.
Twenty-four hours of sleep loss results in increased BRP across the brain in glutamatergic neurons. (A) Mean confocal projections for control (Left) and 24-h sleep-deprived (Right) TH-Gal4>STaR flies. (B) Cumulative distribution plot of relative TH-Gal4>STaR intensity (Left), and regional mean TH-Gal4>STaR intensities (Right) for control (gray) and 24 h SD (orange) flies. The Kolmogorov–Smirnov test for cumulative distribution plot finds D = 0.030, n = 3.63 × 108 pixels/group. Mixed-effects analysis finds a significant condition-by-region interaction [F(36,1565) = 2.099, P = 0.0002, n = 23 brains/group]. (C) Mean confocal projections for control (Left) and 24-h sleep-deprived (Right) vGlut-Gal4>STaR flies. (D) Cumulative distribution plot of relative vGlut-Gal4>STaR intensity (Left) and regional mean vGlut-Gal4>STaR intensities (Right) for control (gray) and 24-h SD (green) flies. The Kolmogorov–Smirnov test for cumulative distribution plot finds D = 0.0179, n = 3.82 × 108 pixels/group. Mixed-effects analysis finds a significant condition-by-region interaction [F(36,1275) = 1.509, P = 0.0299, n = 19 brains/group). (E) Mean confocal projections for control (Left) and 24-h sleep-deprived (Right) Gad1-Gal4>STaR flies. (F) Cumulative distribution plot of relative Gad1-Gal4>STaR intensity (Left) and regional mean Gad1-Gal4>STaR intensities (Right) for control (gray) and 24-h SD (blue) flies. The Kolmogorov–Smirnov test for cumulative distribution plot finds D = 0.0206, n = 3.82 × 108 pixels/group. Mixed-effects analysis finds no significant effect of condition [F(1,36) = 1.716, P = 0.1985, n = 19 brains/group]. For Left panels in (B, D, and F), dotted lines represent group mean pixel intensity values, and box plots depict quartile ranges with group mean. For regional quantifications in (B, D, and F), circles show individual data points; data are normalized to the average BRP pixel intensity of rested controls. Group averages and error bars depict means ± SEM. Pairwise significance is denoted by bolded and underlined region labels. See also SI Appendix, Fig. S2 E and F for sleep traces and Movies S5–S7 for z-stack animations from experimental groups.
Fig. 4.
Fig. 4.
Effects of insomniac2 mutation on brain-wide BRP abundance across neurotransmitter identities. (A) Projection of mean Chat2A-Gal4>STaR signal in wild-type (Left) and inc2 mutants (right). (A′) Cumulative distribution plots of pixel intensities from Chat2A-Gal4>STaR brains for control (gray) and inc2 mutant (maroon) flies. The Kolmogorov–Smirnov test finds D = 0.0416, n = 4.02 × 108 pixels/group. (B) Mean TH-Gal4>STaR intensity in wild-type (Left) and inc2 mutant (Right) brains. (B′) Cumulative distribution plot of pixel intensities for TH-Gal4>STaR signal from wild-type (gray) and inc2 mutant (orange) flies. The Kolmogorov–Smirnov test finds D = 0.02719, n = 5.03 × 10⁸ to 5.43 × 108 pixels/group. (C) Average VGlut2A-Gal4>STaR intensity from wild-type (Left) and inc2 (Right) brains. (C′) Cumulative distribution plot of pixel intensities for VGlut2A-Gal4>STaR signal from wild-type (gray) and inc2 mutant (green) flies. The Kolmogorov–Smirnov test finds D = 0.0131, n = 6.64 × 10⁸ to 7.45 × 108 pixels/group. (D) Average Gad1-Gal4>STaR signal intensity in wild-type (Left) and inc2 mutant (Right) brains. (D′) Cumulative distribution of voxel intensities for Gad1-Gal4>STaR signal from wild-type (gray) and inc2 mutant (blue) flies. The Kolmogorov–Smirnov test finds D = 0.08844, n = 6.84 × 10⁸ to 8.04 × 108 pixels/group. (E and E′) Chat2A-Gal4>STaR signal reveals variable loss of Mushroom Body lobes in inc2 mutants with only 5/20 brains showing all intact MB lobes. Examples of inc2; Chat2A-Gal4>STaR brains with missing vertical lobes are shown in (E′). For panels (A′, B′, C′, and D′), dotted lines represent group mean pixel intensity values, and box plots depict quartile ranges with group mean. See also SI Appendix, Fig. S3 A–D for sleep traces and Movies S8–S11 for animations of mean registered z-stacks from experimental groups in (AD).
Fig. 5.
Fig. 5.
Regional scaling of BRP across neurotransmitter systems in short-sleeping inc2 flies. (A) Montage of individual coronal slices showing group average Chat2A-Gal4>STaR signal in wild-type (Left) and insomniac2 mutant (Right) flies. (B) Mean Chat2A-Gal4>STaR signal across neuropil regions in wild-type (gray) and inc2 mutants (red), normalized to mean BRP pixel intensity from the wild-type control group. Two-way repeated-measures ANOVA finds a significant genotype-by-region interaction [F(34,1292)=5.609, P < 0.0001, n = 20 brains/group]. Bold and underlined labels on the vertical axis represent regions with a significant effect of genotype by post hoc Holm–Šídák's multiple comparisons test. (C) Average normalized TH-Gal4>STaR signal across neuropil regions in wild-type (gray) and inc2 mutants (orange). Mixed-effects analysis finds a significant genotype-by-region interaction [F(34,2443)=1.648, P < 0.0107, n = 33 to 40 brains/group]. (D) Mean relative VGlut2A-Gal4>STaR signal across neuropil regions in wild-type (gray) and inc2 mutants (green). Two-way repeated-measures ANOVA finds a significant genotype-by-region interaction [F(34,2312) = 5.084, P < 0.0001, n = 33 to 37 brains/group]. (E) Mean normalized Gad1-Gal4>STaR signal segmented by neuropil region in wild-type (gray) and inc2 (blue). Mixed-effects analysis finds a significant genotype-by-region interaction [F(34,2343) = 2.161, P < 0.0001, n = 31 to 40 brains/group]. For (BE), circles show individual data points; data are normalized to the average BRP pixel intensity of wild-type controls. Group averages and error bars depict means ± SEM. Pairwise significance is denoted by bolded and underlined region labels.
Fig. 6.
Fig. 6.
BRP scaling after overnight social pairings. (A) Mean confocal projections of Chat2A-Gal4>STaR brains from male flies that were paired overnight with another male (Left) or with a female fly (Right). (B) Cumulative pixel intensity distribution (Left) and mean regional Chat2A-Gal4>STaR intensity (Right) after overnight male–male (gray) or male–female (red) social pairings. The Kolmogorov–Smirnov test for cumulative distribution plot finds D = 0.0845, n = 3.82 × 10⁸ to 4.02 × 108 pixels/group. Mixed-effects analysis finds a significant condition-by-region interaction [F(36,1317) = 7.030, P < 0.0001, n = 19 to 20 brains/group]. (C) Mean confocal projections of TH-Gal4>STaR male brains following overnight social pairings. Brains from male–male groupings are shown on left, male–female on right. (D) Cumulative pixel distribution (Left) and mean regional intensity (Right) for TH-Gal4>STaR males after overnight male–male (gray) or male–female (orange) pairings. The Kolmogorov–Smirnov test for cumulative distribution plot finds D = 0.0625, n = 4.22 × 10⁸ to 4.42 × 108 pixels/group. Mixed-effects analysis finds a significant main effect of condition [F(1,41) = 8.353, P = 0.0056, n = 21 to 22 brains/group]. (E) Mean confocal projections of vGlut-Gal4>STaR male brains after overnight male–male (Left) or male–female (Right) pairings. (F) Cumulative pixel distribution (Left) and mean regional intensity (Right) for vGlut-Gal4>STaR males after overnight male–male (gray) or male–female (green) pairings. The Kolmogorov–Smirnov test for cumulative distribution plot finds D = 0.1477, n = 3.02 × 10⁸ to 3.62 × 108 pixels/group. Mixed-effects analysis finds a significant main effect of condition [F(1,31) = 16.33, P = 0.0003, n = 15 to 18 brains/group]. (G) Mean confocal projections of Gad1-Gal4>STaR male brains after overnight male–male (Left) or male–female (Right) pairings. (H) Cumulative pixel distribution (Left) and mean regional intensity (Right) for Gad1-Gal4>STaR males after overnight male–male (gray) or male–female (blue) pairings. The Kolmogorov–Smirnov test for cumulative distribution plot finds D = 0.0289, n = 3.62 × 10⁸ to 3.82 × 108 pixels/group. Mixed-effects analysis finds no significant main effect of condition [F(1,35) = 0.005296, P = 0.9424, n = 18 to 19 brains/group]. For Left panels in (B, D, F, and H), dotted lines represent group mean pixel intensity values, and box plots depict quartile ranges with group mean. For regional quantifications in (B, D, F, and H), circles show individual data points; data are normalized to the average BRP pixel intensity of brains from male–male pairs. Group averages and error bars depict means ± SEM. Pairwise significance is denoted by bolded and underlined region labels. See also SI Appendix, Fig. S3 E–H for sleep traces and Movies S12–S15 for animations of mean registered z-stacks from experimental groups.

Similar articles

Cited by

References

    1. Abel T., Havekes R., Saletin J. M., Walker M. P., Sleep, plasticity and memory from molecules to whole-brain networks. Curr. Biol. 23, R774–R788 (2013). - PMC - PubMed
    1. Rasch B., Born J., About sleep’s role in memory. Physiol. Rev. 93, 681–766 (2013). - PMC - PubMed
    1. Tononi G., Cirelli C., Sleep and the price of plasticity: From synaptic and cellular homeostasis to memory consolidation and integration. Neuron 81, 12–34 (2014). - PMC - PubMed
    1. Roffwarg H. P., Muzio J. N., Dement W. C., Ontogenetic development of the human sleep-dream cycle. Science 152, 604–619 (1966). - PubMed
    1. Shaw P. J., Cirelli C., Greenspan R. J., Tononi G., Correlates of sleep and waking in Drosophila melanogaster. Science 287, 1834–1837 (2000). - PubMed

LinkOut - more resources