Applicability of Gene Expression in Saliva as an Alternative to Blood for Biodosimetry and Prediction of Radiation-induced Health Effects
- PMID: 38499035
- PMCID: PMC11587817
- DOI: 10.1667/RADE-23-00176.1
Applicability of Gene Expression in Saliva as an Alternative to Blood for Biodosimetry and Prediction of Radiation-induced Health Effects
Abstract
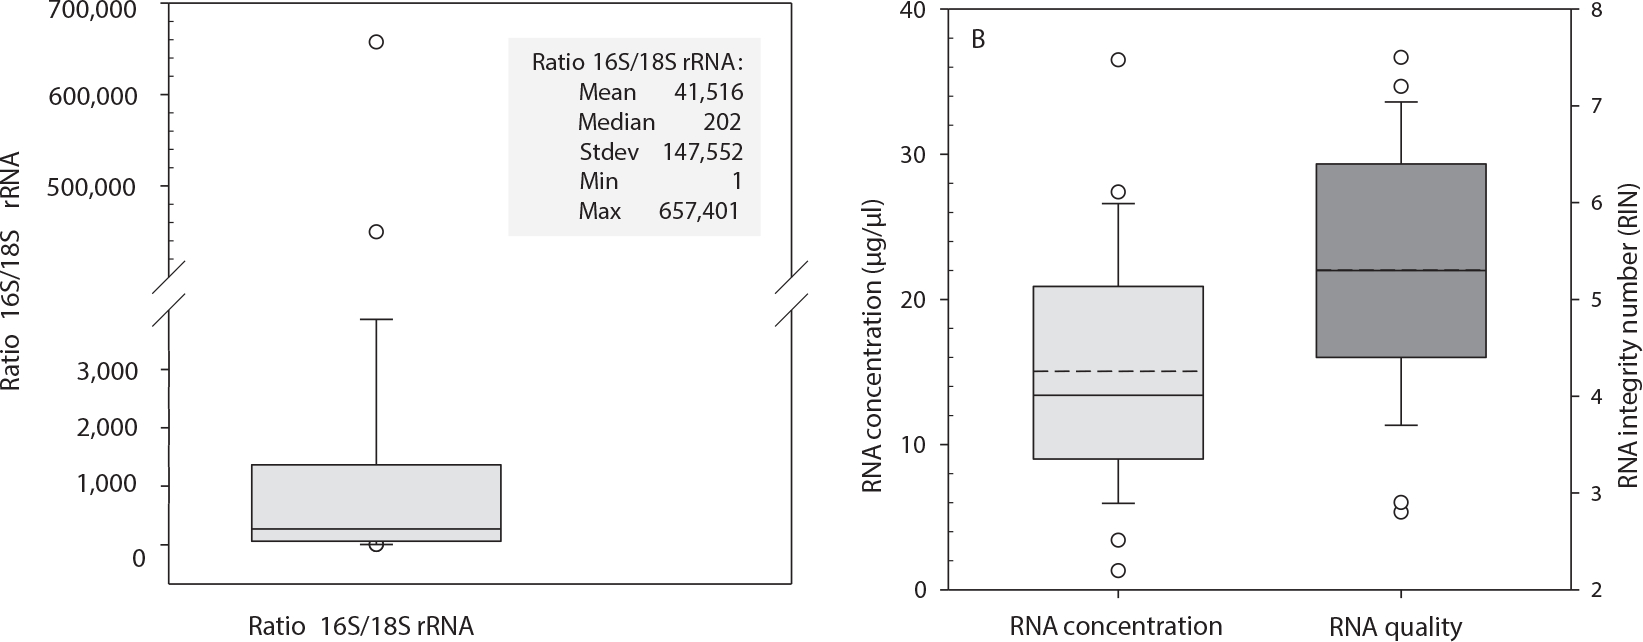
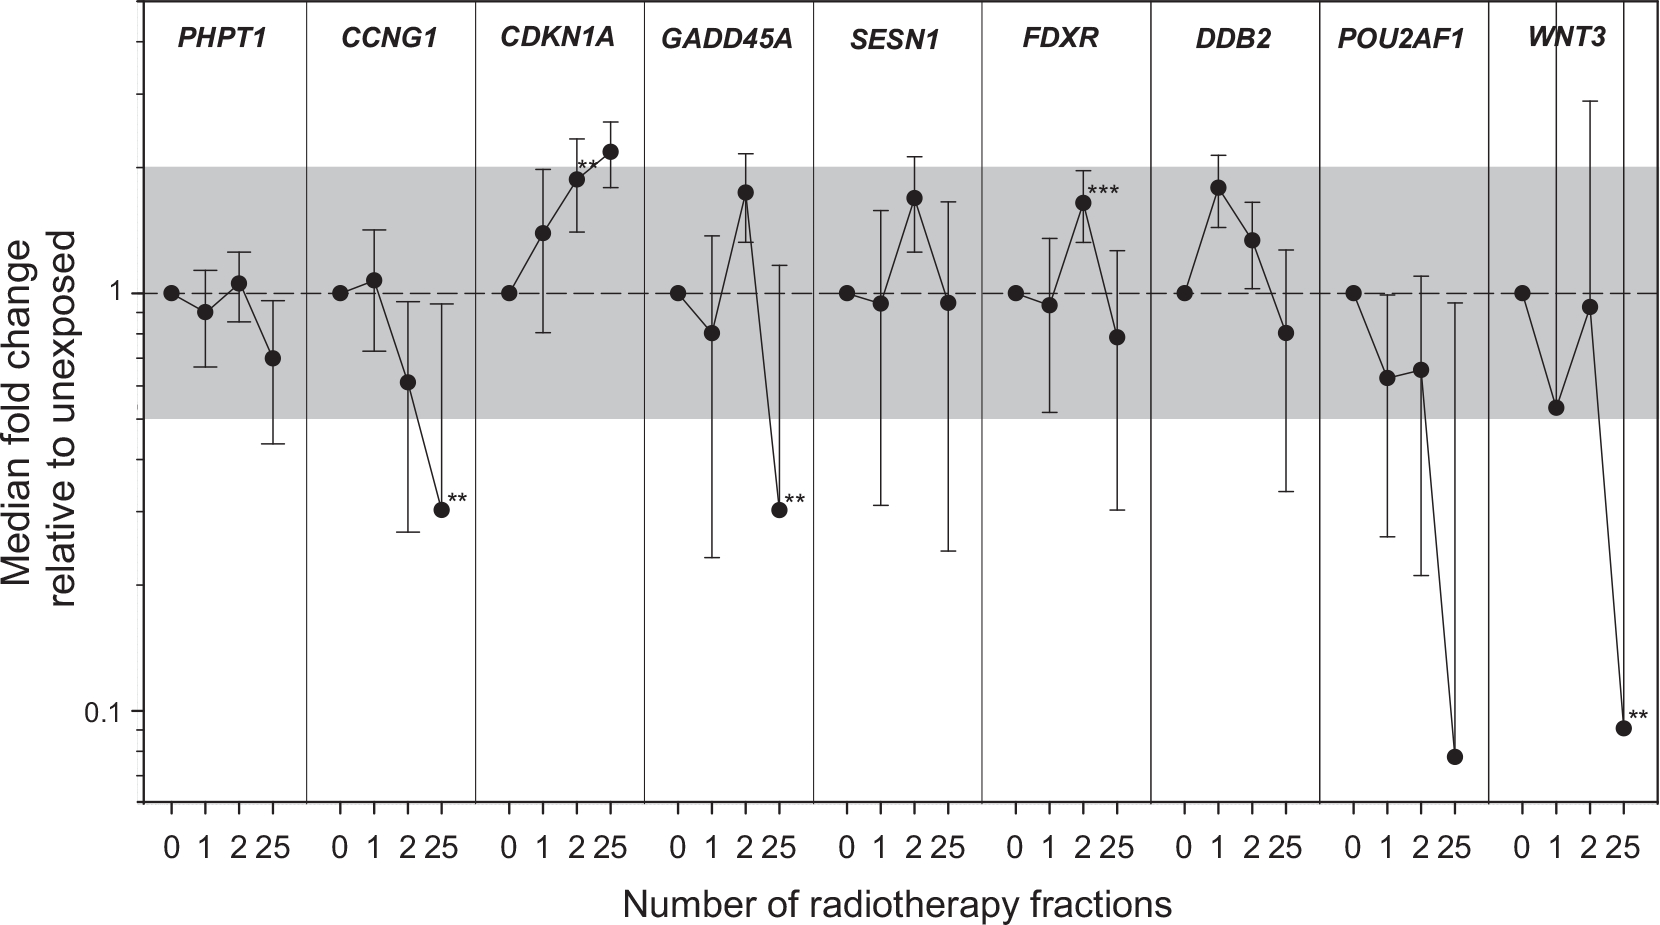
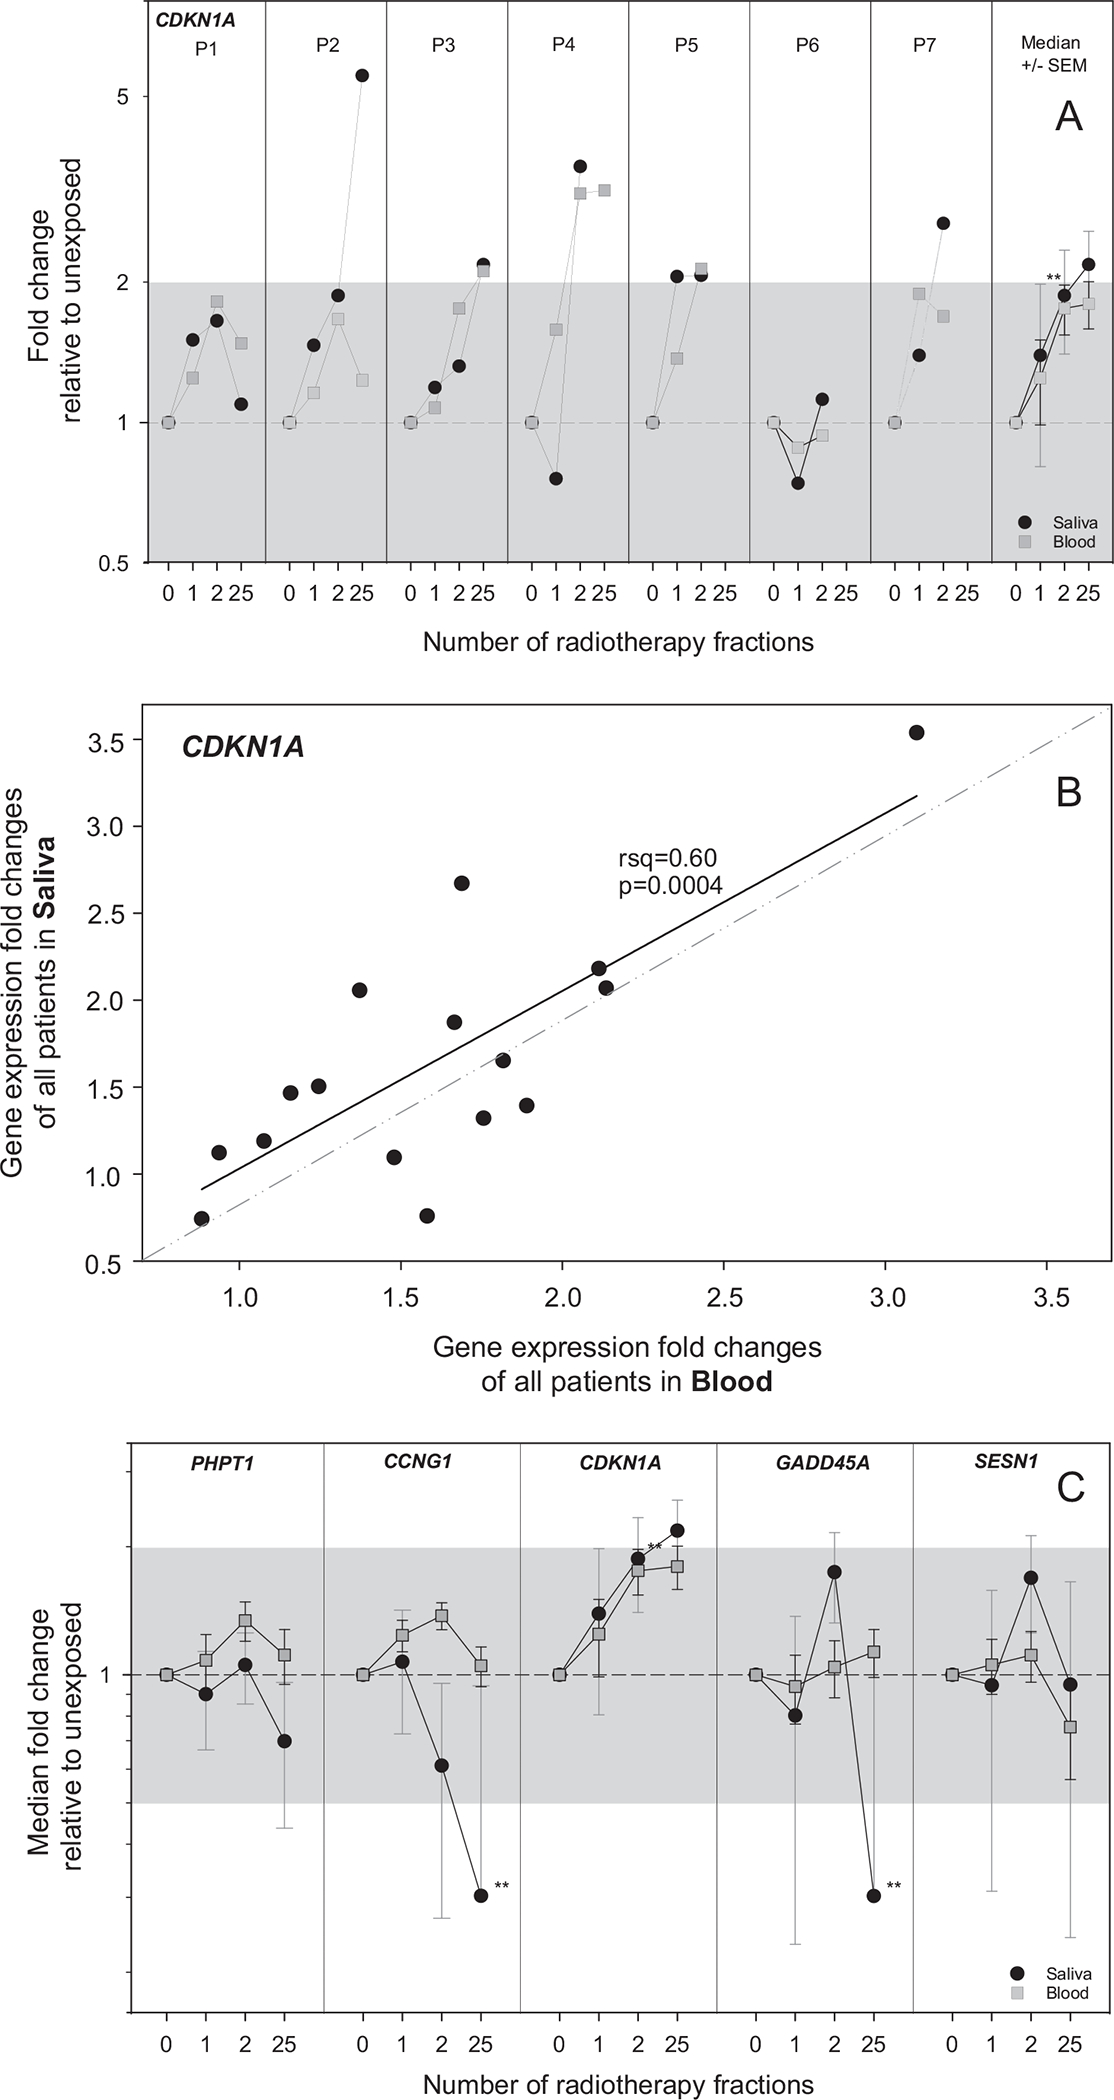
As the great majority of gene expression (GE) biodosimetry studies have been performed using blood as the preferred source of tissue, searching for simple and less-invasive sampling methods is important when considering biodosimetry approaches. Knowing that whole saliva contains an ultrafiltrate of blood and white blood cells, it is expected that the findings in blood can also be found in saliva. This human in vivo study aims to examine radiation-induced GE changes in saliva for biodosimetry purposes and to predict radiation-induced disease, which is yet poorly characterized. Furthermore, we examined whether transcriptional biomarkers in blood can also be found equivalently in saliva. Saliva and blood samples were collected in parallel from radiotherapy (RT) treated patients who suffered from head and neck cancer (n = 8) undergoing fractioned partial-body irradiations (1.8 Gy/fraction and 50-70 Gy total dose). Samples were taken 12-24 h before first irradiation and ideally 24 and 48 h, as well as 5 weeks after radiotherapy onset. Due to the low quality and quantity of isolated RNA samples from one patient, they had to be excluded from further analysis, leaving a total of 24 saliva and 24 blood samples from 7 patients eligible for analysis. Using qRT-PCR, 18S rRNA and 16S rRNA (the ratio being a surrogate for the relative human RNA/bacterial burden), four housekeeping genes and nine mRNAs previously identified as radiation responsive in blood-based studies were detected. Significant GE associations with absorbed dose were found for five genes and after the 2nd radiotherapy fraction, shown by, e.g., the increase of CDKN1A (2.0 fold, P = 0.017) and FDXR (1.9 fold increased, P = 0.002). After the 25th radiotherapy fraction, however, all four genes (FDXR, DDB2, POU2AF1, WNT3) predicting ARS (acute radiation syndrome) severity, as well as further genes (including CCNG1 [median-fold change (FC) = 0.3, P = 0.013], and GADD45A (median-FC = 0.3, P = 0.031)) appeared significantly downregulated (FC = 0.3, P = 0.01-0.03). A significant association of CCNG1, POU2AF1, HPRT1, and WNT3 (P = 0.006-0.04) with acute or late radiotoxicity could be shown before the onset of these clinical outcomes. In an established set of four genes predicting acute health effects in blood, the response in saliva samples was similar to the expected up- (FDXR, DDB2) or downregulation (POU2AF1, WNT3) in blood for up to 71% of the measurements. Comparing GE responses (PHPT1, CCNG1, CDKN1A, GADD45A, SESN1) in saliva and blood samples, there was a significant linear association between saliva and blood response of CDKN1A (R2 = 0.60, P = 0.0004). However, the GE pattern of other genes differed between saliva and blood. In summary, the current human in vivo study, (I) reveals significant radiation-induced GE associations of five transcriptional biomarkers in salivary samples, (II) suggests genes predicting diverse clinical outcomes such as acute and late radiotoxicity as well as ARS severity, and (III) supports the view that blood-based GE response can be reflected in saliva samples, indicating that saliva is a "mirror of the body" for certain but not all genes and, thus, studies for each gene of interest in blood are required for saliva.
©2024 by Radiation Research Society. All rights of reproduction in any form reserved.
Figures
Similar articles
-
Four Genes Predictive for the Severity of Hematological Damage Reveal a Similar Response after X Irradiation and Chemotherapy.Radiat Res. 2023 Feb 1;199(2):115-123. doi: 10.1667/RADE-22-00068.1. Radiat Res. 2023. PMID: 36480042
-
Validation of genes for H-ARS severity prediction in leukemia patients - interspecies comparison, challenges, and promises.Int J Radiat Biol. 2024;100(4):527-540. doi: 10.1080/09553002.2023.2295295. Epub 2024 Jan 16. Int J Radiat Biol. 2024. PMID: 38227483
-
PUM1 and PGK1 are Favorable Housekeeping Genes over Established Biodosimetry-related Housekeeping Genes such as HPRT1, ITFG1, DPM1, MRPS5, 18S rRNA and Others after Radiation Exposure.Radiat Res. 2024 May 1;201(5):487-498. doi: 10.1667/RADE-23-00160.1. Radiat Res. 2024. PMID: 38471523
-
Radiation-Induced Gene Expression Changes Used for Biodosimetry and Clinical Outcome Prediction: Challenges and Promises.Cytogenet Genome Res. 2023;163(3-4):223-230. doi: 10.1159/000530947. Epub 2023 May 12. Cytogenet Genome Res. 2023. PMID: 37231879 Review.
-
Early molecular markers for retrospective biodosimetry and prediction of acute health effects.J Radiol Prot. 2022 Jan 25;42(1). doi: 10.1088/1361-6498/ac2434. J Radiol Prot. 2022. PMID: 34492641 Review.
Cited by
-
Centers for Medical Countermeasures against Radiation Consortium: Past, Present, and Beyond.Radiat Res. 2025 Sep 1;204(3):238-252. doi: 10.1667/RADE-24-00275.1. Radiat Res. 2025. PMID: 40571995 Free PMC article. Review.
References
-
- Chaudhry MA. Biomarkers for human radiation exposure. Vol. 15, J Biomed Sci. 2008. p. 557–63. - PubMed
-
- Ostheim P, Coker O, Sch€ule S, Hermann C, Combs SE, Trott KR, et al. Identifying a diagnostic window for the use of gene expression profiling to predict acute radiation syndrome. Radiat Res. 2021;195(1):38–46. - PubMed
Publication types
MeSH terms
Grants and funding
LinkOut - more resources
Full Text Sources
Research Materials
Miscellaneous