. 2024 Mar 18;7(6):e202302371.
doi: 10.26508/lsa.202302371. Print 2024 Jun.

Generation of marmoset primordial germ cell-like cells under chemically defined conditions

Affiliations

Generation of marmoset primordial germ cell-like cells under chemically defined conditions

Julia Kurlovich et al. Life Sci Alliance. .

Abstract

Primordial germ cells (PGCs) are the embryonic precursors of sperm and oocytes, which transmit genetic/epigenetic information across generations. Mouse PGC and subsequent gamete development can be fully reconstituted in vitro, opening up new avenues for germ cell studies in biomedical research. However, PGCs show molecular differences between rodents and humans. Therefore, to establish an in vitro system that is closely related to humans, we studied PGC development in vivo and in vitro in the common marmoset monkey Callithrix jacchus (cj). Gonadal cjPGCs at embryonic day 74 express SOX17, AP2Ɣ, BLIMP1, NANOG, and OCT4A, which is reminiscent of human PGCs. We established transgene-free induced pluripotent stem cell (cjiPSC) lines from foetal and postnatal fibroblasts. These cjiPSCs, cultured in defined and feeder-free conditions, can be differentiated into precursors of mesendoderm and subsequently into cjPGC-like cells (cjPGCLCs) with a transcriptome similar to human PGCs/PGCLCs. Our results not only pave the way for studying PGC development in a non-human primate in vitro under experimentally controlled conditions, but also provide the opportunity to derive functional marmoset gametes in future studies.


Conflict of interest statement

The authors declare that they have no conflict of interest.

Figures
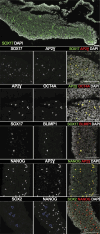
Figure 1.
Figure 1.. cjPGCs at E74 show an expression profile similar to hPGCs.
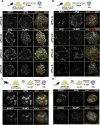
Immunofluorescence images of marmoset E74 genital ridge sections, which were stained for SOX17, AP2Ɣ, OCT4A, NANOG, BLIMP, and SOX2. Top three rows: genital ridges isolated from embryo 1; bottom three rows: genital ridges isolated from embryo 2. Top row: scale bar, 50 μm. Other rows: scale bars, 100 μm.
Figure 2.
Figure 2.. Derivation and characterisation of cjiPSCs.
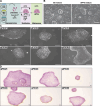
(A) Overview of cjiPSC derivation by reprogramming of fibroblasts. Culture conditions for cjiPSC stabilisation and maintenance conditions are depicted. (B) Brightfield images of foetal fibroblast primary culture 30d after transfection with reprogramming plasmids maintained in E8 medium (left) or Universal Primate Pluripotent Stem Cell medium (right). (C) Brightfield images of cjiPSC colonies (DPZ_cjiPSC#1-6) maintained in Universal Primate Pluripotent Stem Cell medium. (D) Alkaline phosphatase staining of cjiPSC colonies (DPZ_cjiPSC#1-6). Scale bars, 100 μm.
Figure 3.
Figure 3.. Reprogrammed cjiPSC lines are transgene-free and express pluripotency markers.
(A) Agarose gel electrophoresis of PCR products. Two different primer combinations (WPRE and EBV), specific for two different regions conserved between the three episomes, were used to confirm the absence of reprogramming plasmids on the genomic DNA of the different cell populations. Episomes (pCXLE-hOCT3/4-shp53, pCXLE-hSK, and pCXLE-hUL) were used as a positive control, and fibroblasts and water as biological and technical negative controls, respectively. (B) Agarose gel electrophoresis of RT–qPCR-amplified products using the primers for OCT4A, KLF4, c-MYC, and ACTB. cDNAs of DPZ_cjiPSC#1-6 were analysed, and fibroblast cDNA was used as a control. (C) Immunofluorescence images of cjiPSCs (DPZ_cjiPSC#1, DPZ_cjiPSC#2, DPZ_cjiPSC#3, and DPZ_cjiPSC#5) stained for OCT4, LIN28, NANOG, SOX2, TRA-1-81, and TRA-1-60. (D) Immunofluorescence images of sections of cell aggregates formed by differentiated cjiPSC lines (DPZ_cjiPSC#1, DPZ_cjiPSC#2, DPZ_cjiPSC#3, and DPZ_cjiPSC#5). Sections were stained for β-Tub-III, AFP, and SMA. Scale bars, 20 μm.
Figure S1.
Figure S1.. Differentiation of PGCLCs from cjiPSCs in modified Universal Primate Pluripotent Stem Cell or E8 medium and cyESCs in E8 medium.
(A, B) EBs were generated by direct induction from cjiPSCs (DPZ_cjiPSC#2, DPZ_cjiPSC#3, and DPZ_cjiPSC#5) cultured in modified Universal Primate Pluripotent Stem Cell medium. Immunofluorescence images of d2 (A) or d6 (B) EB sections stained for SOX17, AP2Ɣ, and BLIMP1. (C, D) Cynomolgus monkey (cy) iPSCs (C) or cjiPSCs (D) cultured in E8 medium on feeder cells were pre-induced into pre-ME, followed by PGCLC induction. Immunofluorescence images of d4 EB sections stained for SOX17, AP2Ɣ, BLIMP1, and NANOG. Scale bars, 100 μm.
Figure S2.
Figure S2.. cjiPSCs in TESR medium do not give rise to cjPGCLCs.
(A) Immunofluorescence images of cjiPSCs cultured in TESR medium stained for OCT4. (B, C) Human (h) iPSCs (B) or cjiPSCs (C) cultured in TESR medium were pre-induced towards pre-ME followed by PGCLC differentiation. Immunofluorescence images of d4 EB sections stained for SOX17, AP2Ɣ, BLIMP1, and NANOG. Scale bar, 20 μm (A). Scale bars, 100 μm (B, C).
Figure S3.
Figure S3.. cjiPSCs maintained in cjPSCM down-regulate various lineage-associated genes.
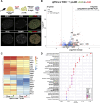
(A) Immunofluorescence images of cjiPSCs maintained in cjPSCM stained for OCT4, LIN28, and TRA-1-60. (B) GO classification of genes differentially down-regulated (based on RNA-seq data) in cjiPSCs cultured in cjPSCM in comparison with TESR medium. n = 2 biological independent experiments. (C) Principal component analysis with a defined set of pluripotency-associated genes using RNA-seq datasets for cjiPSCs cultured in TESR or cjPSCM compared with published datasets for hESCs cultured in naïve (E-MTAB-5114), formative (GSE131556), expanded (hEPSCs, E-MTAB-7253), and primed (E-MTAB-7253) pluripotent conditions. (D) EBs were differentiated from cjiPSCs cultured in cjPSCM and further induced into pre-ME followed by cjPGCLC induction. Immunofluorescence images of d6 EB sections stained for SOX17, FOXA2, and AP2Ɣ. Scale bar, 20 μm (A). Scale bar, 100 μm (C).
Figure 4.
Figure 4.. cjiPSCs cultured in cjPSCM express naïve, formative, and primed pluripotency markers.
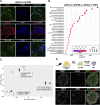
(A) Volcano plot shows differential gene expression analysis of RNA-seq data for cjiPSCs cultured in cjPSCM compared with cjiPSCs in TESR medium. n = 2 biological independent replicates. (B) Heatmap showing expression levels of indicated genes using RNA-seq datasets for cjiPSCs cultured in TESR or cjPSCM compared with published datasets for hESCs cultured in naïve (E-MTAB-5114), formative (GSE131556), expanded (hEPSCs, E-MTAB-7253), and primed (E-MTAB-7253) pluripotent conditions. Scale: log2(normalised counts + 1); r, replicate; MESO, mesoderm marker.
Figure 5.
Figure 5.. cjiPSCs cultured in cjPSCM give rise to cjPGCLCs.
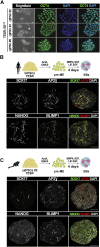
(A, B) Differentiation of cjiPSCs in cjPSCM into pre-ME, induced either with ActA (A) or without ActA (B), which was followed by cjPGCLC induction. IF images of resulting d4 EB sections stained for SOX17, AP2Ɣ, BLIMP1, and NANOG. Scale bars, 100 μm.
Figure S4.
Figure S4.. Induction of cjPGCLCs from DPZ_cjiPSC#3 and DPZ_cjiPSC#5.
(A, B) Differentiation of DPZ_cjiPSC#3 or DPZ_cjiPSC#5 in cjPSCM into pre-ME, induced either with ActA (A) or without ActA (B), which was followed by cjPGCLC induction. IF images of resulting d4 EB sections stained for SOX17 and BLIMP1. Scale bar, 100 μm.
Figure S5.
Figure S5.. Differentiation of cjiPSCs maintained in TESR medium.
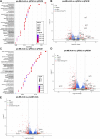
(A) cjiPSCs cultured in TESR medium were pre-induced towards pre-ME without ActA (−ActA), followed by cjPGCLC differentiation. Immunofluorescence images of day 4 (d4) EB sections stained for SOX17, AP2Ɣ, and BLIMP1. Scale bars, 100 μm. (B) Volcano plot shows differential gene expression analysis of RNA-seq datasets of pre-ME differentiated with or without ActA (+/−ActA) from cjiPSCs cultured in TESR medium. n = 2 biological independent experiments. (C) Heatmap showing expression levels of genes associated with mesoderm development in pre-ME. r, replicate. (D) GO term enrichment for genes significantly up-regulated in pre-ME − ActA compared with pre-ME + ActA.
Figure 6.
Figure 6.. cjPGCLCs up-regulate genes associated with the PGC fate.
(A) Representative FACS analysis of d4 EBs: unstained control (orange), single-stained CXCR4 (blue), or INTα6 (red) control. (B, C) FACS analysis of d4 EBs stained for INTα6 and CXCR4. EBs were differentiated from cjiPSCs cultured in cjPSCM and further induced into pre-ME with Act A (pre-ME + ActA) (B) or without Act A (pre-ME − ActA) (C), which was followed by cjPGCLC induction. The number in % indicates INTα6/CXCR4 double-positive cells. (D) cjiPSCs in cjPSCM were differentiated into pre-ME with (+) or without (−) ActA, which were subsequently induced into cjPGCLCs. Heatmap shows relative gene expression levels based on RNA-seq data of indicated genes for sorted cjPGCLCs (INTα6/CXCR4 double-positive) and somatic cells (INTα6/CXCR4 double-negative). n = 2 biological independent replicates. (E) Expression levels (log2(normalised counts + 1)) of indicated genes during differentiation.
Figure S6.
Figure S6.. Transcriptomic analysis of pre-ME induced from cjiPSCs in cjPSCM with or without ActA.
(A) GO classification of genes differentially up-regulated (based on RNA-seq data) in pre-ME induced with Act A (pre-ME + ActA) as compared to cjiPSCs in cjPSCM. (B) Volcano plot of differentially expressed genes in pre-ME induced with ActA as compared to cjiPSCs in cjPSCM. (C) GO classification of differentially up-regulated genes in pre-ME induced without ActA (pre-ME − ActA). (D) Volcano plot of differentially expressed genes in pre-ME induced without ActA as compared to cjiPSCs in cjPSCM. (E) Volcano plot of differentially expressed genes in pre-ME induced without ActA as compared to pre-ME induced with ActA.
Figure S7.
Figure S7.. Expression profile of genes associated with pluripotency in pre-ME.
Heatmap showing expression levels of genes associated with naïve and primed pluripotency. RNA-seq datasets are from primed hESCs (GSE159654), human pre-ME ((h)pre-ME, GSE159654), cjiPSCs, and marmoset pre-ME ((cj)pre-ME). Scale: log2(normalised counts + 1).
Figure 7.
Figure 7.. Transcriptional programme of mPGCLCs, cjPGCLCs, and hPGCLCs.
(A) Pearson’s correlation of RNA-seq datasets for d4 cjPGCLCs induced from pre-ME (+/−ActA) and published data for d4/d6 mPGCLCs (GSE67259) and d4 hPGCLCs (GSE159654). (B) Heatmap showing expression levels of genes associated with PGC development in d4 cjPGCLCs, d4/d6 mPGCLCs, d4 hPGCLCs, and hPGCs (week 7, GSE159654). Scale: log2(normalised counts + 1), r = replicate.
Figure S8.
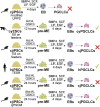
Figure S8.. Schematic representation of PGCLC differentiation approaches used in this study.
Shown are culture conditions and differentiation approaches to induce PGCLCs from cjiPSCs, cyESCs, or hiPSCs cultured in indicated conditions in this study.

Similar articles

Cited by

References

    1. Alves-Lopes JP, Wong FCK, Tang WWC, Gruhn WH, Ramakrishna NB, Jowett GM, Jahnukainen K, Surani MA (2023) Specification of human germ cell fate with enhanced progression capability supported by hindgut organoids. Cell Rep 42: 111907. 10.1016/j.celrep.2022.111907 - DOI - PubMed
    1. Anders S, Pyl PT, Huber W (2015) HTSeq--a Python framework to work with high-throughput sequencing data. Bioinformatics 31: 166–169. 10.1093/bioinformatics/btu638 - DOI - PMC - PubMed
    1. Aramaki S, Hayashi K, Kurimoto K, Ohta H, Yabuta Y, Iwanari H, Mochizuki Y, Hamakubo T, Kato Y, Shirahige K, et al. (2013) A mesodermal factor, T, specifies mouse germ cell fate by directly activating germline determinants. Dev Cell 27: 516–529. 10.1016/j.devcel.2013.11.001 - DOI - PubMed
    1. Beattie GM, Lopez AD, Bucay N, Hinton A, Firpo MT, King CC, Hayek A (2005) Activin A maintains pluripotency of human embryonic stem cells in the absence of feeder layers. Stem Cells 23: 489–495. 10.1634/stemcells.2004-0279 - DOI - PubMed
    1. Bergmann S, Penfold CA, Slatery E, Siriwardena D, Drummer C, Clark S, Strawbridge SE, Kishimoto K, Vickers A, Tewary M, et al. (2022) Spatial profiling of early primate gastrulation in utero. Nature 609: 136–143. 10.1038/s41586-022-04953-1 - DOI - PMC - PubMed