. 2024 Jul;57(7):e13614.
doi: 10.1111/cpr.13614. Epub 2024 Mar 18.

Decoding human in vitro terminal erythropoiesis originating from umbilical cord blood mononuclear cells and pluripotent stem cells

Affiliations

Decoding human in vitro terminal erythropoiesis originating from umbilical cord blood mononuclear cells and pluripotent stem cells

Xiaoling Wang et al. Cell Prolif. 2024 Jul.

Abstract

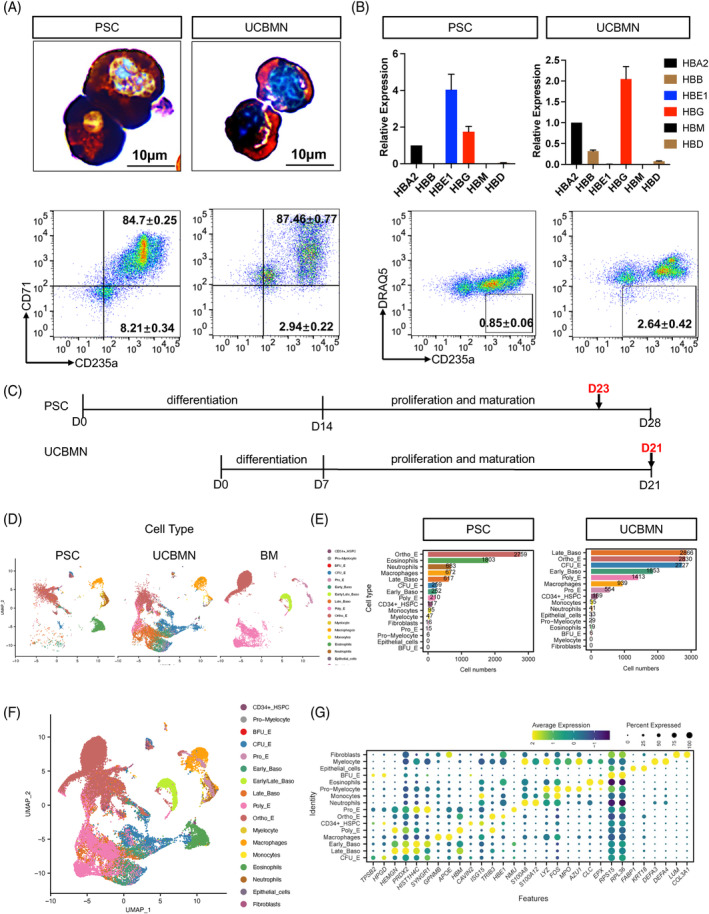
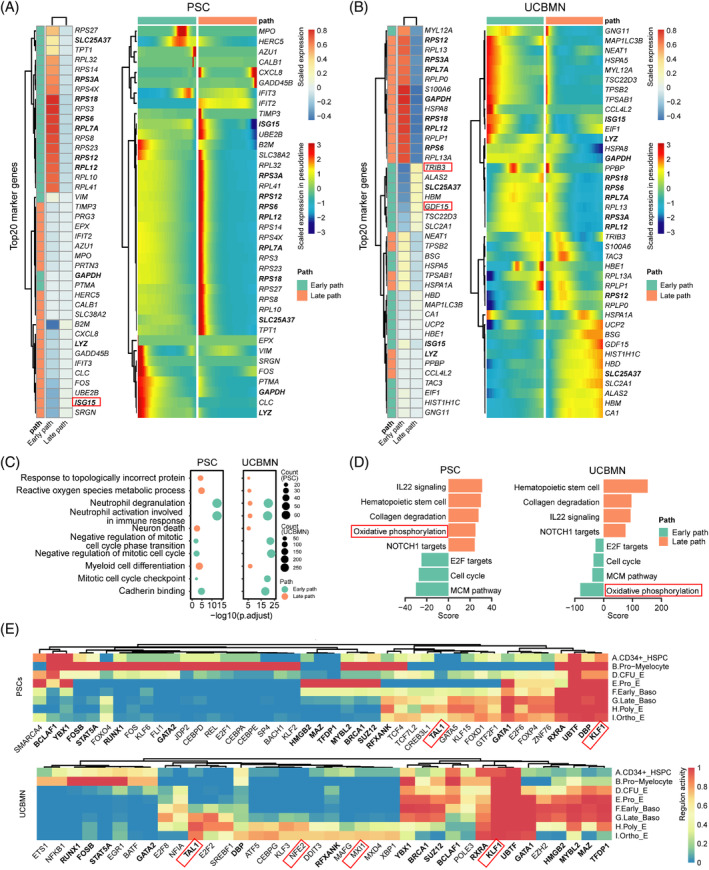
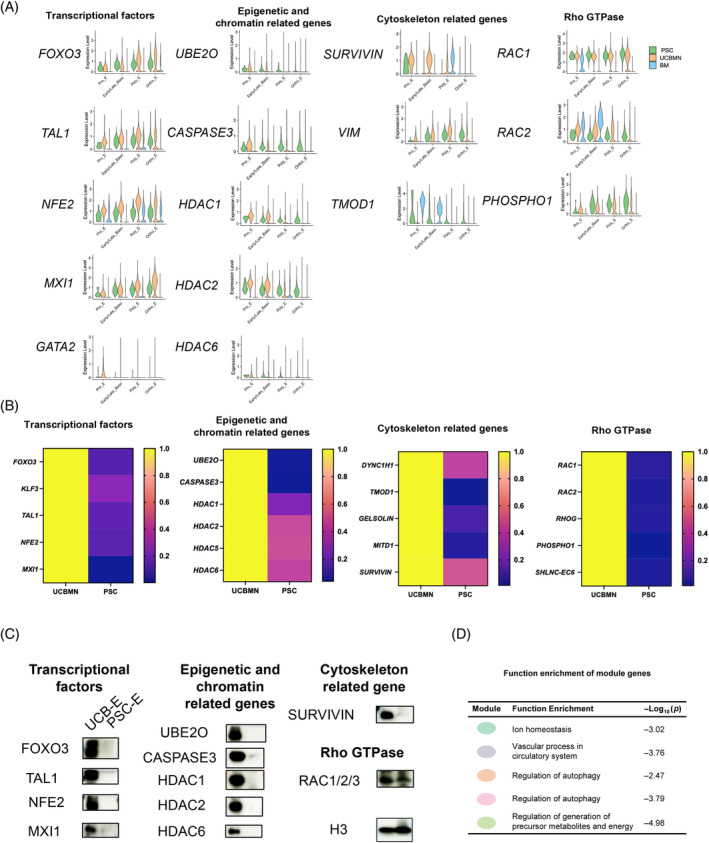
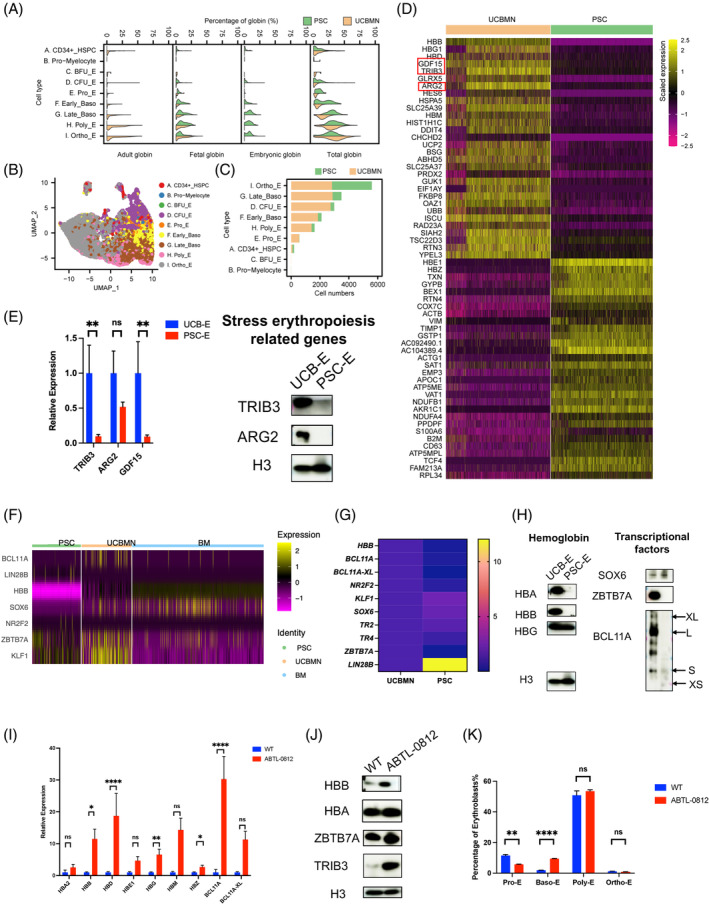
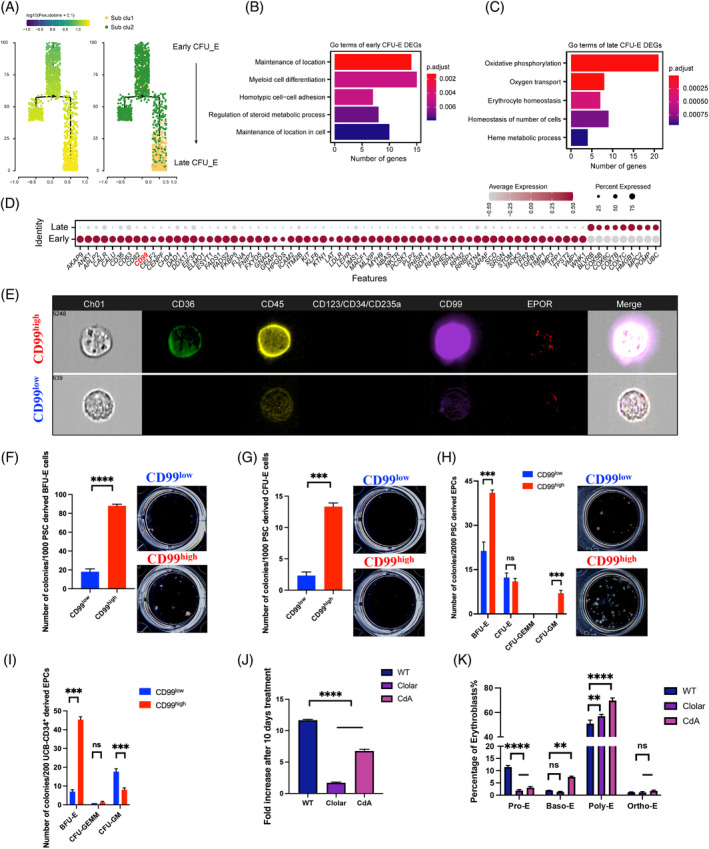
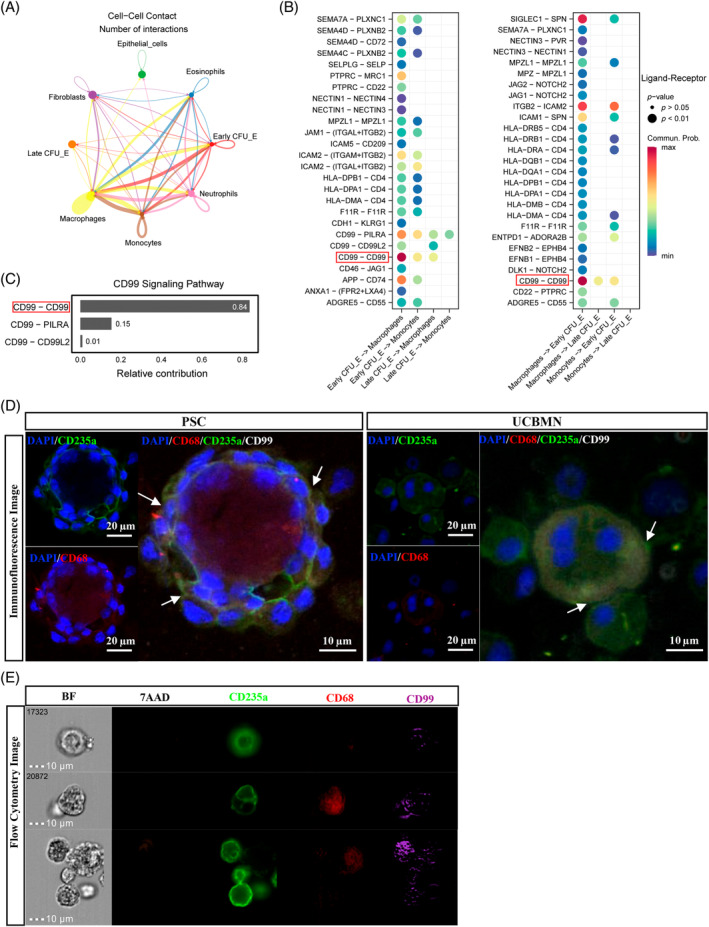
Ex vivo red blood cell (RBC) production generates unsatisfactory erythroid cells. A deep exploration into terminally differentiated cells is required to understand the impairments for RBC generation and the underlying mechanisms. Here, we mapped an atlas of terminally differentiated cells from umbilical cord blood mononuclear cells (UCBMN) and pluripotent stem cells (PSC) and observed their dynamic regulation of erythropoiesis at single-cell resolution. Interestingly, we detected a few progenitor cells and non-erythroid cells from both origins. In PSC-derived erythropoiesis (PSCE), the expression of haemoglobin switch regulators (BCL11A and ZBTB7A) were significantly absent, which could be the restraint for its adult globin expression. We also found that PSCE were less active in stress erythropoiesis than in UCBMN-derived erythropoiesis (UCBE), and explored an agonist of stress erythropoiesis gene, TRIB3, could enhance the expression of adult globin in PSCE. Compared with UCBE, there was a lower expression of epigenetic-related proteins (e.g., CASPASE 3 and UBE2O) and transcription factors (e.g., FOXO3 and TAL1) in PSCE, which might restrict PSCE's enucleation. Moreover, we characterized a subpopulation with high proliferation capacity marked by CD99high in colony-forming unit-erythroid cells. Inhibition of CD99 reduced the proliferation of PSC-derived cells and facilitated erythroid maturation. Furthermore, CD99-CD99 mediated the interaction between macrophages and erythroid cells, illustrating a mechanism by which macrophages participate in erythropoiesis. This study provided a reference for improving ex vivo RBC generation.


Conflict of interest statement

The authors declare no competing financial interests.

Figures

FIGURE 1
FIGURE 1
Atlas of pluripotent stem cells (PSC)‐ and umbilical cord blood mononuclear cells (UCBMN)‐derived terminal differentiated cells. (A) Characterization of sequencing samples by Benzidine and Giemsa staining (upper panels) and flow cytometry analysis on CD71/CD235a (lower panels). (B) Comparison of haemoglobin type in sequencing samples by RT–qPCR (upper panels) and flow cytometry analysis on DRAQ5/CD235a (lower panels). Haemoglobin expression were relative to 18S rRNA. The CD235a+DRAQ5 cells represent the denucleated cells. (C) Sequencing timepoints of UCBMN‐derived erythropoiesis and PSC‐derived erythropoiesis (PSC‐E) were shown in the schematic diagram. (D) Single cell UMAP plots showing the location of each cell type in samples derived from PSC (left), UCBMN (middle) and BM (right), respectively. (E) Bar plots showing the numbers of each cell type in samples derived from PSC (left) and UCBMN (right), respectively. (F) Single cell UMAP plot of PSC‐E (D23), UCB‐ (D21) and BM sample (GSE150774). Seventeen cell types were indicated by colours. (G) Dot plot showing the expression levels of top two signature genes (ordered by averaged log2 fold change, p value < 0.05) in each cell type. Colours indicate the scaled average expression of signature genes. Dot sizes indicate the percentage of cells which express the signature genes in each cell type cluster. BFU‐E, burst‐forming unit‐erythroid; CFU‐E, colony‐forming unit‐erythroid; Ortho‐E, orthochromatic erythroblasts; Poly‐E, polychromatic erythroblasts; Pro‐E, pro‐erythroblast.
FIGURE 2
FIGURE 2
Regulatory dynamics of umbilical cord blood mononuclear cells (UCBMN)‐ and pluripotent stem cells (PSC)‐derived erythropoiesis. (A, B) Heatmap plots are representing the average scaled expression levels (left) and the pseudo‐time expression levels (right) of the top 20 marker genes (ordered by averaged log2 fold change, p value < 0.05) between the early and late paths in PSC (B) and UCBMN (B) derived progenitors and erythroid cells. (C) Dot plot showing GO annotation of PSC (left) and UCBMN (right) derived cells in the early and late paths. (D) The Bar plot is showing GSVA enrichment scores of PSC (left) and UCBMN (right) derived cells in the early and late paths. (E) Heatmap showing active regulon scores for terminal erythroid cell type from UCBMN and PSC origin. CFU‐E, colony‐forming unit‐erythroid; Ortho‐E, orthochromatic erythroblasts; Poly‐E, polychromatic erythroblasts; Pro‐E, pro‐erythroblast.
FIGURE 3
FIGURE 3
Comparison of canonical enucleation‐related gene expression in two source‐derived cells. (A) Violin plot showing enucleation‐related gene expression in erythroid cells derived from pluripotent stem cells (PSC), umbilical cord blood mononuclear cells (UCBMN) and BM at single cell transcriptional level. (B) Heatmap showing enucleation‐related gene expression in erythroid cells derived from UCBMN and PSC. RT–qPCR was performed on D21 and D28 of UCBMN and PSC. Gene expression was related to 18S rRNA. (C) Western blot assay for enucleation‐related protein in erythroid cells derived from UCBMN (Day 21) and PSC (Day 28) origin. Histone H3 served as a reference for protein expression in different samples. (D) Functional enrichment analysis of enucleation‐related TFs NFE2, KLF3, MXI1, and TAL1 and their target genes. Ortho‐E, orthochromatic erythroblasts; Poly‐E, polychromatic erythroblasts; Pro‐E, pro‐erythroblast; PSC‐E, PSC‐derived erythropoiesis; UCB‐E, UCBMN‐derived erythropoiesis.
FIGURE 4
FIGURE 4
Profiling comparison of haemoglobin expression and the difference in stress erythropoiesis between umbilical cord blood mononuclear cells (UCBMN) and pluripotent stem cells (PSC) origin. (A) Violin plot showing % of adult, fetal, embryonic and total globin for PSC‐derived (green) and UCBMN‐derived (yellow) progenitors and erythroid cells. (B) UMAP atlas of PSC‐ and UCBMN‐derived progenitors and erythroid cells, respectively. Labels indicate cell type annotations performed by SingleR. (C) Bar plot showing numbers of each cell type in A and proportions of cells of UCBMN and PSC origin (different colours). (D) Heatmap showing scaled average expression of top 30 most variable differentially expressed genes (in order of log2 FC) in PSC‐ and UCBMN‐derived orthochromatic erythroblasts (Ortho‐E). (E) RT‐qPCR and western blot for the mRNA and protein expressions of stress erythropoiesis related genes. 18S rRNA and histone H3 served as a standard for gene transcription and protein translational level in different samples. **p < 0.01. (F) Heatmap showing the difference of haemoglobin switching related gene expression between erythroid cells derived from PSC, UCBMN, and BM origin in sc‐RNA level. (G) RT‐qPCR for the mRNA expressions of fetal‐adult globin switch related genes of UCBMN and PSC generated cells at 21 and 28 days (n = 3). 18S rRNA served as a standard for gene transcription level in different samples. (H) Western blot assay for HBB, HBA, HBG, and haemoglobin switching related proteins in erythroid cells derived from UCBMN and PSC origin. Histone H3 as a standard for protein expression in different samples. (I) RT‐qPCR for the relative mRNA expressions of hemoglobin and globin switch related genes in control (blue) and ABTL‐0812 (red) treat group. PSC derived erythroid cells were treated with 10 µg/mL TRIB3 agonist ABTL‐0812 from D14 to D28. *p < 0.05, **p < 0.01, ****p < 0.0001. 18S rRNA as a standard for gene transcription level in different samples. (J) Western blot assay for HBB, HBA, ZBTB7A and TRIB3 in control and ABTL‐0812 treated group. Histone H3 served as a standard for protein expression in different samples. (K) The cell population of erythroblast were tested by flow assay in the control and ABTL‐0812 treat group. **p < 0.01, ****p < 0.0001. BFU‐E, burst‐forming unit‐erythroid; CFU‐E, colony‐forming unit‐erythroid; Poly‐E, polychromatic erythroblasts; Pro‐E, pro‐erythroblast; PSC‐E, PSC‐derived erythropoiesis; UCB‐E, UCBMN‐derived erythropoiesis.
FIGURE 5
FIGURE 5
CD99high population generates more erythroid progenitors than the CD99low population. (A) Developmental pseudo‐time trajectory of colony‐forming unit‐erythroid (CFU‐E) cells labelled by pseudo‐time scores (left) and CFU‐E subsets (right). The arrow indicates the direction of differentiation. (B, C) Bar plot representing GO term enrichment results for differentially expressed genes (DEGs) between early (B) and late (C) CFU‐E subsets. Bar colours indicate adjusted p‐values of GO terms. (D) Dot plot showing membrane‐encoding DEGs between early and late CFU‐E cells. Colours indicate scaled average gene expression levels. Dot size indicates % of cells expressing genes in early and late CFU‐E subsets. Membrane‐encoding genes were obtained from UniProt under the keywords membrane protein AND organism: “Homo sapiens (Human) [9606],” then overlapped the DEGs between early and late CFU‐E cells to achieve the genes list as presented. Candidate marker gene CD99 were marked as red. (E) Image flow analysis of CD99 expression in UCB‐generated CFU‐E (CD235aCD123CD71+CD34CD36+) cells. The image of cells was captured by Amnis ImageStreamX. (F–H) Bar plot of numbers and representative pictures of colonies formed by pluripotent stem cells (PSC)‐derived burst‐forming unit‐erythroid (BFU‐E) (F) CFU‐E (G) and CD71+CD235a erythroid progenitor cells (EPCs) (H) subpopulations in H4636 medium (n = 3). ***p < 0.001, ****p < 0.0001. (I) Bar plot of numbers and representative pictures of colonies formed by UCB‐CD34+ cells derived EPC subpopulations in H4434 medium (n = 4). ***p < 0.001. (J) Bar plotting the fold change of erythroblasts after PSC derived cells were treated with antagonist of CD99. PSC derived cells were treated with antagonist of CD99, 0.3 µM Clolar and 0.2 µM 2‐CdA, from D14 (n = 3). ****p < 0.0001. (K) Bar plot showing flow cytometry analyzed erythroblast after CD99 antagonist treatment of PSC‐derived cells (CD235a+CD49dhiBand3neg Pro‐E, CD235a+CD49dhiBand3low Baso‐E, CD235a+CD49dhiBand3med Poly‐E, CD235a+CD49dmed Band3med Ortho‐E) **p < 0.01, ****p < 0.0001. Ortho‐E, orthochromatic erythroblasts; Poly‐E, polychromatic erythroblasts; Pro‐E, pro‐erythroblast.
FIGURE 6
FIGURE 6
Macrophage contacts erythroid cells during terminal erythropoiesis ex vivo. (A) The cell–cell communication network showing the number of interactions between two cell groups at cell–cell contact pattern. (B) The dot plot showing the significant ligand‐receptor pairs from the early and the late colony‐forming unit‐erythroid (CFU‐E) cells to macrophages and monocytes (left), and from macrophages and monocytes to the early and the late CFU‐E cell at cell–cell contact pattern (right). Dot size represents the statistical significance of ligand‐receptor pairs, and colour represents the communication probability of ligand‐receptor pairs. (C) The bar plot showing the relative contribution of each ligand‐receptor pair to the overall CD99 signalling pathway. (D) Representative immunofluorescence images showing expression of CD99 in pluripotent stem cells (PSC) and umbilical cord blood mononuclear cells (UCBMN)‐derived macrophage and erythroid cells. PSC‐derived cells on D23 and UCBMN‐derived cells on D21 were fixed and stained as indicated in the methods section. Images were captured by using 20× and fluorescent filters optimized for observing DAPI‐stained nuclei (blue), 647‐labelled CD99 (white), 488‐labelled CD235a (green) and 568‐labelled CD68 (red). White arrows indicate CD99 expression on the contact area between macrophages and erythroid cells. Images obtained from the same field with different filters were merged. Scale bar = 10 μm. (E) Image flow analysis of CD99 expression on PSC‐derived macrophage and erythroid cells. Image of cells was captured by using 20× and fluorescent filters of Amnis ImageStreamX for observing 7AAD‐stained nuclei (super red), BV421‐labelled CD99 (purple), FITC‐labelled CD235a (green) and APC‐labelled CD68 (red). Scale bar = 10 μm.

Similar articles

Cited by

References

    1. Olivier EN, Marenah L, McCahill A, Condie A, Cowan S, Mountford JC. High‐efficiency serum‐free feeder‐free erythroid differentiation of human pluripotent stem cells using small molecules. Stem Cells Transl Med. 2016;5(10):1394‐1405. - PMC - PubMed
    1. Wang L, Guan X, Wang H, et al. A small‐molecule/cytokine combination enhances hematopoietic stem cell proliferation via inhibition of cell differentiation. Stem Cell Res Ther. 2017;8(1):169. - PMC - PubMed
    1. Rallapalli S, Guhathakurta S, Narayan S, Bishi DK, Balasubramanian V, Korrapati PS. Generation of clinical‐grade red blood cells from human umbilical cord blood mononuclear cells. Cell Tissue Res. 2019;375(2):437‐449. - PubMed
    1. Wang S, Zhao H, Zhang H, et al. Analyses of erythropoiesis from embryonic stem cell‐CD34(+) and cord blood‐CD34(+) cells reveal mechanisms for defective expansion and enucleation of embryomic stem cell‐erythroid cells. J Cell Mol Med. 2022;26(8):2404‐2416. - PMC - PubMed
    1. Jacobsen SEW, Nerlov C. Haematopoiesis in the era of advanced single‐cell technologies. Nat Cell Biol. 2019;21(1):2‐8. - PubMed