. 2024 Jan 22;25(2):bbae054.
doi: 10.1093/bib/bbae054.

Multiscale topology in interactomic network: from transcriptome to antiaddiction drug repurposing

Affiliations

Multiscale topology in interactomic network: from transcriptome to antiaddiction drug repurposing

Hongyan Du et al. Brief Bioinform. .

Abstract

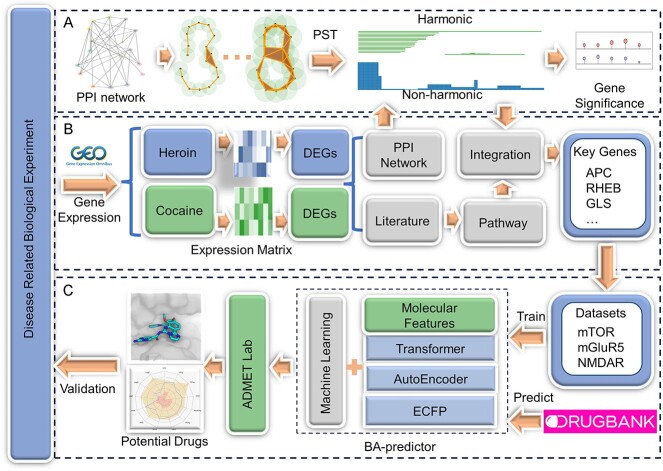
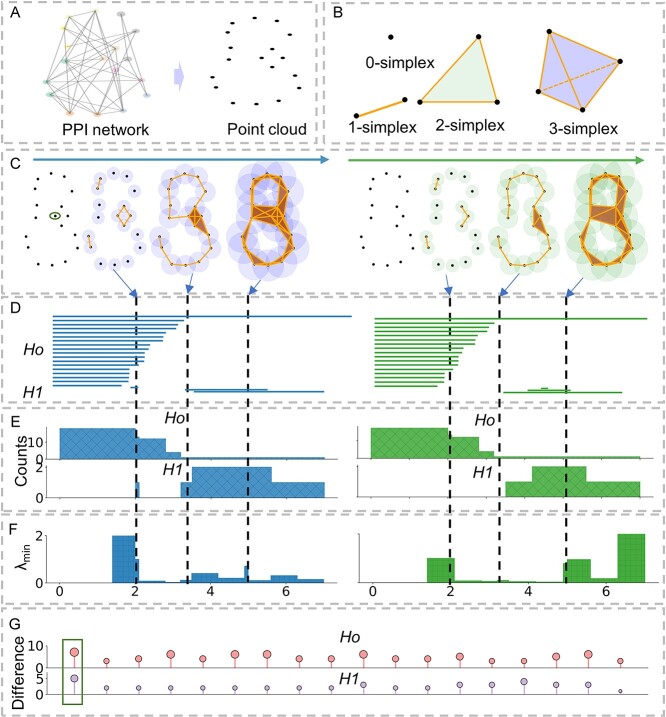
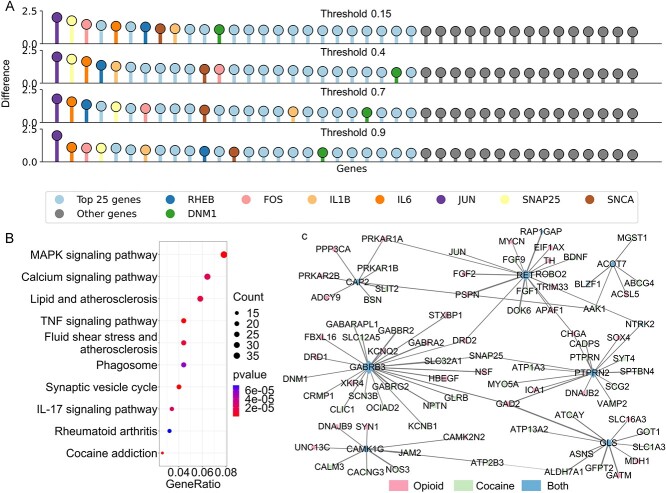
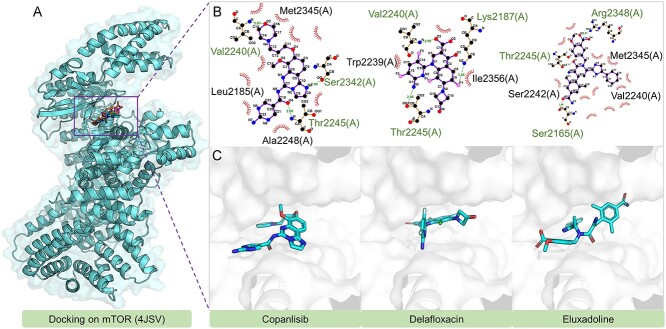
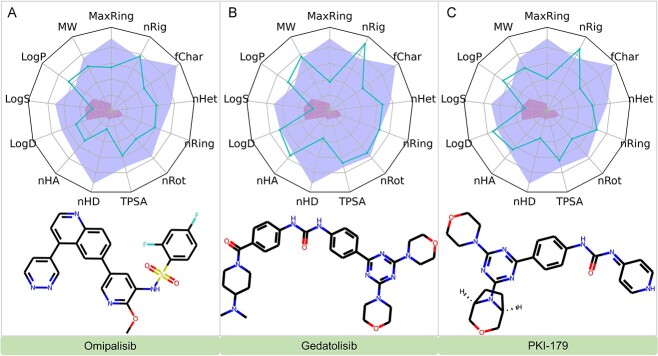
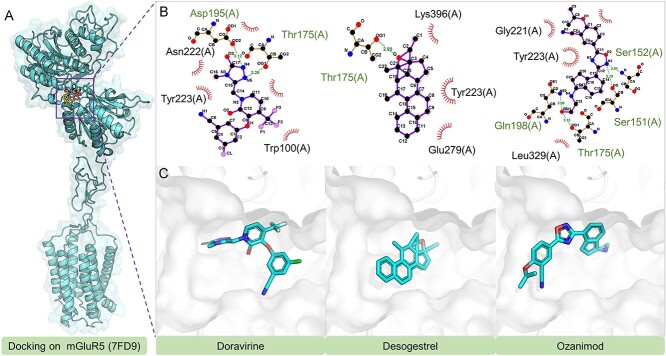
The escalating drug addiction crisis in the United States underscores the urgent need for innovative therapeutic strategies. This study embarked on an innovative and rigorous strategy to unearth potential drug repurposing candidates for opioid and cocaine addiction treatment, bridging the gap between transcriptomic data analysis and drug discovery. We initiated our approach by conducting differential gene expression analysis on addiction-related transcriptomic data to identify key genes. We propose a novel topological differentiation to identify key genes from a protein-protein interaction network derived from DEGs. This method utilizes persistent Laplacians to accurately single out pivotal nodes within the network, conducting this analysis in a multiscale manner to ensure high reliability. Through rigorous literature validation, pathway analysis and data-availability scrutiny, we identified three pivotal molecular targets, mTOR, mGluR5 and NMDAR, for drug repurposing from DrugBank. We crafted machine learning models employing two natural language processing (NLP)-based embeddings and a traditional 2D fingerprint, which demonstrated robust predictive ability in gauging binding affinities of DrugBank compounds to selected targets. Furthermore, we elucidated the interactions of promising drugs with the targets and evaluated their drug-likeness. This study delineates a multi-faceted and comprehensive analytical framework, amalgamating bioinformatics, topological data analysis and machine learning, for drug repurposing in addiction treatment, setting the stage for subsequent experimental validation. The versatility of the methods we developed allows for applications across a range of diseases and transcriptomic datasets.

Keywords: differentially expressed gene; drug repurposing; persistent spectral theory; substance addiction.


Figures

Figure 1
Figure 1
Overview of the Study: (A) PST-Based Topological Differentiation Analysis: This stage involves applying PST for topological differentiation analysis of the PPI network. The method quantifies the significance of nodes within the network in a multiscale manner. (B) DEG Analysis: We extracted opioid and cocaine addiction-related transcriptomic data from the GEO database. Key genes were identified from the PPI network derived from DEGs using topological analysis, and results were integrated across networks with various thresholds. Literature validation and pathway analysis were conducted to confirm the functionality and biological mechanisms of the key genes in substance addiction. (C) Drug Repurposing: Machine learning models, incorporating NLP-based fingerprints and traditional 2D fingerprints, were developed to predict the binding affinities of DrugBank compounds to three addiction-related targets: mTOR, mGluR5 and NMDAR. This process aims to identify potential repurposing candidates after the ADMET analysis for treating substance addiction.
Figure 2
Figure 2
DEG analysis for opioid addiction. (A) Volcano plot of DEGs: This plot visually distinguishes DEGs in opioid addiction, highlighting significant genes above the threshold lines. (B) Enriched pathways in opioid addiction: Showcases the top 10 pathways significantly enriched in the context of opioid addiction, emphasizing their relevance in the disease mechanism. (C) Sankey plot of pathway-DEG relationships: Illustrates the top eight enriched pathways and their connections with DEGs, highlighting the intricate interplay between them. (D) Key gene-related PPI sub-network: Depicts the PPI sub-network specifically associated with key genes identified in opioid addiction. Each node represents a protein, and the size of the node is proportional to its degree, indicating the number of interactions it has within the network. (E) Venn diagram of significant intersections: Displays intersections of the top 25 significant genes across four PPI networks with varying thresholds, demonstrating the consistency of key genes in opioid addiction. (F) PST-based network differentiation significance: This graph presents the significance of individual genes as calculated from the PST-based differentiation of the network. For clarity, only the first 40 genes are included.
Figure 3
Figure 3
Topological differentiation of network. (A) PPI network as a point cloud: This panel visualizes the PPI network abstracted as a point cloud, forming the basis of a simplicial complex. (B) Basic unit of simplicial complex. (C) Filtration process: This panel depicts the filtration process, which generates a series of simplicial complexes with increasing radii. The left figure shows the original PPI network’s simplicial complex, while the right figure displays the new simplicial complex formed after deleting a protein (indicated by the green circle). PH and PST are used to characterize topological and geometric changes post-deletion. (D) Persistent barcodes in topological representation: PH is utilized here to provide a topological representation of the network, illustrated through persistent barcodes. The horizontal bars capture the persistence of topological features across the network’s filtration process. Specifically, the top series of bars represent 0-dimensional features (connected components), indicating how individual components merge over time, while the bottom series represent 1-dimensional features (loops or holes), illustrating the formation and closure of loops within the network. The left end of each bar marks the ’birth’ (appearance) of a feature at a specific scale, and the right end signifies its ’death’ (disappearance), with the length of the bar indicating the feature’s persistence across scales. (E) PST is applied to analyze the spectra of persistent Laplacians, with harmonic spectra indicating topological persistence, akin to PH. The figure shows changes in the count of topological invariants during filtration. (F) Capturing homotopic shape Evolution: The non-harmonic spectra in PST highlight the homotopic shape evolution of data. This panel demonstrates the change in the minimum of non-harmonic spectra during the filtration process. (G) Impact of node deletion on topological invariants: This figure illustrates the changes in topological invariants resulting from the deletion of each node in the network. The sum of changes during filtration is shown, with the green rectangle highlighting the changes corresponding to the most significant node.
Figure 4
Figure 4
DEG analysis for cocaine addiction. (A) Volcano plot of DEGs: This plot visually distinguishes DEGs in cocaine addiction, highlighting significant genes above the threshold lines. (B, C) Enriched pathways in cocaine addiction: Showcases the top 10 pathways significantly enriched in the context of cocaine addiction, emphasizing their relevance in the disease mechanism. (D) Key gene-related PPI sub-network: Depicts the PPI sub-network specifically associated with key genes identified in cocaine addiction. Each node represents a protein, and the size of the node is proportional to its degree, indicating the number of interactions it has within the network. (E) Venn diagram of significant intersections: Displays intersections of the top 25 significant genes across four PPI networks with varying thresholds, demonstrating the consistency of key genes in cocaine addiction. (F) PST-based network differentiation significance: This graph presents the significance of individual genes as calculated from the PST-based differentiation of the network. For clarity, only the first 40 genes are included.
Figure 5
Figure 5
Integrated analysis of opioid and cocaine addiction DEGs. (A) PST-based network differentiation significance: This graph displays the significance of individual genes as determined by the PST-based differentiation in the integrated network of opioid and cocaine addiction DEGs. To enhance clarity, only the first 40 genes are shown. (B) Enriched pathways in integrated DEGs: Illustrates the pathways that are significantly enriched in the context of the integrated DEGs from both opioid and cocaine addiction, highlighting their combined biological relevance. (C) PPI sub-network related to common DEGs: Depicts the PPI sub-network associated with DEGs that are present in both opioid and cocaine addiction conditions, emphasizing the shared molecular mechanism. Each node represents a protein, and the size of the node is proportional to its degree, indicating the number of interactions it has within the network.
Figure 6
Figure 6
The docking structures and interactions of Copanlisib, Delafloxacin and Eluxadoline with mTOR.
Figure 7
Figure 7
Evaluations of ADMET Properties for Omipalisib, Gedatolisib and PKI-179: this figure illustrates the ADMET profiles of Omipalisib, Gedatolisib and PKI-179, with the blue curves representing the values of 13 specified ADMET properties. The blue and red zones demarcate the upper and lower limits, respectively, of the optimal ranges for these properties.
Figure 8
Figure 8
The docking structures and interactions of Doravirine, Desogestrel and Ozanimod with mGluR5.
Figure 9
Figure 9
Evaluations of ADMET Properties for Mavoglurant, Dipraglurant and Lersivirine: this figure showcases the ADMET profiles for Mavoglurant, Dipraglurant and Lersivirine. The blue curves in the graph indicate the values for 13 specific ADMET properties of these compounds. The yellow and red zones in the graph are designated to highlight the upper and lower limits of the optimal ranges for each of these ADMET properties, respectively.
Figure 10
Figure 10
The docking structures and interactions of Delavirdine, Adenosine phosphate and Ademetionine with NMDAR.
Figure 11
Figure 11
Evaluations of ADMET Properties for Gavestinel, Perzinfotel and Butylphthalide.

Similar articles

Cited by

References

    1. McLellan AT, Lewis DC, O’Brien CP, Kleber HD. Drug dependence, a chronic medical illness: implications for treatment, insurance, and outcomes evaluation. JAMA 2000;284(13):1689–95. - PubMed
    1. de Carvalho HB, Seibel SD. Crack cocaine use and its relationship with violence and hiv. Clinics 2009;64(9):857–66. - PMC - PubMed
    1. Zhang X, Hailei Y, Bai R, Ma C. Identification and characterization of biomarkers and their role in opioid addiction by integrated bioinformatics analysis. Front Neurosci 2020;14:608349. - PMC - PubMed
    1. Wang X, Sun S, Chen H, et al. . Identification of key genes and therapeutic drugs for cocaine addiction using integrated bioinformatics analysis. Front Neurosci 2023;17:1201897. - PMC - PubMed
    1. Zomorodian A, Carlsson G. Computing persistent homology. Discrete Comput. Geom, 2005;33(2):249–274.

Publication types