. 2024 Apr 24;52(7):4079-4097.
doi: 10.1093/nar/gkae174.

Expanding the flexibility of base editing for high-throughput genetic screens in bacteria

Affiliations

Expanding the flexibility of base editing for high-throughput genetic screens in bacteria

Sandra Gawlitt et al. Nucleic Acids Res. .

Abstract

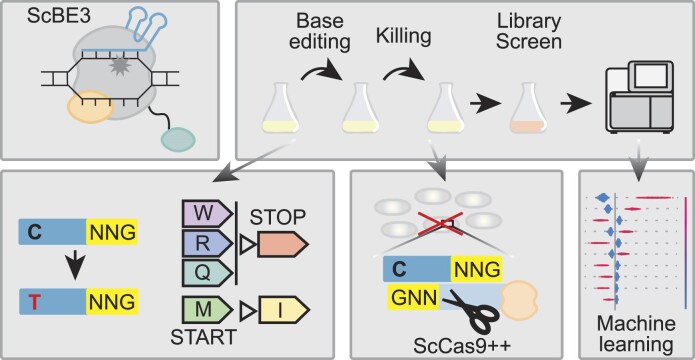
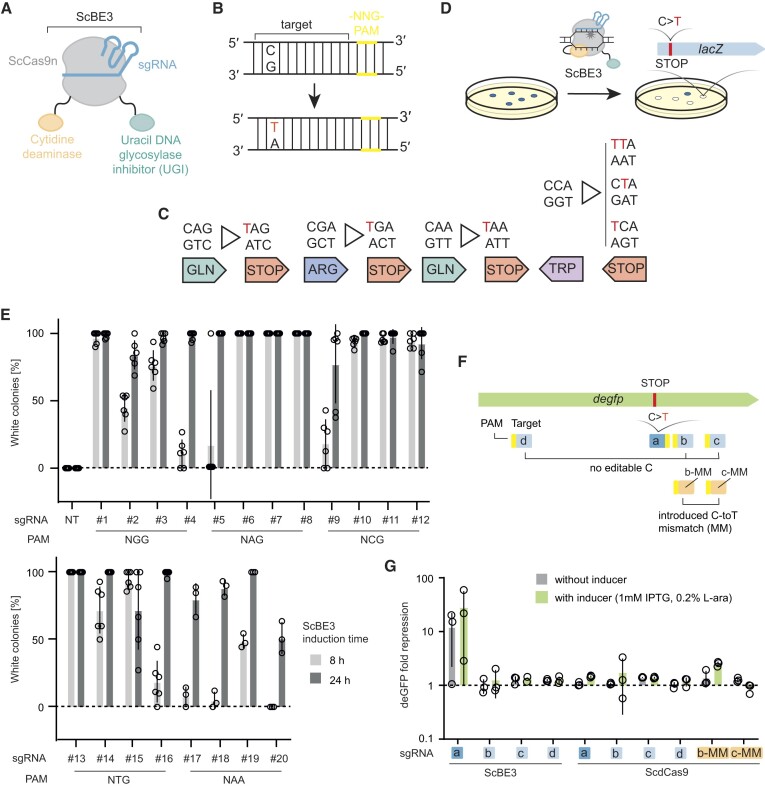
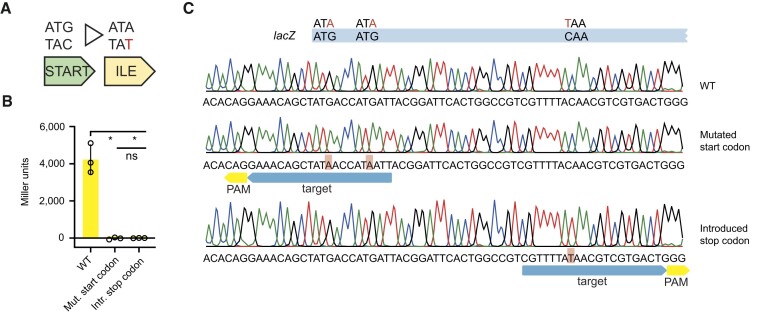
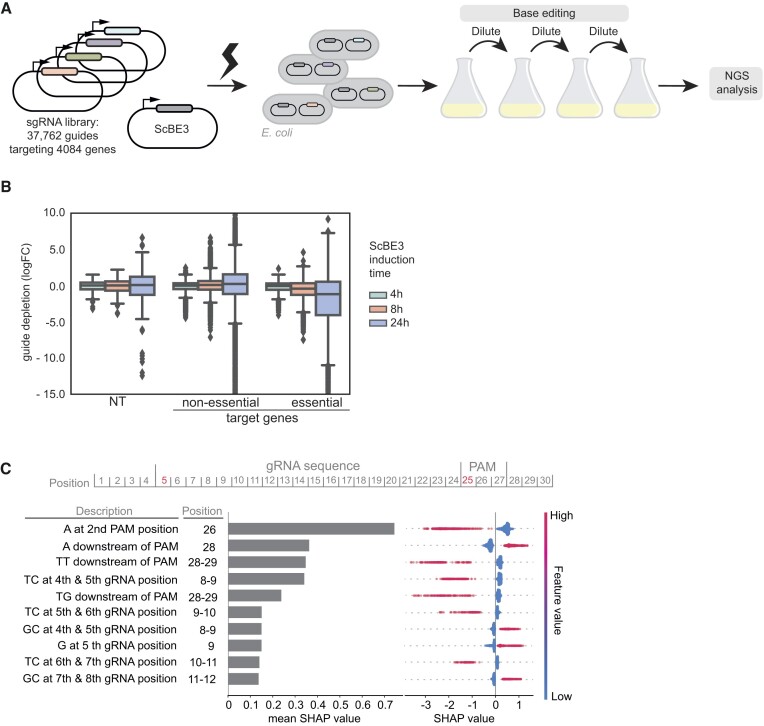
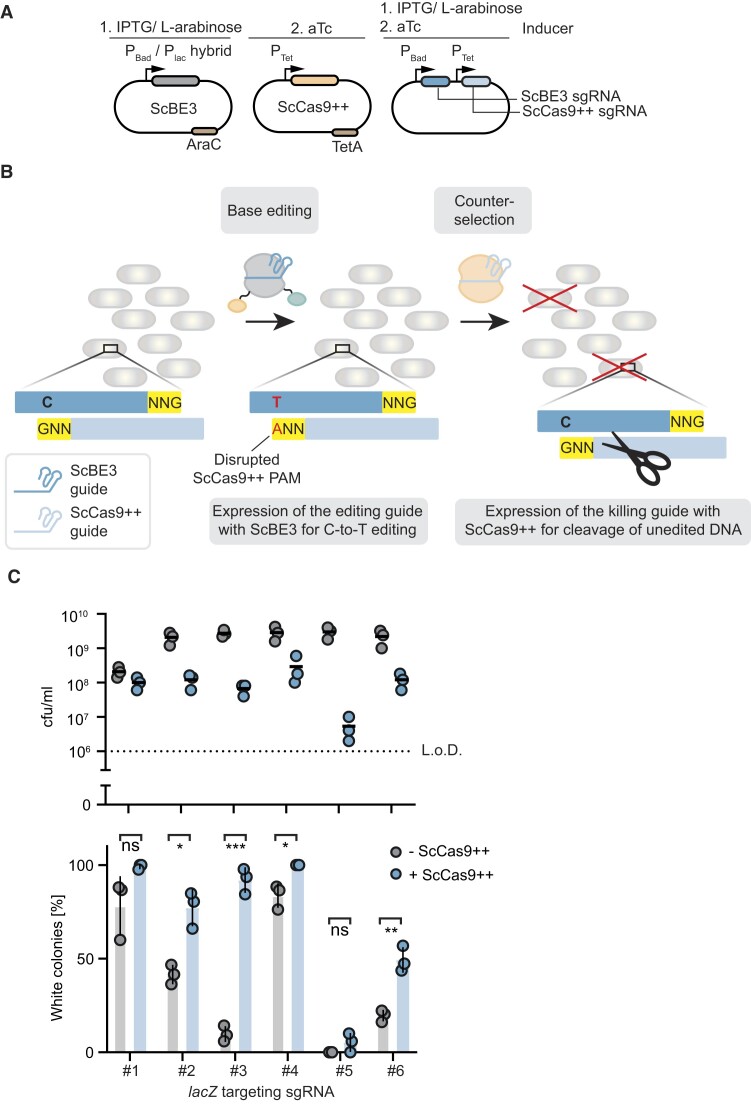
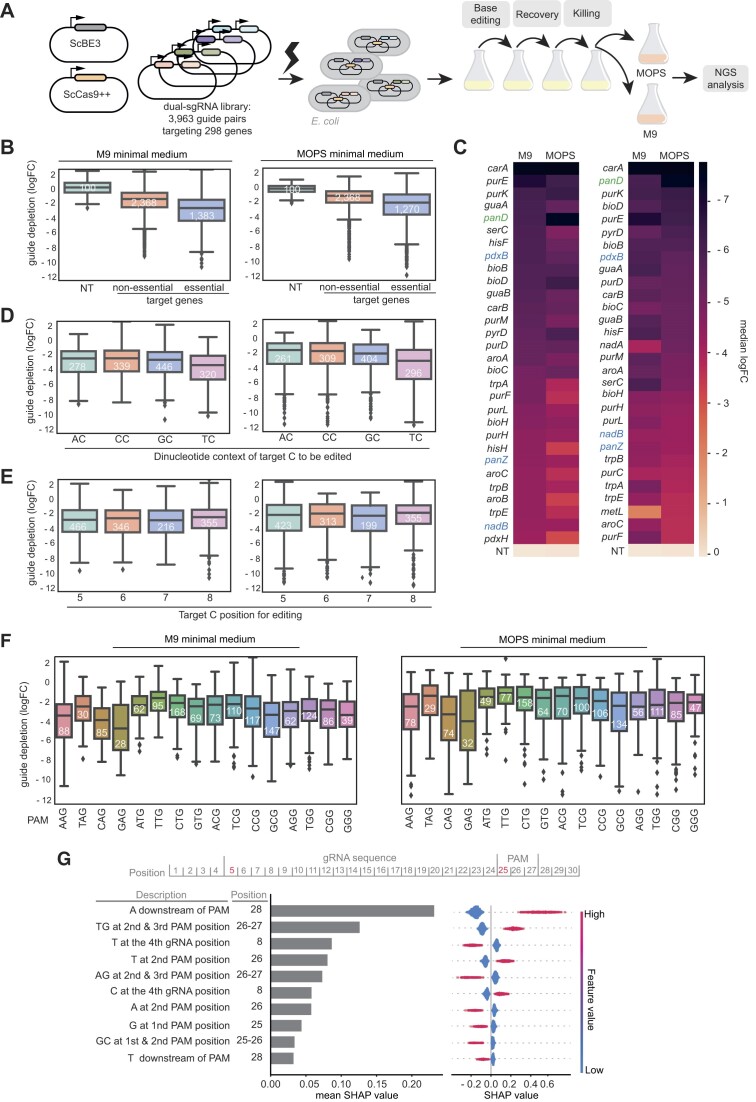
Genome-wide screens have become powerful tools for elucidating genotype-to-phenotype relationships in bacteria. Of the varying techniques to achieve knockout and knockdown, CRISPR base editors are emerging as promising options. However, the limited number of available, efficient target sites hampers their use for high-throughput screening. Here, we make multiple advances to enable flexible base editing as part of high-throughput genetic screening in bacteria. We first co-opt the Streptococcus canis Cas9 that exhibits more flexible protospacer-adjacent motif recognition than the traditional Streptococcus pyogenes Cas9. We then expand beyond introducing premature stop codons by mutating start codons. Next, we derive guide design rules by applying machine learning to an essentiality screen conducted in Escherichia coli. Finally, we rescue poorly edited sites by combining base editing with Cas9-induced cleavage of unedited cells, thereby enriching for intended edits. The efficiency of this dual system was validated through a conditional essentiality screen based on growth in minimal media. Overall, expanding the scope of genome-wide knockout screens with base editors could further facilitate the investigation of new gene functions and interactions in bacteria.


Figures

Graphical Abstract
Graphical Abstract
Figure 1.
Figure 1.
The rAPO-ScCas9n-UGI (ScBE3) base editor efficiently introduces stop codons in E. coli with flexible PAM recognition and only minor transcriptional repression. (A) Schematic of the ScBE3 base editor, which was constructed by fusing ScCas9 D10A N-terminally to an rAPOBEC1 deaminase using a 16-aa linker and fusing it C-terminally to a UGI using a 5-aa linker. (B) Schematic of a target locus with the target cytosine that is converted into a thymine through base editing. The PAM is depicted in yellow and labeled as "PAM," and the mutated base (T replacing a C) in red. (C) Nucleobase context of ScBE3 target cytosines that lead to stop codons. (D) Schematic of the lacZ disruption in E. coli through the conversion of a cytosine to thymine, which creates a premature stop codon. A blue–white screen enables the readout of lacZ-disrupted cells. (E) Quantification of the editing efficiency across different PAM motifs. ScBE3 was induced for 8 h before plating cells (light gray bars) or a total of 24 h (dark gray bars). A nontargeting guide was included to ensure integrity of the lacZ gene. Four guides were tested for each canonical 5′-NNG-3′ PAM and four additional guides were selected for the noncanonical 5′-NAA-3′ PAM. Each pair of bars represents data from a different guide sequence. The bars represent the mean and the vertical lines represent the standard deviation from three individual biological replicates (and two additional technical replicates for all guides except for guides next to 5′-NAA-3′ PAMs). (F) Target sites for sgRNAs a–d [a in dark blue targeting the template strand, b-d in light blue targeting the nontemplate strand and b-MM and c-MM in orange encoding a C-to-T mismatch (MM) to simulate previous editing] within the degfp open reading frame (ORF). The PAM is colored in yellow and flanks each box depicting the target site. (G) GFP repression assay, analyzed by flow cytometry, using (i) ScBE3 or (ii) ScdCas9 with an sgRNA (a) targeting the degfp sequence with a cytosine in the appropriate ScBE3 editing window and sgRNAs (b–d) targeting the degfp sequence without a cytosine in the appropriate editing window with or without a mismatch (MM) simulating a C-to-T edit. Expression of ScBE3 and ScdCas9 was induced with 1 mM of IPTG and 0.2% l-arabinose prior to the flow cytometry measurement and compared to an uninduced control. The bars represent the mean and the vertical lines represent the standard deviation from three individual biological replicates.
Figure 2.
Figure 2.
Mutating the start codon serves as an alternative strategy for gene disruption with base editors in bacteria. (A) Nucleobase context of ScBE3 target cytosines that lead to a mutated start codon. (B) Quantification of the β-galactosidase activity based on Miller units (see the ‘Materials and methods’ section) for base editing guides that disrupt start codons and introduce a premature stop codon, respectively. The bars and vertical lines represent the mean and standard deviation from three individual biological replicates, respectively. ****P < 0.0001; ***P < 0.001; **P < 0.01; *P < 0.05; ns: P > 0.05. (C) Target sites and edited bases within the E. coli lacZ gene. Sanger traces of the WT sequence are depicted for comparison. The guides are colored in blue and labeled as "target," while the PAM sequence flanking the spacer site is colored in yellow and labeled as "PAM."
Figure 3.
Figure 3.
A genome-wide base editor essentiality screen in E. coli reveals target preferences of ScBE3. (A) Schematic of the genome-wide gene essentiality screen in E. coli using ScBE3. (B) Comparison of guide depletion between essential and nonessential gene targets at different time points of ScBE3 expression. The logFC of sgRNAs targeting essential or nonessential genes or including a nontargeting control were compared based on the difference between time points 0 and 4, 8 or 24 h. Boxplots: Centerline represents the median, the boxes indicate first and third quartiles, respectively, while the whiskers are 1.5 times the interquartile range above or below the edges of the boxes. The logFC values are based on the number of guides for each group (395, 34 196 and 2809 for NT, nonessential and essential target genes, respectively). (C) SHAP (SHapley Additive exPlanations) values for the top 10 features affecting ScBE3 target preferences.
Figure 4.
Figure 4.
A dual system that combines base editing with Cas9-induced cell killing helps rescue less efficient target sites. (A) Schematic of the constructs for the dual system facilitating inducible base editing and Cas9 counterselection. (B) Schematic of the experimental setup that combines base editing with subsequent Cas9-induced cleavage of the unedited DNA. In the first step, the ScBE3 and base editing guide (top strand shown in dark blue) are expressed leading to the introduction of a stop codon by converting cytosines to thymines. In the next step, ScCas9++ and the killing guide (bottom strand shown in light blue) are expressed, which mediates DNA cleavage in case of the presence of an intact 5′-NGG-3′ PAM, reflecting unsuccessful base editing on the opposite DNA strand. Consequently, the unedited cell fraction is eradicated from the population (crossed out cells). (C) Analysis of the total number of colonies and proportion of white colonies representing edited cells after applying the dual system. CFU/ml (top graph) and percentage of white colonies (bottom graph) after induction of ScBE3 alone or utilizing the dual system combining ScBE3 with ScCas9++ and plating on X-gal plates. The lacZ gene was targeted at different loci utilizing sgRNAs #1–6 (or in case of the dual system with a base editing and killing sgRNA pairs #1–6) (Supplementary Table S4). The dots represent three individual biological replicates and the horizontal bar represents the mean (top graph). The bars and vertical lines represent the mean and standard deviation from three individual biological replicates, respectively (bottom graph). ****P < 0.0001; ***P < 0.001; **P < 0.01; *P < 0.05; ns: P > 0.05.
Figure 5.
Figure 5.
Screening conditionally essential E. coli genes with the dual system confirms previously published hits and results in an updated version of ScBE3 target preferences. (A) Schematic of the base editor screen with a dual system combining base editing with subsequent Cas9-induced DNA cleavage of the unedited cell fraction. (B) Comparison of the guide depletion in M9 and MOPS minimal media between conditionally essential and nonessential gene targets. LogFC of sgRNAs targeting conditionally essential genes or nonessential genes based on the difference in guide abundance from the library after the killing step and after the screen in minimal media. A nontargeting control is included in the experiment. (C) Rank order of the 30 genes with the highest guide depletion. The sorting is based on M9 (left) and MOPS (right) minimal media. Genes in blue (nadB, panZpdxB) are essential only in M9 minimal medium (69), genes in green (panD) are essential only in MOPS minimal medium (51,70) and all other genes are essential in both media. (D) Comparing the guide depletion in M9 and MOPS minimal media between different dinucleotide contexts harboring the target cytosine. LogFC of sgRNAs targeting different dinucleotide motifs (AC, CC, GC, TC) within conditionally essential genes. (E) Comparing guide depletion in M9 and MOPS minimal media between different positions of the target cytosine within the ScBE3 editing window. LogFC of sgRNAs targeting essential genes with the target cytosine at position 5, 6, 7 or 8 within the guide sequence. (F) Comparing the guide depletion in M9 and MOPS minimal media when utilizing different PAMs. LogFC of sgRNAs targeting different 5′-NNG-3′ PAMs. (G) SHAP values for the top 10 features affecting ScBE3 target preferences. For panels (B) and (D)–(F), boxplots: Centerline represents the median, the boxes indicate first and third quartiles, respectively, while the whiskers are 1.5 times the interquartile range above or below the edges of the boxes. The logFC values are based on the number of guides (numbers within the boxes) for each group.

Similar articles

Cited by

References

    1. Przybyla L., Gilbert L.A. A new era in functional genomics screens. Nat. Rev. Genet. 2022; 23:89–103. - PubMed
    1. Cain A.K., Barquist L., Goodman A.L., Paulsen I.T., Parkhill J., van Opijnen T. A decade of advances in transposon-insertion sequencing. Nat. Rev. Genet. 2020; 21:526–540. - PMC - PubMed
    1. Coe K.A., Lee W., Stone M.C., Komazin-Meredith G., Meredith T.C., Grad Y.H., Walker S. Multi-strain Tn-Seq reveals common daptomycin resistance determinants in Staphylococcus aureus. PLoS Pathog. 2019; 15:e1007862. - PMC - PubMed
    1. Jana B., Cain A.K., Doerrler W.T., Boinett C.J., Fookes M.C., Parkhill J., Guardabassi L. The secondary resistome of multidrug-resistant Klebsiella pneumoniae. Sci. Rep. 2017; 7:42483. - PMC - PubMed
    1. Shames S.R., Liu L., Havey J.C., Schofield W.B., Goodman A.L., Roy C.R. Multiple effector virulence phenotypes revealed through high-throughput analysis of targeted mutant libraries. Proc. Natl Acad. Sci. U.S.A. 2017; 114:E10446–E10454. - PMC - PubMed

Publication types

MeSH terms

Substances