. 2024 Mar 18;15(1):2351.
doi: 10.1038/s41467-024-46398-2.

Population-wide cerebellar growth models of children and adolescents

Affiliations

Population-wide cerebellar growth models of children and adolescents

Carolin Gaiser et al. Nat Commun. .

Abstract

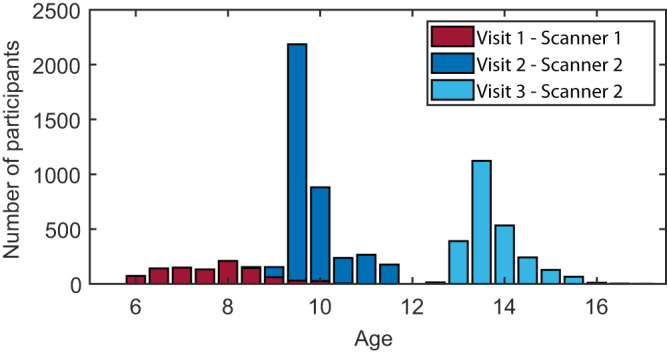
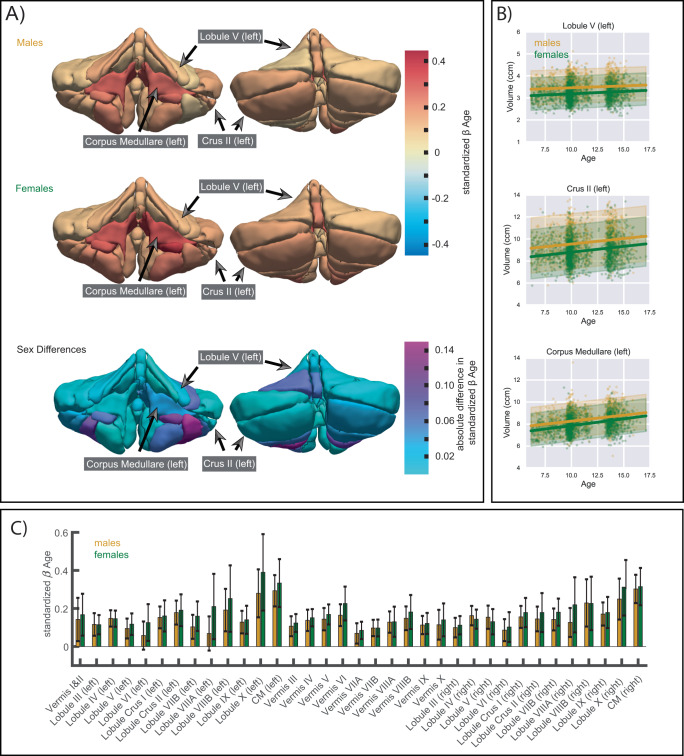
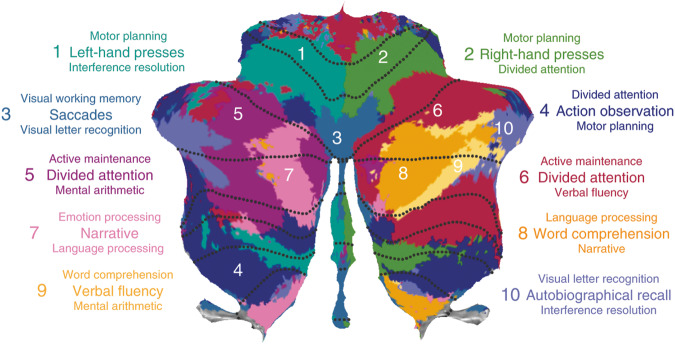
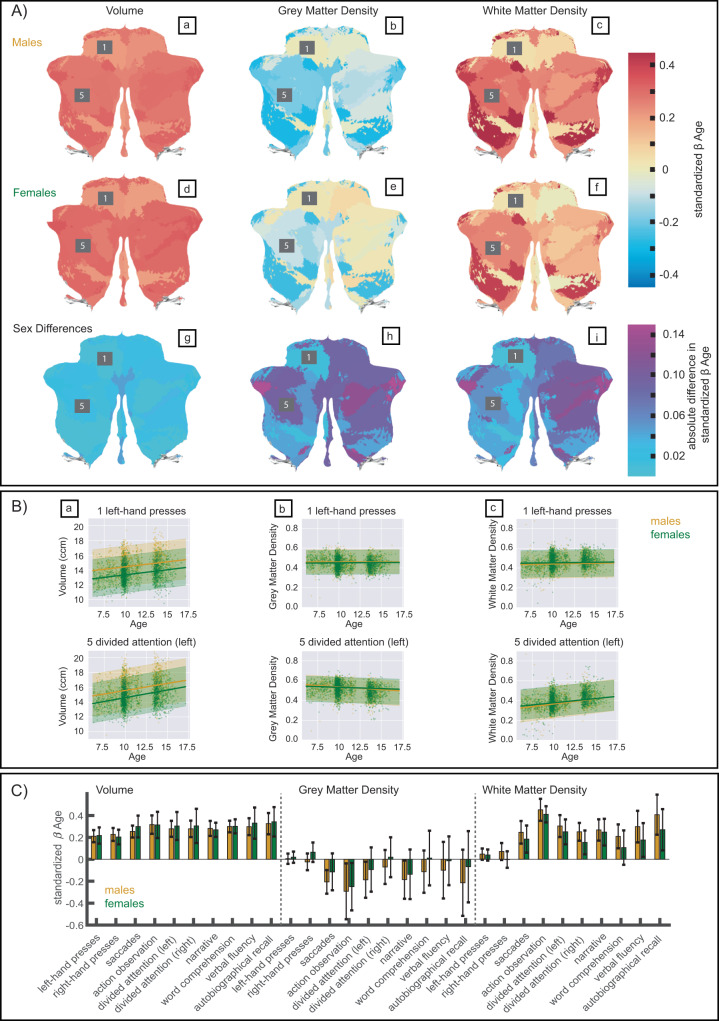
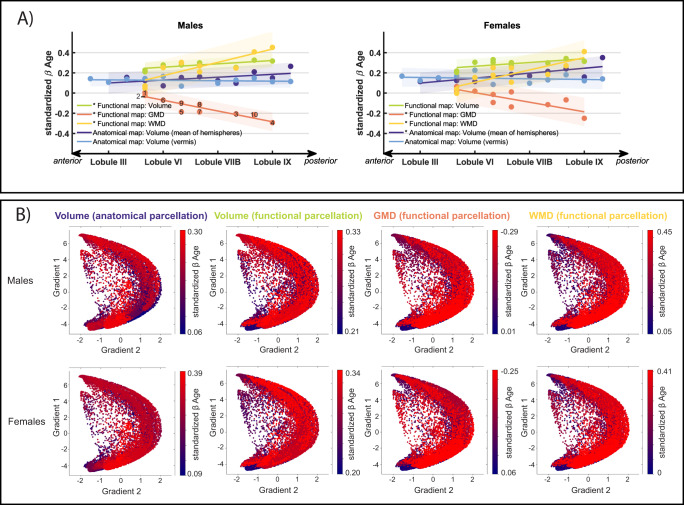
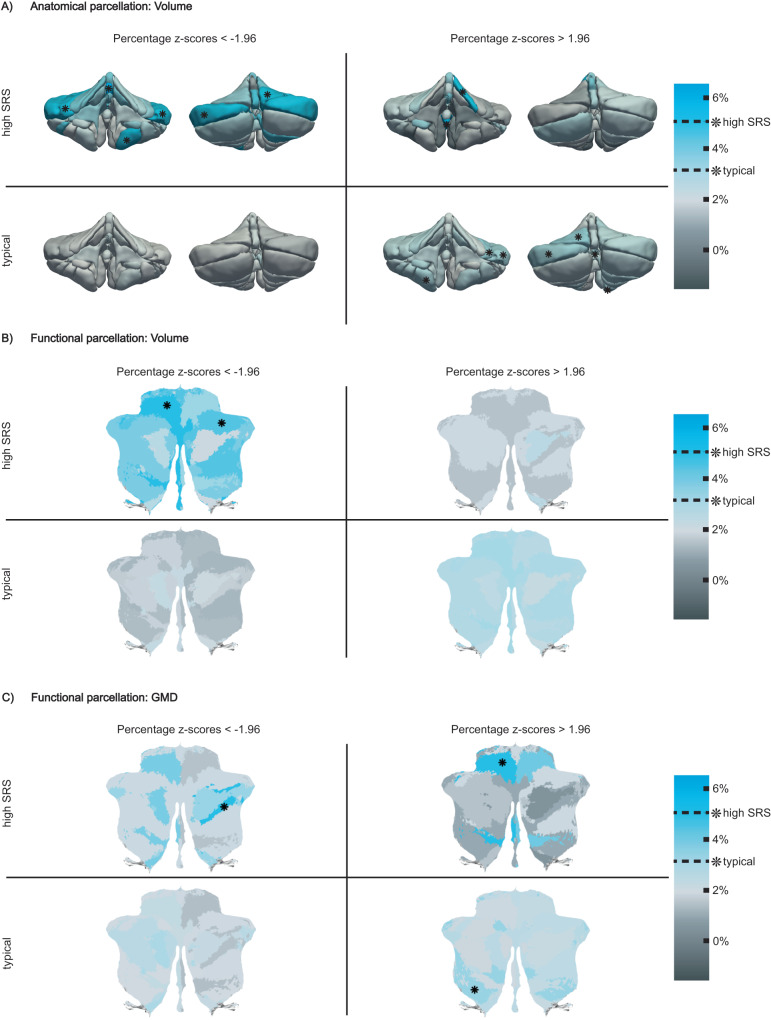
In the past, the cerebellum has been best known for its crucial role in motor function. However, increasingly more findings highlight the importance of cerebellar contributions in cognitive functions and neurodevelopment. Using a total of 7240 neuroimaging scans from 4862 individuals, we describe and provide detailed, openly available models of cerebellar development in childhood and adolescence (age range: 6-17 years), an important time period for brain development and onset of neuropsychiatric disorders. Next to a traditionally used anatomical parcellation of the cerebellum, we generated growth models based on a recently proposed functional parcellation. In both, we find an anterior-posterior growth gradient mirroring the age-related improvements of underlying behavior and function, which is analogous to cerebral maturation patterns and offers evidence for directly related cerebello-cortical developmental trajectories. Finally, we illustrate how the current approach can be used to detect cerebellar abnormalities in clinical samples.


Conflict of interest statement

The authors declare no competing interests.

Figures

Fig. 1
Fig. 1. Histogram of age and scanner distributions in the Generation R cohort.
Mean age visit 1: 7.9 years (range = [6.1–10.7], n = 974 [510 male, 464 female]), mean age visit 2: 10.1 years (range = [8.6–12.0], n = 3785 [1879 male, 1906 female]), and mean age visit 3: 14.0 years (range = [12.6–17.1], n = 2511 [1202 male, 1309 female]). 2734 (56.2%) individuals were measured once, 1848 (38.0%) individuals twice, and scans in all three measurement waves were acquired from 280 (5.8%) individuals. Source data are provided as a Source Data file.
Fig. 2
Fig. 2. Effect of age on volume in the anatomical parcellation.
A Mean posterior distribution for the standardized age β coefficient (slope) for each anatomical ROI and absolute differences in effect sizes (standardized β) between males and females are illustrated. 3D illustrations were generated based on a publically available, manually segmented MR image (MAGeT atlas, brain5). B Trajectories of males (in yellow) and females (in green) in 3 example ROIs: left Lobule V (anterior cerebellum), left Crus II (posterior cerebellum), and left corpus medullare (white matter tract). The bold lines represent the mean trajectories, shaded areas represent what is within 2 standard deviations of the mean. Volume is shown in cubic centimeters (ccm). C Bar graphs of all standardized age β coefficients (slopes) of males (in yellow) and females (in green). Error bars depict +/− 1 standard deviation of standardized age β samples (n = 12,000). Exact numbers can be found in Supplementary Table 3 and the percentage change of mean trajectories for each anatomical ROI is illustrated in Supplementary Fig. 6A. Source data are provided as a Source Data file.
Fig. 3
Fig. 3. Functional parcellation.
Figure adapted with permission from King et al. 2019 (https://www.nature.com/articles/s41593-019-0436-x). Multi-Domain Task Battery (MDTB) functional atlas regions are shown in color. Dotted black lines represent anatomical boundaries.
Fig. 4
Fig. 4. Effect of age on volume, Grey Matter Density (GMD), and White Matter Density (WMD) in the functional parcellation.
A Mean posterior distribution for the standardized age β coefficient (slope) for each functional ROI of the MDTB atlas (a-f) and absolute differences in effect size (standardized β) between males and females are illustrated (gi). B Trajectories of males (in yellow) and females (in green) for 2 example ROIs. 1: Left hand presses (anterior cerebellum) and 5: Divided attention (left) (posterior cerebellum). The bold lines represent the mean trajectories, shaded areas represent what is within 2 standard deviations of the mean. C Bar graphs of all standardized age β coefficients (slopes) of males (in yellow) and females (in green). Error bars depict +/− 1 standard deviation of standardized age β samples (n = 12,000). Exact numbers can be found in Supplementary Table 4 and the percentage change of mean trajectories for each functional ROI is illustrated in Supplementary Fig. 6B. Source data are provided as a Source Data file.
Fig. 5
Fig. 5. Visualizations of growth gradients.
A Linear fit lines through the standardized age β coefficients (shown as dots) of anatomical (vermal in light blue and mean of both hemispheres in dark blue) and functional (volume in green, Grey Matter Density (GMD) in orange, and White Matter Density (WMD) in yellow) ROIs in anterior-to-posterior order. Shaded areas indicate the 95% prediction intervals of the linear fit lines. Asterisks in the legend indicate significant AP growth coefficients (slopes of linear fit lines). Anatomical location of functional parcellation centroids are indicated by numbers in the first panel and listed in Supplementary Table 5. B Growth gradients visualized along two functional gradients using the LittleBrain tool. Gradient 1 (y-axis) ranges from motor (negative values) to non-motor areas (positive values); Gradient 2 (x-axis) from low (negative values) to high (positive values) task focus/cognitive load. Each dot in the scatterplot represents a voxel in the cerebellum. The color map (scaled per modality to ease comparisons) shows standardized age β coefficients of the cerebellar parcellation a given voxel belongs to. Source data are provided as a Source Data file.
Fig. 6
Fig. 6. Cerebellar deviations of typically developing children and children with autism traits.
Percentage of individuals with large negative (z-score < −1.96) and large positive (z-score > 1.96) deviations in typically developing children (n = 2,012) and children that are likely to fall on the Autism spectrum (high Social Responsiveness Scale (SRS) score, n = 198) are shown. Asterisks indicate ROIs in which children with high SRS and children with typical SRS scores have a significantly higher percentage of large deviation than expected at the p = 0.05 level (typical > 3.13%, high SRS > 5.05%) using Binomial testing (observed vs. expected number of participants with z > 1.96/z < −1.96 in high SRS and typical children, given a null hypothesized probability of p0 = 0.025, one-sided). A Deviations in volume in the anatomical ROIs. 3D illustrations were generated based on a publically available, manually segmented MR image (MAGeT atlas, brain5). B Deviations in volume in functional ROIs. C Deviations in Grey Matter Density (GMD) in functional ROIs. White Matter Density (WMD) deviations are shown in Supplementary Fig. 8. Source data are provided as a Source Data file.

Similar articles

Cited by

References

    1. Buckner RL, et al. The organization of the human cerebellum estimated by intrinsic functional connectivity. J. Neurophysiol. 2011;106:2322–2345. doi: 10.1152/jn.00339.2011. - DOI - PMC - PubMed
    1. Strick PL, Dum RP, Fiez JA. Cerebellum and nonmotor function. Annu. Rev. Neurosci. 2009;32:413–434. doi: 10.1146/annurev.neuro.31.060407.125606. - DOI - PubMed
    1. Wang VY, Zoghbi HY. Genetic regulation of cerebellar development. Nat. Rev. Neurosci. 2001;2:484–491. doi: 10.1038/35081558. - DOI - PubMed
    1. Limperopoulos C, et al. Late gestation cerebellar growth is rapid and impeded by premature birth. Pediatrics. 2005;115:688–695. doi: 10.1542/peds.2004-1169. - DOI - PubMed
    1. Wang SSH, Kloth AD, Badura A. The cerebellum, sensitive periods, and autism. Neuron. 2014;83:518–532. doi: 10.1016/j.neuron.2014.07.016. - DOI - PMC - PubMed