. 2024 Mar 18;15(1):1878.
doi: 10.1038/s41467-024-46032-1.

Hepatic nutrient and hormone signaling to mTORC1 instructs the postnatal metabolic zonation of the liver

Affiliations

Hepatic nutrient and hormone signaling to mTORC1 instructs the postnatal metabolic zonation of the liver

Ana Belén Plata-Gómez et al. Nat Commun. .

Abstract

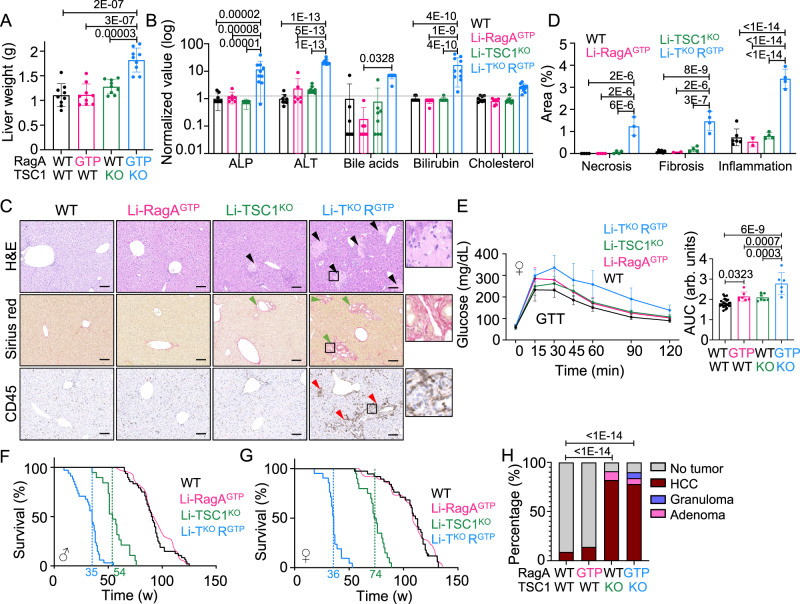
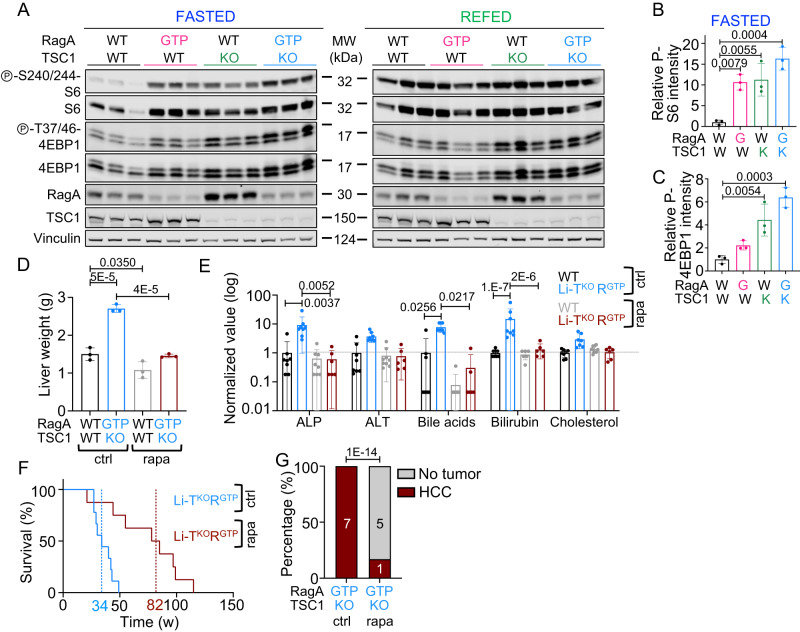
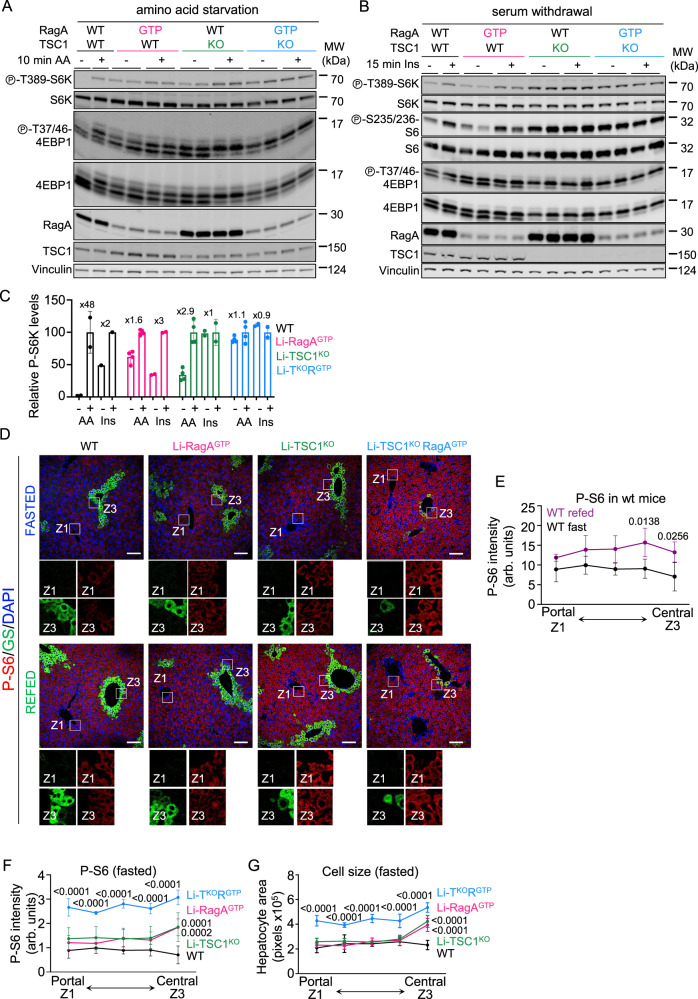
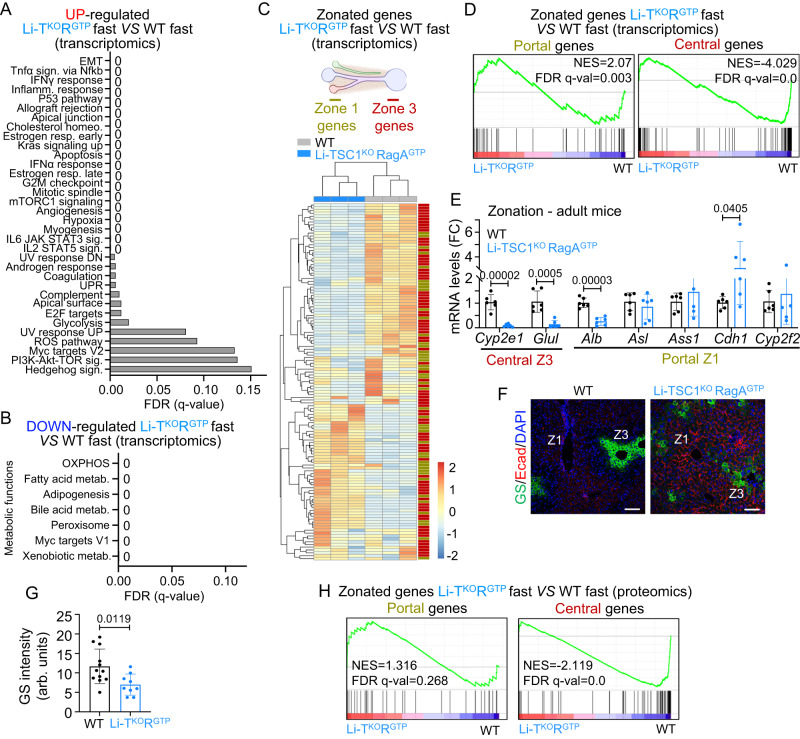
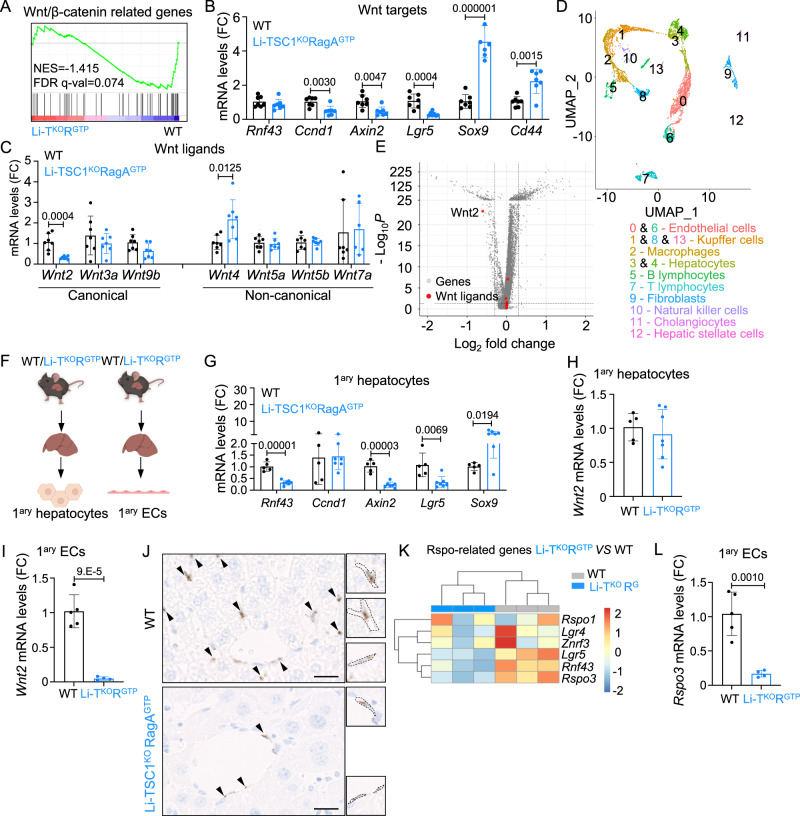
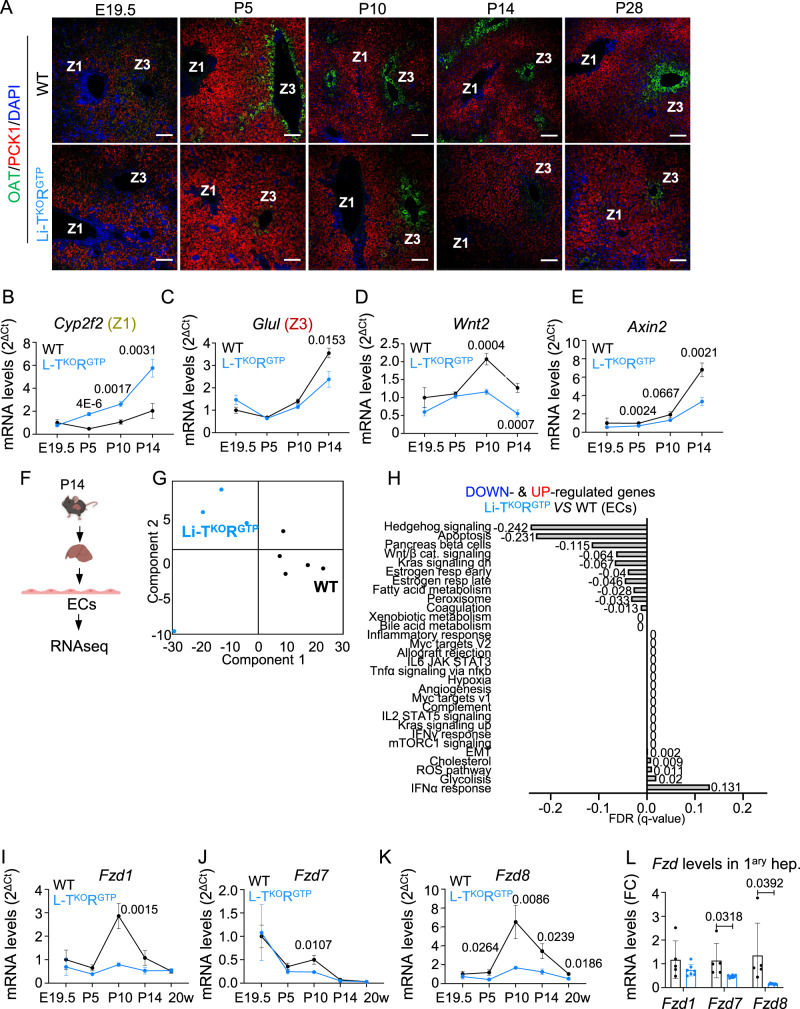
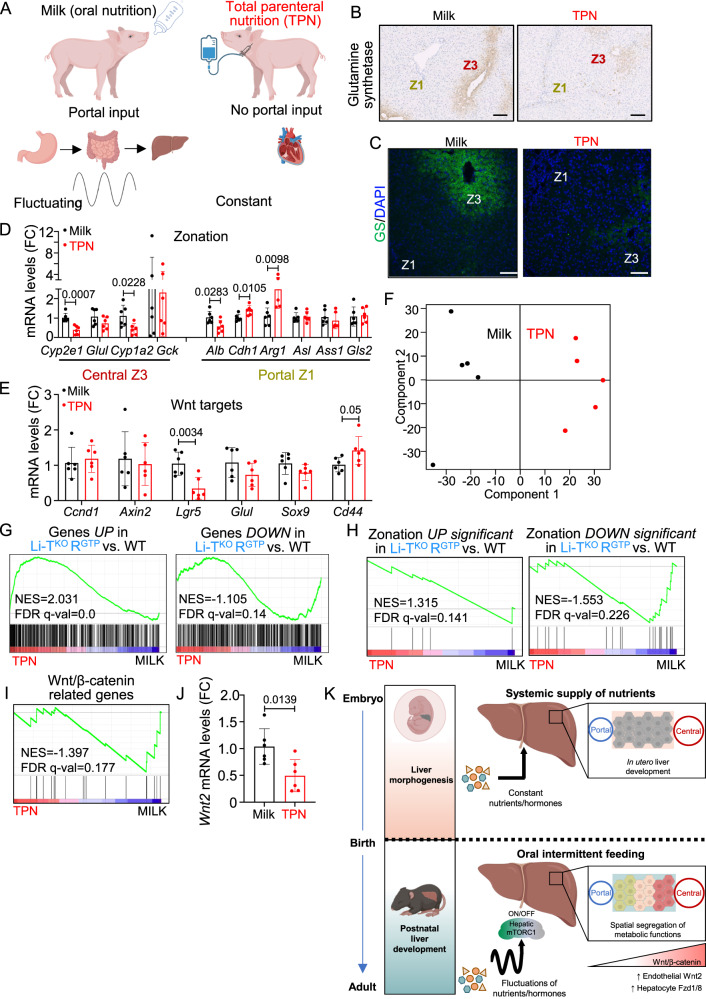
The metabolic functions of the liver are spatially organized in a phenomenon called zonation, linked to the differential exposure of portal and central hepatocytes to nutrient-rich blood. The mTORC1 signaling pathway controls cellular metabolism in response to nutrients and insulin fluctuations. Here we show that simultaneous genetic activation of nutrient and hormone signaling to mTORC1 in hepatocytes results in impaired establishment of postnatal metabolic and zonal identity of hepatocytes. Mutant hepatocytes fail to upregulate postnatally the expression of Frizzled receptors 1 and 8, and show reduced Wnt/β-catenin activation. This defect, alongside diminished paracrine Wnt2 ligand expression by endothelial cells, underlies impaired postnatal maturation. Impaired zonation is recapitulated in a model of constant supply of nutrients by parenteral nutrition to piglets. Our work shows the role of hepatocyte sensing of fluctuations in nutrients and hormones for triggering a latent metabolic zonation program.


Conflict of interest statement

The authors declare no competing interests.

Figures

Fig. 1
Fig. 1. Simultaneous deregulation of nutrient and hormone signaling to mTORC1 leads to synergic liver damage, glucose metabolism alteration and decreased lifespan.
A Liver weight of 10- to 26-week-old wild-type (n = 9), Li-RagAGTP (n = 9), Li-TSC1KO (n = 9) and Li-TSC1KORagAGTP (n = 9) male and female mice. Statistical significance was calculated by using 1way ANOVA with Tukey’s multiple comparisons test. B Levels of circulating alkaline phosphatase (ALP), alanine aminotransferase (ALT), bile acids, bilirubin and cholesterol were measured in 9- to 25-week-old wild-type (n = 8), Li-RagAGTP (n = 7), Li-TSC1KO (n = 8) and Li-TSC1KORagAGTP (n = 10) male and female mice. Values were made relative to wild-type average level and presented in log10 scale. Statistical significance was calculated by using 2way ANOVA with Tukey’s multiple comparisons test. C Representative hepatic H&E, Sirius red staining and CD45 IHC of 10- to 26-week-old wild-type, Li-RagAGTP, Li-TSC1KO and Li-TSC1KORagAGTP male and female mice. Black, green and red arrowheads indicate necrotic, fibrotic and inflammatory areas, respectively. Scale bar 100 μm. D Quantification of necrosis, fibrosis and inflammation in 10- to 26-week-old wild-type (necrosis n = 4, fibrosis/inflammation n = 6), Li-RagAGTP (necrosis n = 4, fibrosis/inflammation n = 2), Li-TSC1KO (necrosis/fibrosis/inflammation n = 4) and Li-TSC1KORagAGTP (necrosis n = 3, fibrosis/inflammation n = 4) male and female mice. Statistical significance was calculated by using 2way ANOVA with Tukey’s multiple comparisons test. E Glucose tolerance test (GTT) of 8- to 16-week-old wild-type (n = 25), Li-RagAGTP (n = 7), Li-TSC1KO (n = 7) and Li-TSC1KORagAGTP (n = 6) females and area under the curve (AUC) of glucose tolerance test. Statistical significance was calculated by using 1way ANOVA with Tukey’s multiple comparisons test. F, G Kaplan–Meier survival curves of wild-type (n = 48 males, n = 38 females), Li-TSC1KO (n = 19 males, n = 20 females) and Li-TSC1KORagAGTP (n = 34 males and n = 21 females) male and female mice, respectively. Mean survival depicted in green for Li-TSC1KO and blue for Li-TSC1KO RagAGTP. Mean survival of Li-RagAGTP mice from ref. is depicted in pink. Statistical significance was calculated with the log-rank (Mantel–Cox) test. H Heterogeneous liver tumor development in wild-type (n = 41), Li-RagAGTP (n = 33), Li-TSC1KO (n = 11) and Li-TSC1KORagAGTP (n = 18) male and female mice. Statistical significance was calculated with chi-squared test. In all panels data are presented as mean values ± standard deviation.
Fig. 2
Fig. 2. Pharmacological inhibition of mTORC1 in Li-TSC1KORagAGTP mice suppresses liver damage and extends lifespan.
A 10- to 26-week-old control, Li-RagAGTP, Li-TSC1KO and Li-TSC1KORagAGTP females were deprived from food for 24 h, half of them following a 2 h refeeding, and then sacrificed. Protein lysates from the liver were immunoblotted for the indicated proteins. B Levels of Phospho-S240-244-S6 from fasted state on each lane from A are relative to vinculin levels and presented normalized to the average level of fasted wild-type mice (n = 3). Statistical significance was calculated by using 1way ANOVA with Tukey’s multiple comparisons test. C Levels of Phospho-T37/46-4EBP1 from fasted state on each lane from A are relative to vinculin levels and presented normalized to the average level of fasted wild-type mice (n = 3). Statistical significance was calculated by using 1way ANOVA with Tukey’s multiple comparisons test. D Liver weight of 18- to 20-week-old wild-type control (n = 3), wild-type rapamycin (n = 3), Li-TSC1KORagAGTP control (n = 3) and Li-TSC1KORagAGTP rapamycin (n = 3) male mice. Statistical significance was calculated by using 2way ANOVA with Sidák’s multiple comparisons test. E Levels of circulating alkaline phosphatase (ALP), alanine aminotransferase (ALT), bile acids, bilirubin and cholesterol were measured in aged WT control (n = 8), WT rapamycin (n = 9), Li-TSC1KORagAGTP control (n = 8) and Li-TSC1KORagAGTP rapamycin (n = 6) mice. Values were made relative to the average level in wild-type mice in control condition and presented in log10 scale. Statistical significance was calculated by using 2way ANOVA with Tukey’s multiple comparisons test. F Kaplan–Meier survival curves of Li-TSC1KORagAGTP control (n = 9) and Li-TSC1KORagAGTP rapamycin (n = 8) mice. Mean survival depicted in blue for control Li-TSC1KORagAGTP and garnet for rapamycin-treated Li-TSC1KORagAGTP mice. Statistical significance was calculated with the log-rank (Mantel–Cox) test. G Heterogeneous tumor development in the liver of control (n = 7) and rapamycin-treated (n = 6) Li-TSC1KORagAGTP mice. Statistical significance was calculated with chi-squared test. In all panels, data are presented as mean values ± standard deviation.
Fig. 3
Fig. 3. Nutrients and GF cascades are convergent but independent cues in the control of mTORC1 in the liver.
A Primary hepatocytes from 7- to 14-week-old control wild-type, Li-RagAGTP, Li-TSC1KO and Li-TSC1KORagAGTP male and female mice were deprived from all amino acids in DMEM/F12 for 1 h and re-stimulated with amino acids for 10 min. B Primary hepatocytes from 7- to 9-week-old wild-type, Li-RagAGTP, Li-TSC1KO and Li-TSC1KORagAGTP male and female mice were deprived of serum in DMEM/F12 for 16 h and re-stimulated with insulin for 15 min. C Levels of Phospho-T389-S6K on each lane from A and B are relative to vinculin levels and presented normalized to the maximum activation levels of each genotype (n = 2). Fold change increase after amino acids or insulin stimulation is presented for each genotype. D Representative pictures of immunofluorescence against Phospho-S240-244-S6 and Glutamine Synthetase in the liver of 10- to 26-week-old control wild-type, Li-RagAGTP, Li-TSC1KO and Li-TSC1KORagAGTP male and female mice fasted during 24 h or fasted during 24 h followed by 2-h of refed. Zone 1 and Zone 3 are highlighted in each image. Scale bar 100 μm. E Quantification of the Phospho-S240/244-S6 intensity of 10- to 26-week-old wild-type male and female mice fasted during 24 h (n = 4) or fasted during 24 h followed by a 2-h of refed (n = 4) from portal to central zones. Statistical significance was calculated by using 2way ANOVA with Sidák’s multiple comparisons test. F, G Quantification of the Phospho-S240/244-S6 intensity and hepatocyte area, respectively, of 10- to 26-week-old wild-type (n = 4), Li-RagAGTP (n = 4), Li-TSC1KO (n = 4) and Li-TSC1KORagAGTP (n = 3) male and female mice fasted during 24 h from portal to central zones. Statistical significance was calculated by using 2way ANOVA with Tukey’s multiple comparisons test. P < 0.0001 indicate the statistical significance between the comparisons of L-TR vs L-R, L-T and WT. In all panels, data are presented as mean values ± standard deviation.
Fig. 4
Fig. 4. Metabolic zonation is impaired upon concomitant activation of nutrient and hormonal arms of mTORC1 in the liver.
A Representation of the false discovery rates (FDRs) from the top Hallmark gene sets enriched in livers from 10- to 26-week-old Li-TSC1KORagAGTP (n = 3) versus wild-type (n = 3) female mice in 24 h fasting. B Representation of the false discovery rates (FDRs) from the top Hallmark gene sets downregulated in livers from 10- to 26-week-old Li-TSC1KORagAGTP (n = 3) versus wild-type (n = 3) female mice in 24 h fasting. C Hierarchical clustering Heatmap diagram representing mRNA expression patterns of Li-TSC1KORagAGTP (n = 3) and wild-type (n = 3) livers normalized by z-score. Belonging to Z3 or Z1 is indicated at the right of each gene. Created with BioRender.com. D Enrichment of gene sets related to central and portal signatures in transcriptomics from wild-type (n = 3) and Li-TSC1KORagAGTP (n = 3) livers. NES normalized enrichment score, FDR: false discovery rate. E RT-qPCR of livers from 8- to 21-week-old wild-type (n = 6) and Li-TSC1KORagAGTP (n = 6) male and female mice. Expression levels of the indicated genes involved in zonation relative to the average level in wild-type mice. β-actin was used as housekeeping gene. Statistical significance was calculated by using multiple unpaired two-tailed t-test. F Representative pictures of immunofluorescence against Glutamine synthetase together with E-cadherin in the liver of 10- to 26-week-old wild-type and Li-TSC1KORagAGTP female mice. Zone 1 or Zone 3 are highlighted in each image. Scale bar 100 μm. G Quantification of the Glutamine synthetase intensity of wild-type (n = 12) and Li-TSC1KORagAGTP (n = 9) livers specifically in the central zone. Statistical significance was calculated by using unpaired two-tailed t-test. H Enrichment of gene sets related to central and portal signatures in proteomics from wild-type (n = 4) and Li-TSC1KORagAGTP (n = 4) livers. NES normalized enrichment score, FDR false discovery rate. In all panels, data are presented as mean values ± standard deviation.
Fig. 5
Fig. 5. Wnt/β-catenin pathway is down-regulated in Li-TSC1KORagAGTP livers.
A Enrichment plot for “Wnt/β-catenin related genes” signature for 10- to 26-week-old Li-TSC1KORagAGTP versus wild-type livers from female mice fasted for 24 h followed by 2 h of refeeding at the mRNA level. NES normalized enrichment score, FDR false discovery rate. B, C RT-qPCR of livers from 17- to 25-week-old wild-type (n = 7) and Li-TSC1KORagAGTP (n = 7) female mice. Expression levels of the indicated genes relative to the average level in wild-type mice. β-actin was used as housekeeping gene. Statistical significance was calculated by using multiple unpaired two-tailed t-test. D Uniform Maniform Approximation and Projection for dimension reduction (UMAP) plot of liver cells showing 14 clusters. E Volcano plot highlighting Wnt ligands detected in EC clusters (0 + 6). Y-axis denotes - log10 P-values while X-axis shows Log2 FC values. Dotted lines represent filtering cut-off of log2 fold change above 0.3 and p-value below 0.05. F Primary hepatocytes/EC were isolated (Created with BioRender.com). G, H RT-qPCR of primary hepatocytes from 7-week-old wild-type (n = 5) and Li-TSC1KORagAGTP (n = 7) male/female mice. Expression levels of the indicated genes relative to the average level in wild-type mice. β-actin was used as housekeeping gene. Statistical significance was calculated by using multiple unpaired two-tailed t-test. I RT-qPCR of primary EC from 8- to 15-week-old wild-type (n = 5) and Li-TSC1KORagAGTP (n = 4) mice. Expression levels of Wnt2 relative to the average level in control mice. β-actin was used as housekeeping gene. Statistical significance was calculated by using unpaired two-tailed t-test. J Representative pictures of RNAscope against mWnt2 in the liver of 4-week-old wild-type and Li-TSC1KORagAGTP male/female mice. Scale bar 20 μm. Insets highlight mWnt2 positive EC. K Hierarchical clustering Heatmap diagram representing mRNA expression of Rspo module genes in EC from Li-TSC1KORagAGTP (n = 3) and wild-type (n = 3) livers normalized by z-score. L RT-qPCR of primary EC from 8- to 15-week-old wild-type (n = 5) and Li-TSC1KORagAGTP (n = 4) male/female mice. Expression levels of Rspo3 relative to the average level in control mice. β-actin was used as housekeeping gene. Statistical significance was calculated by using unpaired two-tailed t-test. In all panels, data are presented as mean values ± standard deviation.
Fig. 6
Fig. 6. Hepatic zonation in Li-TSC1KORagAGTP livers is not segregated during postnatal maturation.
A Representative pictures of immunofluorescence against Ornithine aminotransferase (Zone 3) together with Phosphoenolpyruvate Carboxykinase 1 (Zone 1) in the liver of wild-type and Li-TSC1KO RagAGTP male and female mice at E19.5, P5, P10, P14 and P28. Zone 1 and Zone 3 are highlighted in each image. Scale bar 100 μm. BE RT-qPCR of livers from E19.5 wild-type (n = 6) and Li-TSC1KORagAGTP (n = 5) male and female mice, p5 wild-type (n = 7) and Li-TSC1KORagAGTP(n = 7) male and female mice, p10 wild-type (n = 4) and Li-TSC1KORagAGTP(n = 6) male and female mice, and p14 wild-type (n = 7) and Li-TSC1KORagAGTP(n = 7) male and female mice relative to levels in E19.5 wild-type animals. β-actin was used as housekeeping gene. Data are shown as mean with SEM. Statistical significance was calculated by using multiple unpaired two-tailed t-test. F Primary EC were isolated from the liver of wild-type and Li-TSC1KORagAGTP male and female mice at p14 postnatal stage. Created with BioRender.com. G PCA of the transcriptomic profiles of the samples. Each dot represents individual biological replicates. H Representation of the false discovery rates (FDR) from the top Hallmark gene sets enriched and depleted in EC from Li-TSC1KORagAGTP (n = 4) versus wild-type (n = 5) livers. IK RT-qPCR of livers from E19.5 wild-type (n = 6) and Li-TSC1KORagAGTP (n = 5) male and female mice, p5 wild-type (n = 7) and Li-TSC1KORagAGTP(n = 7) male and female mice, p10 wild-type (n = 4) and Li-TSC1KORagAGTP(n = 6) male and female mice, and p14 wild-type (n = 7) and Li-TSC1KORagAGTP(n = 7) male and female mice relative to levels in E19.5 wild-type animals. β-actin was used as housekeeping gene. Data are shown as mean with SEM. Statistical significance was calculated by using multiple unpaired two-tailed t-test. L RT-qPCR of primary hepatocytes from 7-week-old wild-type (n = 5) and Li-TSC1KORagAGTP (n = 7) male and female mice. Expression levels of the indicated genes relative to the average level in wild-type mice. β-actin was used as housekeeping gene. Statistical significance was calculated by using multiple unpaired two-tailed t-test. In all panels data are presented as mean values ± standard deviation.
Fig. 7
Fig. 7. Total parenteral nutrition impairs hepatic metabolic zonation in neonatal pigs.
A Schematic representation of key aspects of orally-fed (MILK) and TPN-fed (TPN) piglets. Created with BioRender.com. B Representative pictures of immunohistochemistry against Glutamine synthetase in the liver of 2-week-old orally-fed and TPN-fed piglets. Zone 1 and Zone 3 are highlighted in each image. Scale bar 100 μm. C Representative pictures of immunofluorescence against Glutamine synthetase in the liver of 2-week-old orally-fed and TPN-fed piglets. Zone 1 and Zone 3 are highlighted in each image. Scale bar 100 μm. D, E RT-qPCR of livers from 2-week-old orally-fed (n = 6) and TPN-fed (n = 6) piglets. Expression levels of the indicated genes relative to the average level in control milk piglets. Atp5f1 was used as housekeeping gene. Statistical significance was calculated by using multiple unpaired two-tailed t-test. F PCA of the transcriptomic profiles of the samples. Each dot represents individual biological replicates. G GSEA in TPN-fed compared to orally-fed piglets on the list of significantly upregulated genes or downregulated genes in Li-TSC1KORagAGTP liver samples. NES normalized enrichment score, FDR false discovery rate. H GSEA in TPN-fed compared to orally-fed piglets on the list of significantly upregulated or downregulated genes related with zonation in Li-TSC1KORagAGTP liver samples. NES normalized enrichment score; FDR false discovery rate. I Enrichment plot for the “Wnt/β-catenin related genes” signature for TPN-fed versus control livers from piglets at the mRNA level. NES normalized enrichment score, FDR false discovery rate. J RT-qPCR of livers from 2-week-old orally-fed (n = 6) and TPN-fed (n = 6) piglets. Expression levels of Wnt2 relative to the average level in control milk piglets. Atp5f1 was used as housekeeping gene. Statistical significance was calculated by using unpaired two-tailed t-test. K Nutrient and hormone signaling to mTORC1 as a metabolic trigger of hepatic zonation. Created with BioRender.com. In all panels data are presented as mean values ± standard deviation.

Similar articles

Cited by

  • Defined Diets Link Iron and α-Linolenic Acid to Cyp1b1 Regulation of Neonatal Liver Development Through Srebp Forms and LncRNA H19.
    Jefcoate CR, Larsen MC, Song YS, Maguire M, Sheibani N. Jefcoate CR, et al. Int J Mol Sci. 2025 Feb 25;26(5):2011. doi: 10.3390/ijms26052011. Int J Mol Sci. 2025. PMID: 40076634 Free PMC article.
  • A mild increase in nutrient signaling to mTORC1 in mice leads to parenchymal damage, myeloid inflammation and shortened lifespan.
    Ortega-Molina A, Lebrero-Fernández C, Sanz A, Calvo-Rubio M, Deleyto-Seldas N, de Prado-Rivas L, Plata-Gómez AB, Fernández-Florido E, González-García P, Vivas-García Y, Sánchez García E, Graña-Castro O, Price NL, Aroca-Crevillén A, Caleiras E, Monleón D, Borrás C, Casanova-Acebes M, de Cabo R, Efeyan A. Ortega-Molina A, et al. Nat Aging. 2024 Aug;4(8):1102-1120. doi: 10.1038/s43587-024-00635-x. Epub 2024 Jun 7. Nat Aging. 2024. PMID: 38849535 Free PMC article.
  • Hepatic stellate cells control liver zonation, size and functions via R-spondin 3.
    Sugimoto A, Saito Y, Wang G, Sun Q, Yin C, Lee KH, Geng Y, Rajbhandari P, Hernandez C, Steffani M, Qie J, Savage T, Goyal DM, Ray KC, Neelakantan TV, Yin D, Melms J, Lehrich BM, Yasaka TM, Liu S, Oertel M, Lan T, Guillot A, Peiseler M, Filliol A, Kanzaki H, Fujiwara N, Ravi S, Izar B, Brosch M, Hampe J, Remotti H, Argemi J, Sun Z, Kendall TJ, Hoshida Y, Tacke F, Fallowfield JA, Blockley-Powell SK, Haeusler RA, Steinman JB, Pajvani UB, Monga SP, Bataller R, Masoodi M, Arpaia N, Lee YA, Stockwell BR, Augustin HG, Schwabe RF. Sugimoto A, et al. Nature. 2025 Apr;640(8059):752-761. doi: 10.1038/s41586-025-08677-w. Epub 2025 Mar 12. Nature. 2025. PMID: 40074890 Free PMC article.
  • HSDL2 links nutritional cues to bile acid and cholesterol homeostasis.
    Samson N, Bosoi CR, Roy C, Turcotte L, Tribouillard L, Mouchiroud M, Berthiaume L, Trottier J, Silva HCG, Guerbette T, Plata-Gómez AB, Besse-Patin A, Montoni A, Ilacqua N, Lamothe J, Citron YR, Gélinas Y, Gobeil S, Zoncu R, Caron A, Morissette M, Pellegrini L, Rochette PJ, Estall JL, Efeyan A, Shum M, Audet-Walsh É, Barbier O, Marette A, Laplante M. Samson N, et al. Sci Adv. 2024 May 31;10(22):eadk9681. doi: 10.1126/sciadv.adk9681. Epub 2024 May 31. Sci Adv. 2024. PMID: 38820148 Free PMC article.

References

    1. Trefts, E., Gannon, M. & Wasserman, D. H. The liver. Curr. Biol.27, R1147–R1151 (2017). - PMC - PubMed
    1. Martini, T., Naef, F. & Tchorz, J. S. Spatiotemporal Metabolic Liver Zonation and Consequences on Pathophysiology. Ann. Rev. Pathol. Mechan. Dis.1810.1146/annurev-pathmechdis-031521-024831 (2023). - PubMed
    1. Saxton, R. A. & Sabatini, D. M. mTOR signaling in growth, metabolism, and disease. Cell168, 960–976 (2017). - PMC - PubMed
    1. Valvezan AJ, Manning BD. Molecular logic of mTORC1 signalling as a metabolic rheostat. Nat. Metab. 2019;1:321–333. doi: 10.1038/s42255-019-0038-7. - DOI - PubMed
    1. Inoki K, Li Y, Xu T, Guan KL. Rheb GTPase is a direct target of TSC2 GAP activity and regulates mTOR signaling. Genes Dev. 2003;17:1829–1834. doi: 10.1101/gad.1110003. - DOI - PMC - PubMed

MeSH terms

Substances