. 2024 Mar 18;15(1):2370.
doi: 10.1038/s41467-024-45909-5.

Mesoscale DNA features impact APOBEC3A and APOBEC3B deaminase activity and shape tumor mutational landscapes

Affiliations

Mesoscale DNA features impact APOBEC3A and APOBEC3B deaminase activity and shape tumor mutational landscapes

Ambrocio Sanchez et al. Nat Commun. .

Abstract

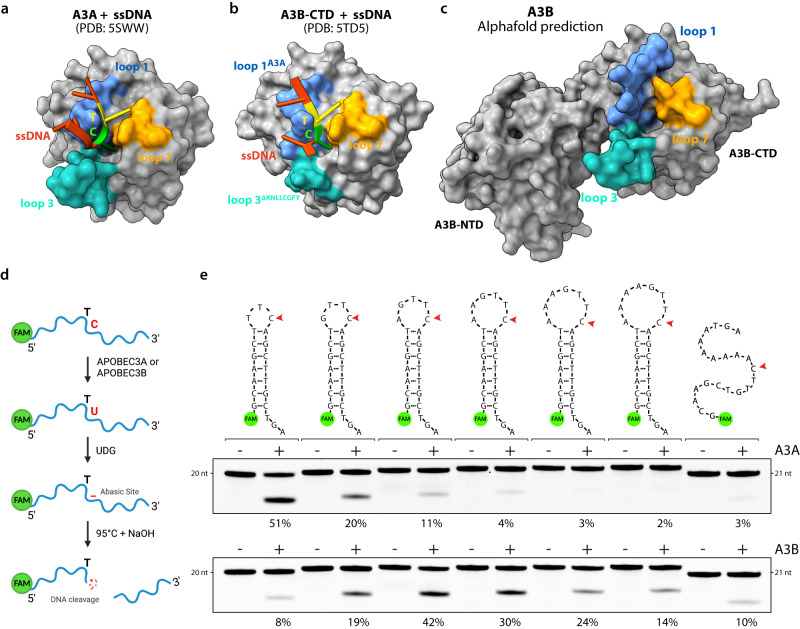
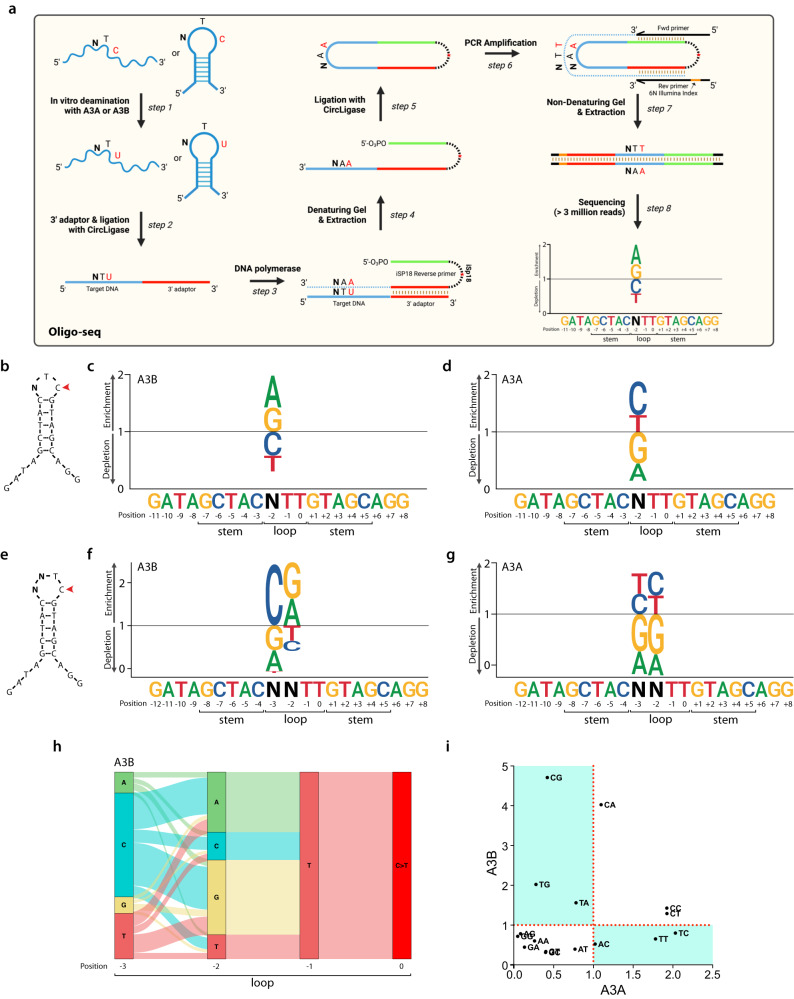
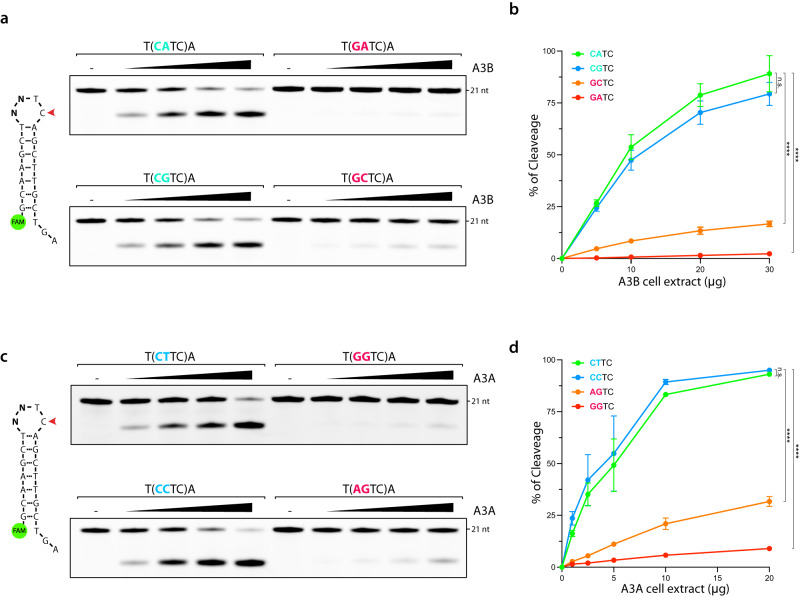
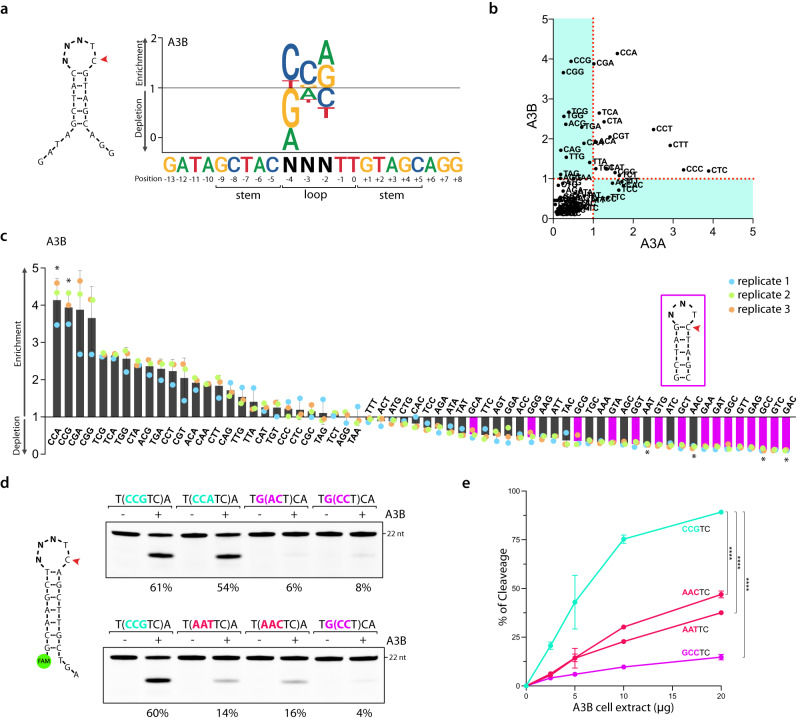
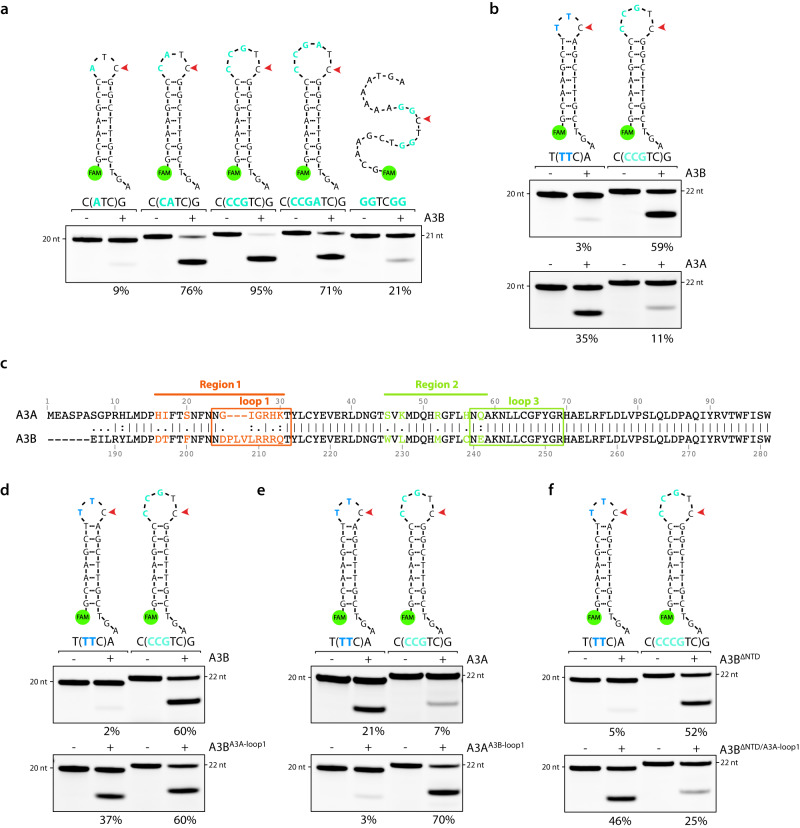
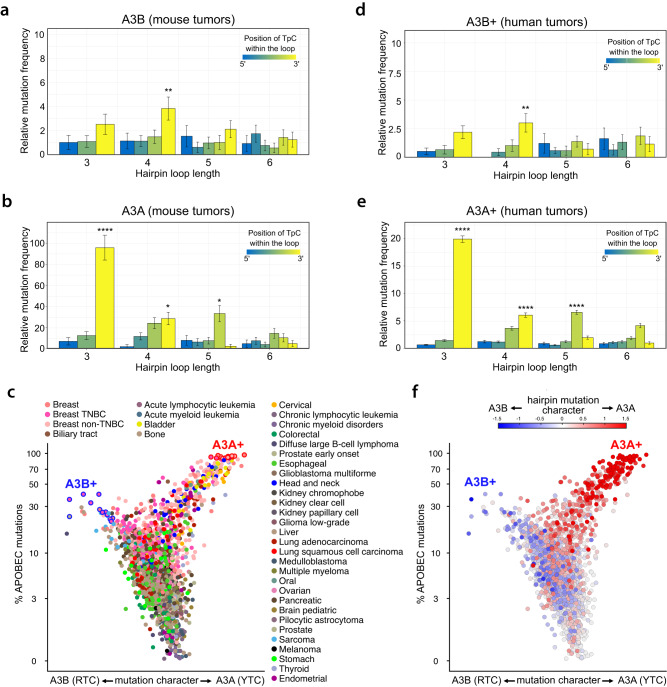
Antiviral DNA cytosine deaminases APOBEC3A and APOBEC3B are major sources of mutations in cancer by catalyzing cytosine-to-uracil deamination. APOBEC3A preferentially targets single-stranded DNAs, with a noted affinity for DNA regions that adopt stem-loop secondary structures. However, the detailed substrate preferences of APOBEC3A and APOBEC3B have not been fully established, and the specific influence of the DNA sequence on APOBEC3A and APOBEC3B deaminase activity remains to be investigated. Here, we find that APOBEC3B also selectively targets DNA stem-loop structures, and they are distinct from those subjected to deamination by APOBEC3A. We develop Oligo-seq, an in vitro sequencing-based method to identify specific sequence contexts promoting APOBEC3A and APOBEC3B activity. Through this approach, we demonstrate that APOBEC3A and APOBEC3B deaminase activity is strongly regulated by specific sequences surrounding the targeted cytosine. Moreover, we identify the structural features of APOBEC3B and APOBEC3A responsible for their substrate preferences. Importantly, we determine that APOBEC3B-induced mutations in hairpin-forming sequences within tumor genomes differ from the DNA stem-loop sequences mutated by APOBEC3A. Together, our study provides evidence that APOBEC3A and APOBEC3B can generate distinct mutation landscapes in cancer genomes, driven by their unique substrate selectivity.


Conflict of interest statement

R.B. has served as a compensated consultant for Pfizer and Health Advances. The remaining authors declare no competing interests.

Figures

Fig. 1
Fig. 1. APOBEC3A and APOBEC3B preferentially target U-shaped DNA.
a, b Molecular surface of the A3A and A3B-CTD in complex with ssDNA. The loops surrounding the active site have been color-coded as shown. PDB IDs shown for reference. c Molecular surface of A3B full-length predicted with AlphaFold Protein Structure Database. d Schematic of the in vitro assay for APOBEC cytidine deamination activity. Created with BioRender.com. e Deamination activity was monitored on the indicated DNA stem-loop substrates using 1 μg of HEK-293T whole cell extract expressing A3A or 30 μg of U2OS whole cell extract expressing endogenous A3B. The percentage of cleavage is indicated. Source data are provided as a Source Data file.
Fig. 2
Fig. 2. Oligo-seq, a sequencing-based in vitro assay to identify sequence contexts targeted by APOBEC3B and APOBEC3A.
a Schematic of the Oligo-seq assay. Created with BioRender.com. b Schematic of the 3-nt hairpin loop used to perform the Oligo-seq assay. N refers to any of the four DNA bases. A sequence logogram showing the fold enrichment and depletion for each of the four DNA bases at the −2 position after deamination of the cytosine by A3B (c) or A3A (d). e Schematic of the 4-nt hairpin loop used to perform the Oligo-seq assay. N refers to any of the four DNA bases. A sequence logogram showing the fold enrichment and depletion for each of the four DNA bases at the −2 position and −3 position after deamination of the cytosine by A3B (f) or A3A (g). h A river plot depicting the relative frequency of each nucleotide at the indicated position of a 4-nt hairpin loop and its association with the nucleotides located before or after. i Scatter plot of the fold enrichment and depletion for each of the 16 dinucleotide sequences possibly present in the 4-nt hairpin loop shown in (e). Source data are provided as a Source Data file.
Fig. 3
Fig. 3. Deamination of 4 nt hairpin loops by APOBEC3B and APOBEC3A is sequence context dependent.
a A3B deamination activity was performed with U2OS whole cell extract (5–30 μg) on 4-nt hairpin loops with the indicated loop sequences. The loop sequences are shown enclosed within parentheses. b Quantification of the A3B deamination activity shown in (a). Data are presented as mean values ± S.D. (Number of biological replicates, n = 3; n.s. not significant (p = 0.1803) and ****p < 0.0001 (two-tailed unpaired t-test)). c A3A deamination activity was performed with HEK-293T whole cell extract expressing A3A (1–20 μg) on 4-nt hairpin loops with the indicated loop sequences. The loop sequences are shown enclosed within parentheses. d Quantification of the A3A deamination activity shown in (c). Data are presented as mean values ± S.D. (Number of biological replicates, n = 3; n.s. not significant (p = 0.0942) and ****p < 0.0001 (two-tailed unpaired t-test)). Source data are provided as a Source Data file.
Fig. 4
Fig. 4. Identification and validation of 5-nt hairpin loop sequences preferentially targeted by APOBEC3B.
a A sequence logogram showing the fold enrichment and depletion for each of the four DNA bases at the −2, −3, and −4 position after deamination of the cytosine by A3B. b Scatter plot of the fold enrichment and depletion for each of the 64 trinucleotide sequences possibly present in the 5-nt hairpin loop shown in (a). c Bar graph showing the fold enrichment and depletion for each of the 64 trinucleotide sequences possibly present in the 5-nt hairpin loop shown in (a) after deamination by A3B. The purple-colored bars indicate 5 nt hairpin loop with sequences that form 3-nt hairpin loops. Asterisk (*) indicates the sequences validated in vitro (d). Data are presented as mean values ± S.D. (Number of biological replicates, n = 3). d A3B deamination activity assay was performed with 20 μg of U2OS whole cell extract expressing endogenous A3B, on indicated DNA stem-loop oligonucleotides. The loop sequences are shown enclosed within parentheses. The percentage of cleavage is indicated. e Quantification of the A3B deamination activity on the indicated oligonucleotides. The deamination assay was performed with U2OS whole cell extract (2.5–20 μg). Data are presented as mean values ± S.D. (Number of biological replicates, n = 3; ****p < 0.0001 (two-tailed unpaired t-test)). Source data are provided as a Source Data file.
Fig. 5
Fig. 5. Loop 1 of APOBEC3B and APOBEC3A defines their DNA substrate preference.
a A3B deamination activity was performed with 20 μg of U2OS whole cell extract on the indicated substrates. The loop sequences are shown enclosed within parentheses. The percentage of cleavage is indicated. b Deamination activity assay was performed with 20 μg of U2OS whole cell extract expressing A3B or 5 μg of HEK-293T whole cell extract expressing A3A on a 3-nt and 5-nt DNA stem-loop oligonucleotides preferentially targeted by A3A and A3B respectively. The loop sequences are shown enclosed within parentheses. The percentage of cleavage is indicated. c Alignment of the amino acid sequences for A3A (amino acid 1–98) with the C-terminus of A3B (amino acid 186 to 281). The amino acids that form loop 1 and loop 3 are enclosed in boxes. The highlighted color-coded residues indicate the amino acids that differ between A3B and A3A. The residue numbers at the top and bottom correspond to those found in the wild-type full-length A3A and A3B proteins. df. Deamination activity assay using the indicated constructs expressed in HEK-293T cells was monitored on both A3A’s and A3B’s preferred DNA stem-loop respectively. The percentage of cleavage is indicated. Source data are provided as a Source Data file.
Fig. 6
Fig. 6. APOBEC3B promotes mutations in hairpin-forming sequences in mouse and human tumors.
Relative mutation frequency in mouse tumor samples expressing A3B (a) or A3A (b). The relative mutation frequency was calculated as the ratio of the number of mutations to the number of available sites, and normalized so that the background mutations rate (at all C:G positions) is equal to 1. Mutation levels were classified in terms of the size of hairpin loops (x-axis) and by their position in the hairpin loop (color gradient). Error bars represent 95% confidence intervals. p-values were calculated by performing a binomial test for each group and we adjusted these p-values for multiple comparisons using the Benjamini & Hochberg method (**p = 4.93 × 10−3 for (a) and ****p = 2.62 × 10−31, *p = 4.11 × 10−2 and p = 2.48 × 10−2 for (b) [one-sided]). c Whole Genome Sequencing (WGS) of patient tumor samples were analyzed for their mutation frequency in the TpC motif. Each patient’s tumor samples were plotted by their level of mutations in the TpC motif and their mutation frequency in RTC versus YTC sequences. Samples with more than 500 mutations and with a fraction of POLE signature of less than 5% were sectioned (2644 tumors samples out of 3004). Dots were color-coded by tumor types. Relative mutation frequency in human tumor samples dominated by A3B mutation (d) or A3A mutations (e). Mutation levels were classified in terms of the size of hairpin loops (x-axis) and by their position in the hairpin loop (color gradient). Error bars represent 95% confidence intervals (**p = 7.10 × 10−3 for (d) and ****p = 0, p = 1.79 × 10−10, and p = 5.85 × 10−19 for (e) (one-sided)). f Patient tumor samples were plotted as described in (c). Dots were color-coded as a function of the A3A hairpin character (red colored dots) or A3A hairpin character (blue colored dots). Source data are provided as a Source Data file.

Update of

Similar articles

Cited by

References

    1. Swanton C, McGranahan N, Starrett GJ, Harris RS. APOBEC enzymes: mutagenic fuel for cancer evolution and heterogeneity. Cancer Discov. 2015;5:704–12. doi: 10.1158/2159-8290.CD-15-0344. - DOI - PMC - PubMed
    1. Harris, R. S. & Liddament, M. T. Retroviral restriction by APOBEC proteins. Nat. Rev. Immunol.4, 868–877. 10.1038/nri1489 (2004). - PubMed
    1. Pecori, R., Di Giorgio, S., Paulo Lorenzo, J. & Nina Papavasiliou, F. Functions and consequences of AID/APOBEC-mediated DNA and RNA deamination. Nat. Rev. Genet.10.1038/S41576-022-00459-8 (2022). - PMC - PubMed
    1. Harris, R. S. & Dudley, J. P. APOBECs and virus restriction. Virology479–480, 131–145. 10.1016/j.virol.2015.03.012 (2015). - PMC - PubMed
    1. Harris RS, et al. DNA deamination mediates innate immunity to retroviral infection. Cell. 2003;113:803–809. doi: 10.1016/S0092-8674(03)00423-9. - DOI - PubMed