. 2024 Mar 18;15(1):2426.
doi: 10.1038/s41467-024-46275-y.

Nuclei-specific hypothalamus networks predict a dimensional marker of stress in humans

Affiliations

Nuclei-specific hypothalamus networks predict a dimensional marker of stress in humans

Daria E A Jensen et al. Nat Commun. .

Abstract

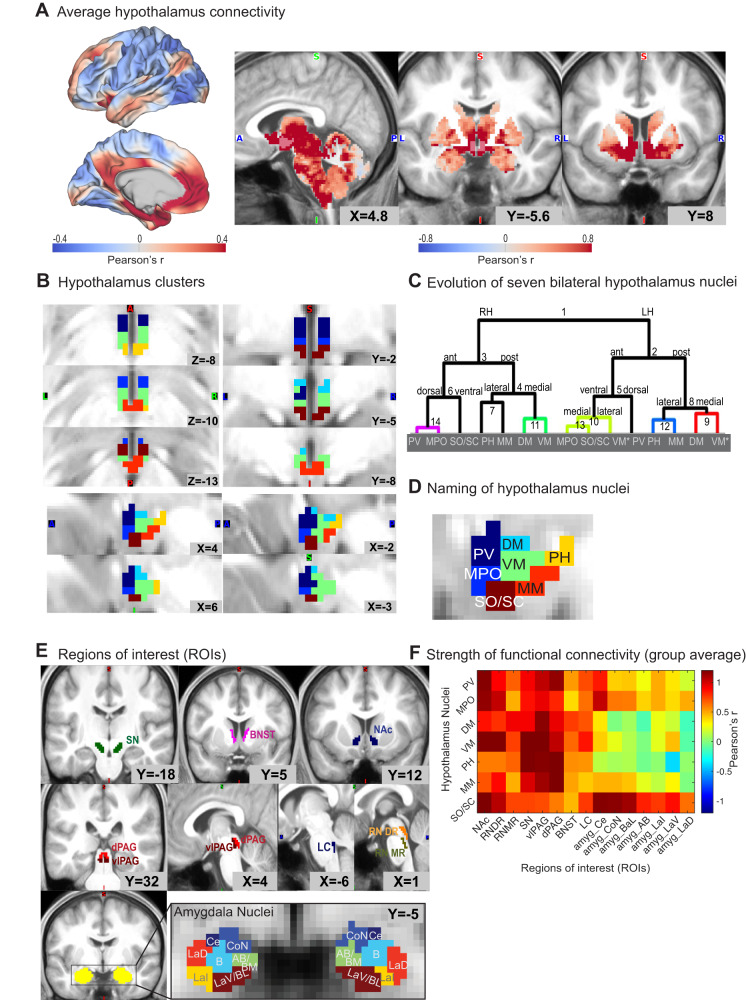
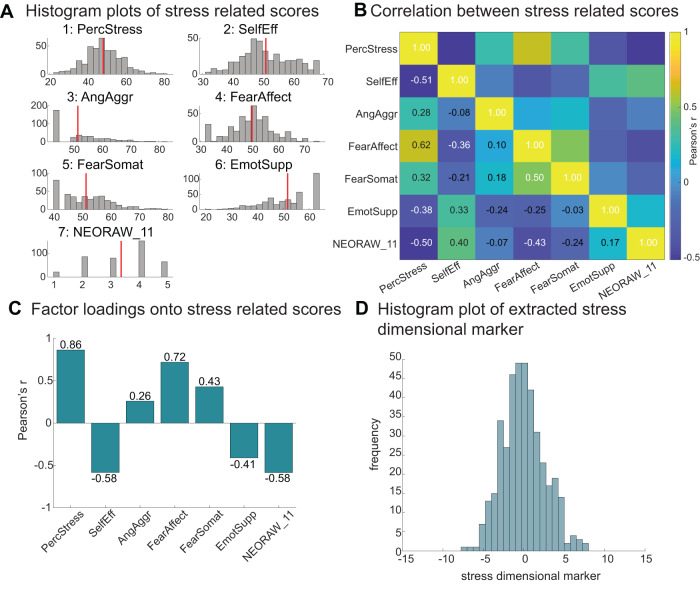
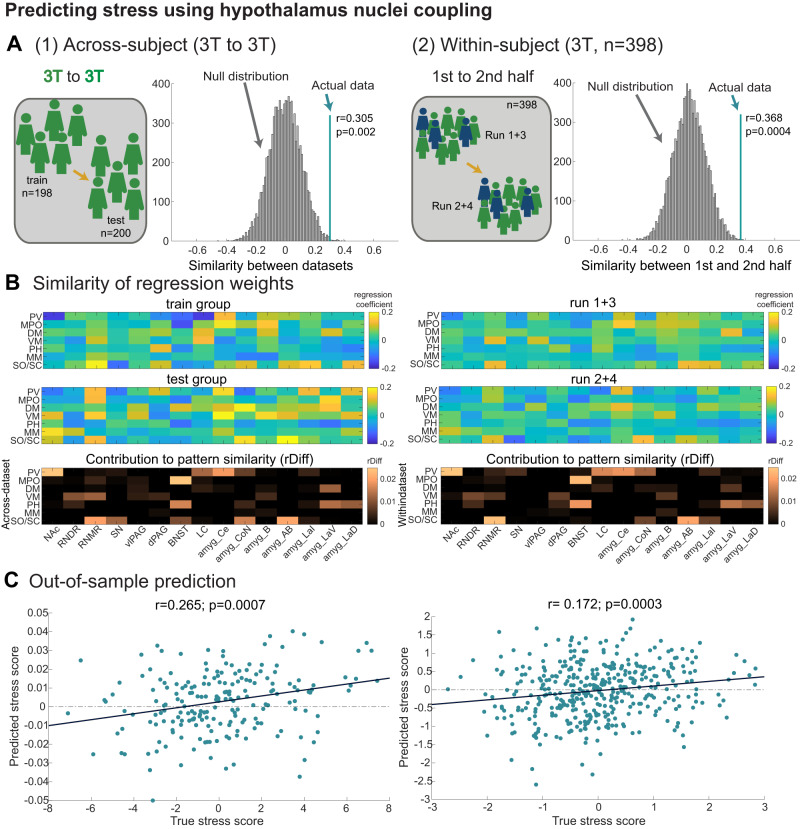
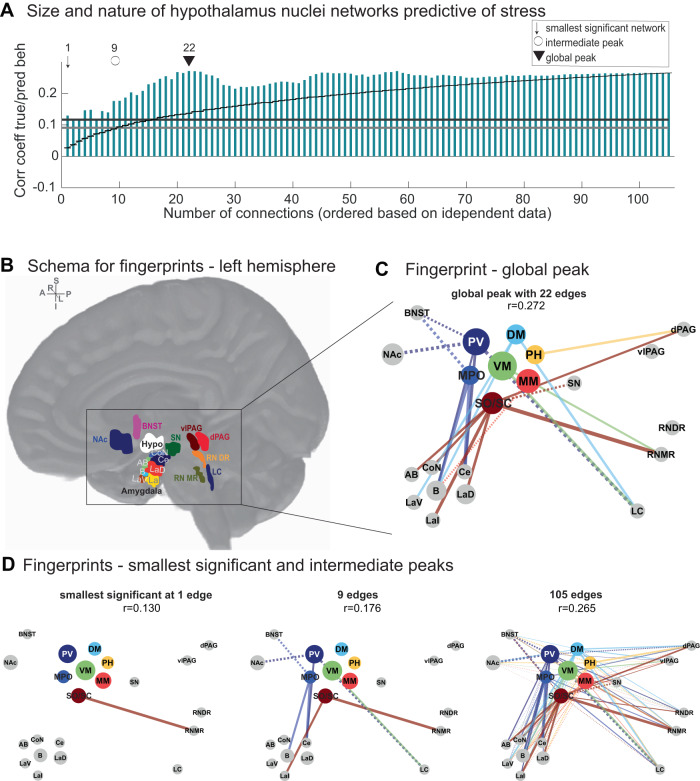
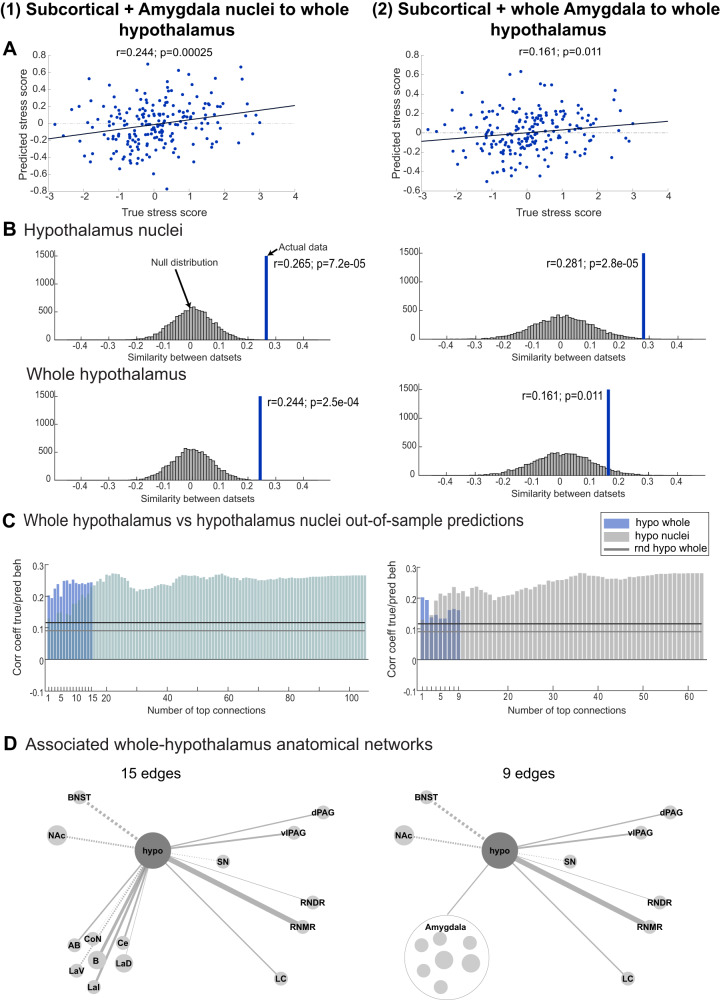
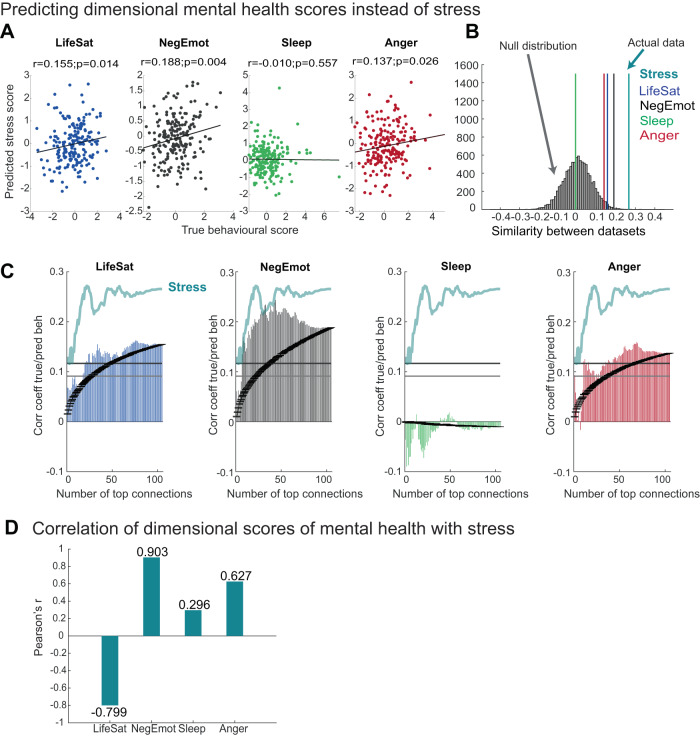
The hypothalamus is part of the hypothalamic-pituitary-adrenal axis which activates stress responses through release of cortisol. It is a small but heterogeneous structure comprising multiple nuclei. In vivo human neuroimaging has rarely succeeded in recording signals from individual hypothalamus nuclei. Here we use human resting-state fMRI (n = 498) with high spatial resolution to examine relationships between the functional connectivity of specific hypothalamic nuclei and a dimensional marker of prolonged stress. First, we demonstrate that we can parcellate the human hypothalamus into seven nuclei in vivo. Using the functional connectivity between these nuclei and other subcortical structures including the amygdala, we significantly predict stress scores out-of-sample. Predictions use 0.0015% of all possible brain edges, are specific to stress, and improve when using nucleus-specific compared to whole-hypothalamus connectivity. Thus, stress relates to connectivity changes in precise and functionally meaningful subcortical networks, which may be exploited in future studies using interventions in stress disorders.


Conflict of interest statement

The authors declare no competing interests.

Figures

Fig. 1
Fig. 1. Connectivity-based parcellation of the human hypothalamus.
A Group average hypothalamus-to-whole-brain functional connectivity extracted from resting-state fMRI data (n = 200 3 T HCP participants; colour scale: Pearson’s correlation coefficient; positive/negative functional connectivity: red/blue). The Hypothalamus outline is shown in semi-transparent colour; strong red values within the hypothalamus indicate strong autocorrelation of activity. B Parcellation of the human hypothalamus into seven nuclei (n = 200 3 T HCP participants): top left—horizontal, top right—coronal, bottom—sagittal for right and left hemispheres. The parcellation used hierarchical clustering of the similarity between hypothalamus voxels in terms of their whole-brain functional connectivity. Clusters show high symmetry across hemispheres and good agreement with prior high-resolution and post-mortem work in humans. This parcellation was used throughout the study but was also replicated in two independent datasets (n = 200 3 T and n = 98 7 T HCP participants; Supplementary Fig. 3). C Dendrogram of the hierarchical clustering shown in (b) shows the evolution of clusters up to depth 15. Intermediate parcellation steps are shown in Supplementary Fig. 2. D Putative naming of hypothalamus nuclei used throughout this study (illustrated for the right hemisphere at X = 4): PV paraventricular, MPO medial preoptic, DM dorsomedial, VM ventromedial, SO/SC supraoptic and suprachiasmatic, PH posterior, MM mammillary bodies. Number of voxels across both hemispheres: PV = 23, MPO = 10, DM = 9, VM = 28, PH = 10, MM = 15, SO/SC = 14 (hypothalamus total: 109). E Subcortical regions of interest (ROIs): substantia nigra (SN), bed nucleus of the stria terminalis (BNST), nucleus accumbens (NAc), dorsal and ventrolateral periaqueductal grey (dPAG/vlPAG), locus coeruleus (LC), dorsal and median raphe (RNDR, RNMR). For amygdala, the main analyses used individual nuclei (Figs. 3 and 4); control analyses used the whole amygdala (Fig. 5). F Group average functional connectivity between hypothalamus nuclei and a priori ROIs for n = 200 3 T participants (replicated in two further datasets: n = 200 3 T or n = 98 7 T; Supplementary Fig. 1; colour bar: Pearson’s r). Source data for 1b-e are provided as a Source Data file. A anterior, P posterior, S superior, I inferior, L left, R right, amygdala nuclei: Ce central, CoN cortical, B basal, AB/BM auxiliary basal/basomedial, LaI lateral intermediate, LaD lateral dorsal, LaV/BL lateral ventral/basolateral.
Fig. 2
Fig. 2. Extracting a dimensional marker of prolonged stress.
A Histograms show distributions for seven stress-related scores in n = 400 3 T HCP participants that were entered into a factor analysis as shown in panel C. B Correlations between the seven stress-related scores across all n = 400 participants (colour bar denotes Pearson’s r). C Factor analysis was used to extract a one-dimensional marker of stress: shown are the loadings onto the seven stress-related scores. The highest loadings are with perceived stress (PercStress), fear (FearAffect), self-efficacy (SelfEff, negative loading) and the ability to cope with stress (NEORAW_11, negative loading: When I’m under a great deal of stress, sometimes I feel like I’m going to pieces). Intermediate loadings were with anger aggression (AngAggr, positive loading), somatic fear (FearSomat, positive loading), and emotional support (EmotSupp, negative loading). The factor analysis was replicated in an independent dataset (Supplementary Fig. 4). D Distribution of the derived dimensional marker of stress generated from the factor analysis for all n = 400 3 T participants; the n = 98 7 T participants had reduced stress variance (see Supplementary Fig. 4).
Fig. 3
Fig. 3. Relating stress to interindividual variation in hypothalamus nuclei connectivity.
A Relationships between stress scores and hypothalamus connectivity were robust and replicable. We used robust regressions to characterise relationships between the functional connectivity in each edge (7 hypothalamus nuclei x 15 ROIs) and stress and tested whether the resulting patterns of regression coefficients (shown in panel B) were more similar than expected by chance. This was true (1) across two 3 T datasets (left: n = 198 train and n = 200 test participants; one-sided p-values from a non-parametric test using permutation null distributions) and (2) within subjects when comparing patterns extracted from the 1st and 2nd half of each individual’s data (right: n = 398 combined 3 T participants, run 1 + 3 versus run 2 + 4; one-sided p-values from a non-parametric test using permutation null distributions). Null distributions were generated using 10,000 iterations of shuffled stress scores. Note that the split into train and test groups was performed to achieve comparable stress distributions (Supplementary Fig. 4C). B Visualisation of robust regression coefficients capturing relationships with stress (1) across test and train 3 T datasets (left: top and middle row) and (2) across run 1 + 3 vs. run 2 + 4 (right: top and middle row). This illustrates the similarity of the patterns statistically evaluated in panel A. We extracted the contribution of each edge to this similarity by calculating the difference in correlation coefficient between the patterns obtained when excluding this edge versus including all edges (rDiff, bottom row). Visual inspection of rDiff values highlights strong similarities between the two replications (left vs right) and thus anatomical specificity. C Regression coefficients estimated from the training group were applied to the functional connectivity of the test group (left) to calculate predicted stress scores. This showed significant out-of-sample predictions of true stress scores (independent one-sided correlations to assess the positive relationship between predicted and true stress scores). The same was true when repeating the procedure using the first and second half of data (first half of each session: run 1 + 3 against the second half of each session: run 2 + 4). Source data for 3A, B are provided as a Source Data file. Abbreviations as in Fig. 1.
Fig. 4
Fig. 4. Anatomical features of hypothalamus networks predictive of stress.
A Prediction of stress scores obtained using subsets containing between 1 and 105 edges. Edges were included in order of importance (absolute robust regression coefficients) estimated from the training group (n = 198). As in Fig. 3, weights were applied to test participants’ functional connectivity values to predict stress scores, but this time with increasing numbers of edges. Prediction accuracies (coloured bars) are shown as the correlation between true and predicted stress scores in the test participants (n = 200), but were only statistically evaluated at the peak (black triangle: ‘global peak’) and to derive the smallest number of edges that reached a significant out-of-sample prediction (black arrow, ‘smallest significant network’; see Methods for generation of null distributions using permutation; for precise one-sided p-values in each case, see Results); black curve indicates performance using a given number of edges (on x) but included in random order (n  =  10,000 shuffles; error bars denote s.e.m.); black line at r = 0.1167 indicates the threshold for significance at P  <  .05 purely for visualisation (grey line: P  <  0.1, r = 0.0911). A subset of all 105 hypothalamus-to-ROI edges was sufficient to achieve a significant out-of-sample prediction. A significant prediction could be achieved using only the first edge (SO/SC to RNMR). The best prediction was achieved using 22 edges (r = .272). B Schematic for the arrangement of connectivity fingerprints. C Fingerprint highlights anatomical edges associated with the global peak (22 edges). Fingerprints show hypothalamus nuclei in the centre (colour-coded); ROIs are positioned roughly according to their anatomical location. Line width denotes the size of the absolute regression coefficient in the training dataset; line style denotes its sign (continuous, positive; dashed, negative). D Further fingerprints are shown for the smallest significant network (1 edge) and for one arbitrarily chosen intermediate step at 9 edges, and using all 105 edges, for visualisation. The mean baseline connectivity for all 105 edges as well as the corresponding scatterplots are shown in Supplementary Fig. 5. Source data for 4A, C, D are provided as a Source Data file. Abbreviations are as in Fig. 1.
Fig. 5
Fig. 5. Parcellating the hypothalamus improves predictions of stress.
Sensitivity of whole-hypothalamus as opposed to nuclei-specific hypothalamus connectivity was established using two control analyses: (1) using the original 15 ROIs (left column) and (2) using the original ROIs but replacing 7 amygdala nuclei by one whole amygdala mask (9 ROIs, right column). A Out-of-sample predictions of test group participants using weights estimated on the training group (as in Figs. 3C and 4A, n = 198 and n = 200) were significant based on whole-hypothalamus connectivity both when using amygdala nuclei or whole amygdala connectivity (one-sided correlations to assess positive relationships). B However, regression coefficients were reduced in both cases (bottom row) compared to the equivalent prediction using hypothalamus nuclei-specific functional connectivity (top row), even when correcting for the difference in the number of predictors (one-sided p-values from non-parametric test using permutation null distributions, see Methods). C As in Fig. 4A we generated predictions using increasing numbers of edges (coloured bars): left: whole hypothalamus x ROIs (1 × 15) vs. nuclei version (7 × 15 = 105); right: whole hypothalamus + whole amygdala ROIs (1 × 9) vs. nuclei version (7 × 9 = 63). Peak predictions were higher in both cases when using hypothalamus nuclei and highest overall when subdividing both hypothalamus and amygdala into their component nuclei (left: 22 edges: r = 0.272; right: 36 edges, r = 0.282). D Fingerprints associated with the predictions using all 15 (left) and 9 (right) whole-hypothalamus edges; on the right, the amygdala was also treated as a single structure. The highest contributing edge was hypothalamus coupling with RNMR in both cases. Source data for 5BD are provided as a Source Data file. rnd randomised, NAc nucleus accumbens, BNST bed nucleus of the stria terminalis, SN substantia nigra, dPAG dorsal periaqueductal grey, vlPAG ventrolateral PAG, RNDR dorsal raphe nuclei, RNMR median raphe nuclei, LC locus coeruleus, Ce central amygdala nucleus, CoN cortical amygdala nuclei, B basal amygdala nucleus, AB/BM auxiliary basal or basomedial amygdala nucleus, LaI lateral intermediate amygdala nuclei, LaD lateral dorsal amygdala nuclei, LaV/BL lateral ventral portion containing portions of basolateral amygdala nucleus.
Fig. 6
Fig. 6. Behavioural specificity of hypothalamus connectivity predictions for stress.
A Out-of-sample predictions were achieved using nuclei-specific hypothalamus connectivity (all 105 edges as in Fig. 3C) for four alternative mental health dimensions: life satisfaction (LifeSat), negative emotions (NegEmot), Sleep and Anger (see ref. for details). Significant predictions were achieved for Lifesat, NegEmot, and Anger, but not Sleep (one-sided correlations to assess positive relationships). B However, in all cases, prediction accuracies were lower than those achieved for stress, showing hypothalamus connectivity is particularly meaningful for stress. C Predictions achieved with increasing numbers of connections (as in Figs. 4A and 5C) show overall greater predictions for stress (turquoise line) compared to the four alternative dimensional scores when considering the peak and the smallest predictive network. D Correlations between dimensional control scores and stress scores show some shared variance, in particular for life satisfaction (negative) and negative emotions. Source data for 6B, C are provided as a Source Data file.

Similar articles

Cited by

References

    1. Scangos KW, State MW, Miller AH, Baker JT, Williams LM. New and emerging approaches to treat psychiatric disorders. Nat. Med. 2023;29:317–333. doi: 10.1038/s41591-022-02197-0. - DOI - PMC - PubMed
    1. Huys QJM, Maia TV, Frank MJ. Computational psychiatry as a bridge from neuroscience to clinical applications. Nat. Neurosci. 2016;19:404–413. doi: 10.1038/nn.4238. - DOI - PMC - PubMed
    1. Insel T, et al. Research domain criteria (RDoC): toward a new classification framework for research on mental disorders. Am. J. Psychiatry. 2010;167:748–751. doi: 10.1176/appi.ajp.2010.09091379. - DOI - PubMed
    1. Marquand AF, et al. Conceptualizing mental disorders as deviations from normative functioning. Mol. Psychiatry. 2019;24:1415–1424. doi: 10.1038/s41380-019-0441-1. - DOI - PMC - PubMed
    1. Klein-Flügge, M. C. et al. Relationship between nuclei-specific amygdala connectivity and mental health dimensions in humans. Nat. Hum. Behav. 10.1038/s41562-022-01434-3 (2022). - PMC - PubMed

MeSH terms