. 2024 Mar 18;9(1):12.
doi: 10.1038/s41536-024-00356-0.

Multichannel bridges and NSC synergize to enhance axon regeneration, myelination, synaptic reconnection, and recovery after SCI

Affiliations

Multichannel bridges and NSC synergize to enhance axon regeneration, myelination, synaptic reconnection, and recovery after SCI

Usha Nekanti et al. NPJ Regen Med. .

Abstract

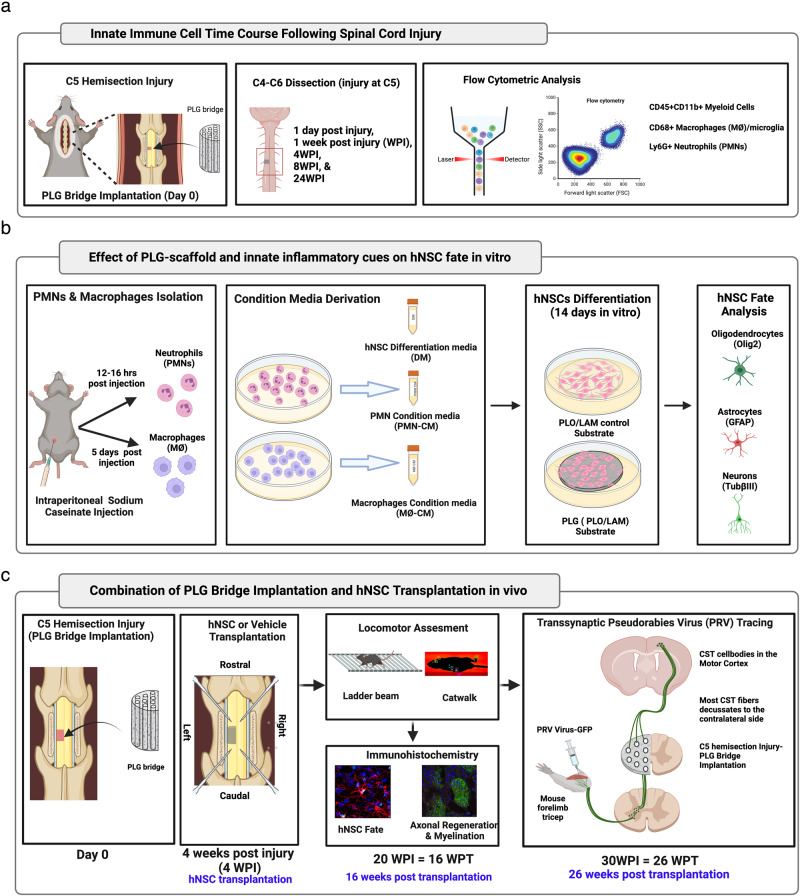
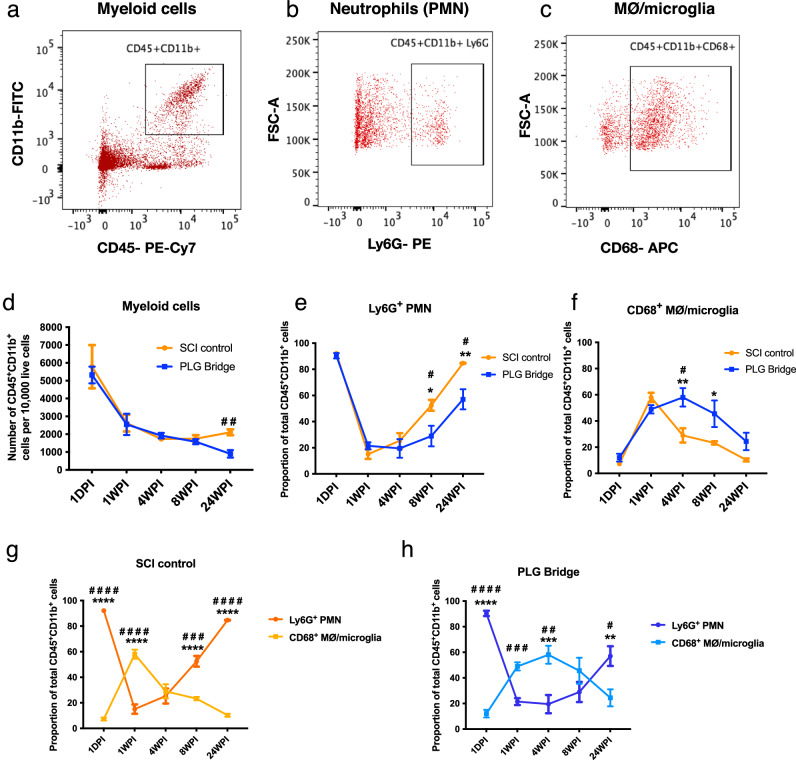
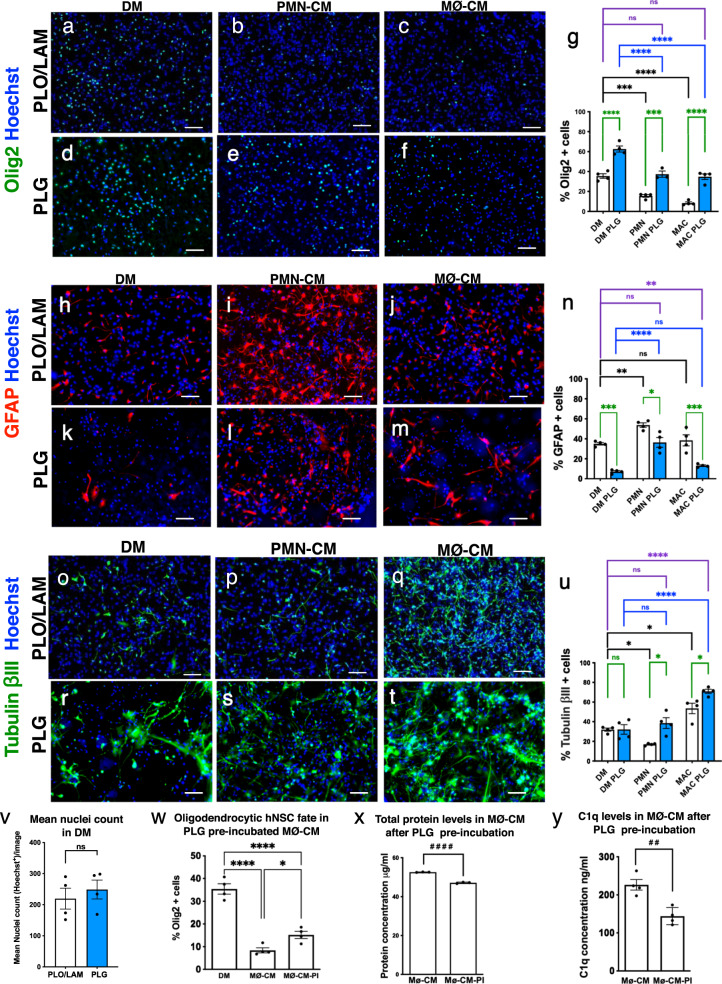
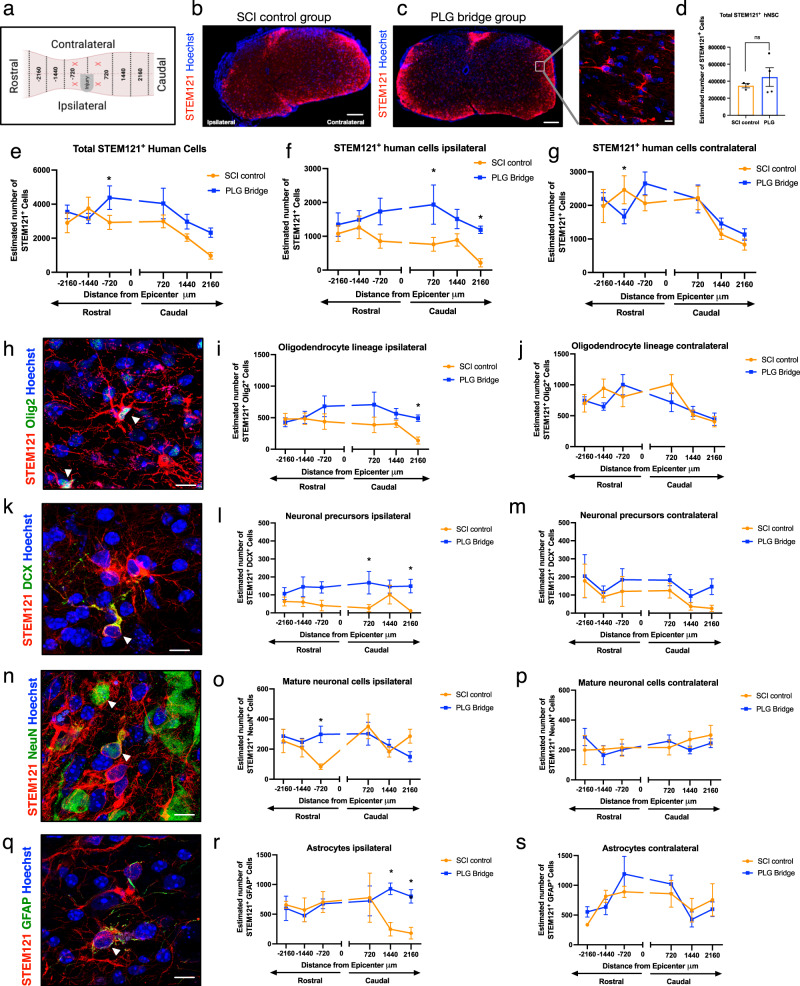
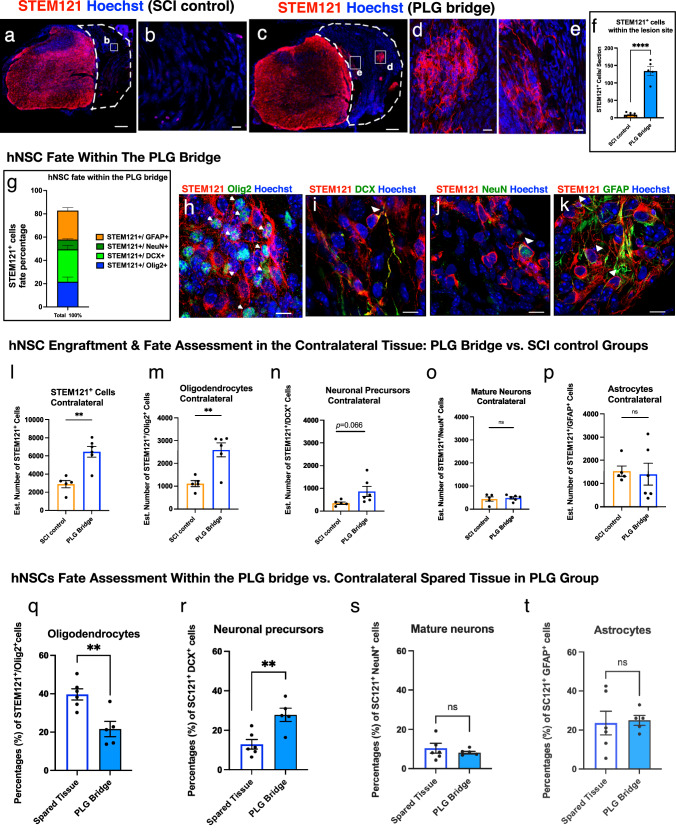
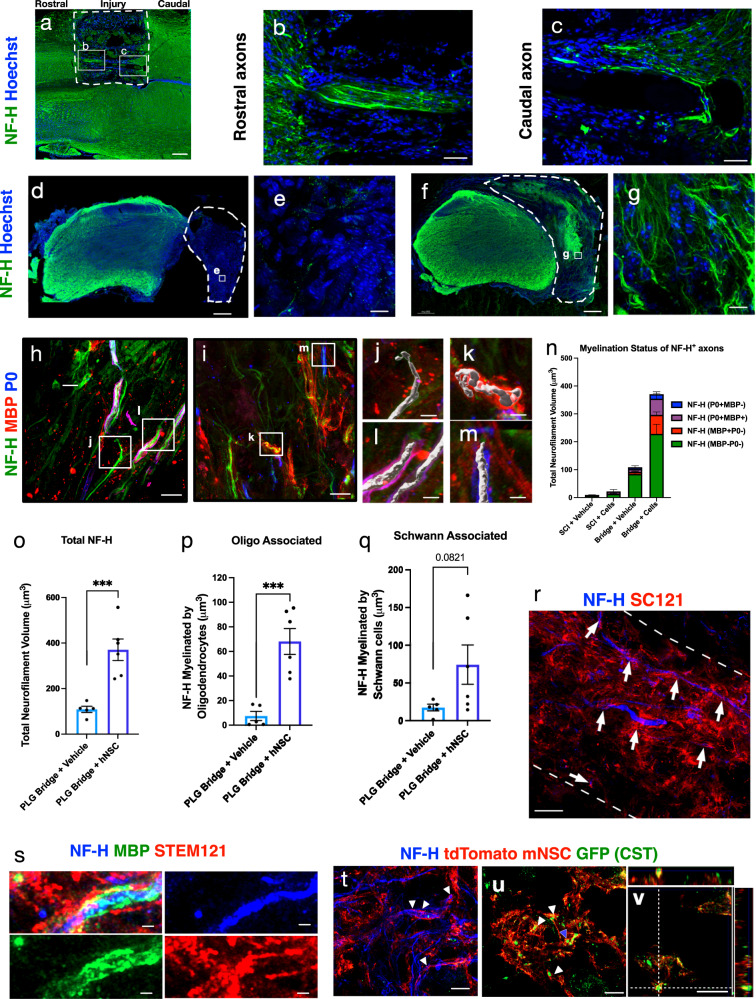
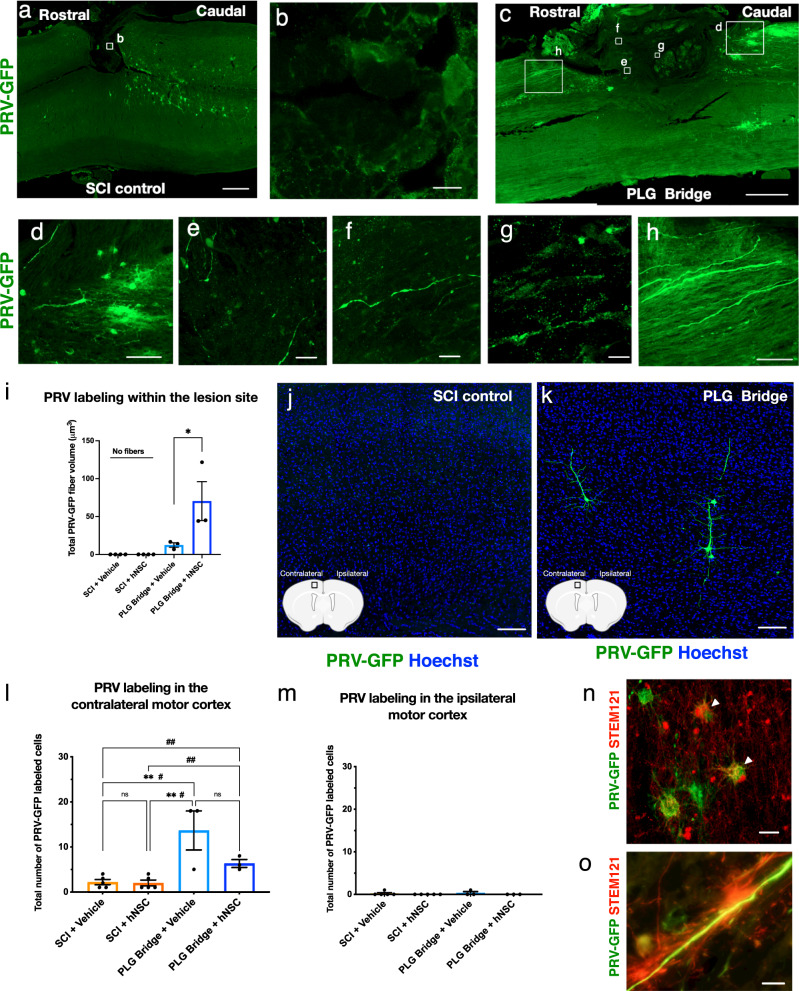
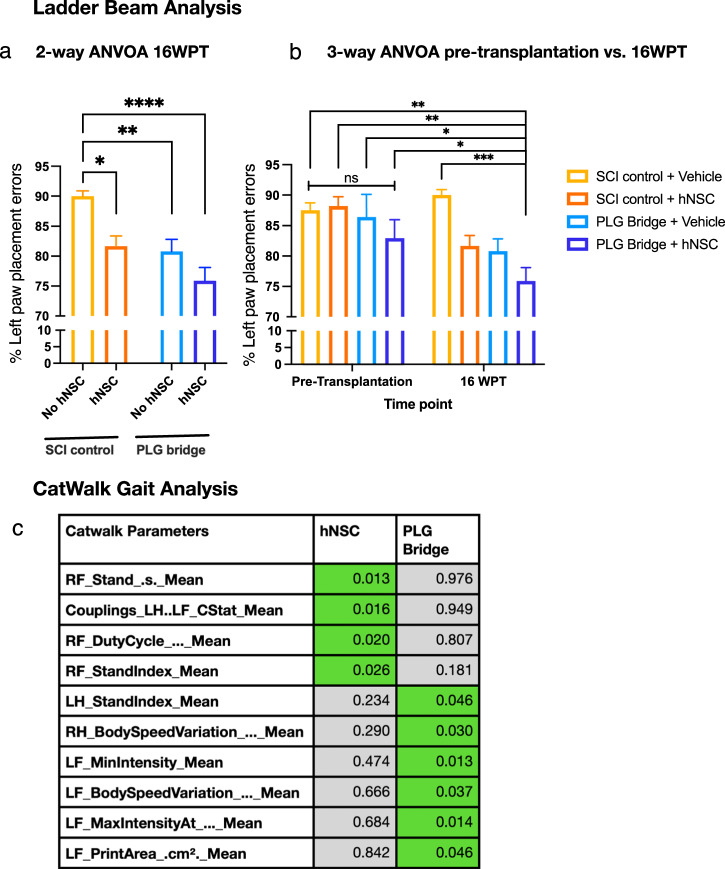
Regeneration in the injured spinal cord is limited by physical and chemical barriers. Acute implantation of a multichannel poly(lactide-co-glycolide) (PLG) bridge mechanically stabilizes the injury, modulates inflammation, and provides a permissive environment for rapid cellularization and robust axonal regrowth through this otherwise inhibitory milieu. However, without additional intervention, regenerated axons remain largely unmyelinated (<10%), limiting functional repair. While transplanted human neural stem cells (hNSC) myelinate axons after spinal cord injury (SCI), hNSC fate is highly influenced by the SCI inflammatory microenvironment, also limiting functional repair. Accordingly, we investigated the combination of PLG scaffold bridges with hNSC to improve histological and functional outcome after SCI. In vitro, hNSC culture on a PLG scaffold increased oligodendroglial lineage selection after inflammatory challenge. In vivo, acute PLG bridge implantation followed by chronic hNSC transplantation demonstrated a robust capacity of donor human cells to migrate into PLG bridge channels along regenerating axons and integrate into the host spinal cord as myelinating oligodendrocytes and synaptically integrated neurons. Axons that regenerated through the PLG bridge formed synaptic circuits that connected the ipsilateral forelimb muscle to contralateral motor cortex. hNSC transplantation significantly enhanced the total number of regenerating and myelinated axons identified within the PLG bridge. Finally, the combination of acute bridge implantation and hNSC transplantation exhibited robust improvement in locomotor recovery. These data identify a successful strategy to enhance neurorepair through a temporally layered approach using acute bridge implantation and chronic cell transplantation to spare tissue, promote regeneration, and maximize the function of new axonal connections.


Conflict of interest statement

The authors declare no competing interests.

Figures

Fig. 1
Fig. 1. Experimental design schematic.
a Quantitative innate immune cell profiling in the presence of PLG bridge following SCI. Schematic shows C5 hemisection injury and implantation of PLG bridge at the lesion site. C4 to C6 spinal cord segments (injury at C5) were dissected at the following time points post-injury, 1 day post-injury (DPI), 1 week post-injury (WPI), 4 WPI, 8 WPI, and 24 WPI. Dissected spinal cord tissues were processed for flow cytometric analysis to quantify innate immune cell profiling in C57BL/6 (Fig. 2) and Rag1 (Supplemental Fig. 2) mice. b In vitro analysis of PLG scaffold and innate immune cues on hNSC cell fate. Polymorphonuclear neutrophils (PMN) and macrophages (MØ) were isolated from the peritoneal cavity of Rag1 immunodeficient mice stimulated with 12% sodium caseinate (i.p.). PMN and MØ were subsequently cultured in hNSC differentiation medium (DM), and respective conditioned media (PMN-CM, MØ-CM) was collected. hNSC were differentiated on PLO/LAM (control substrate) and PLG scaffold in the presence of DM, PMN-CM, and MØ-CM. hNSC fate was quantified using Imaris software following immunocytochemistry. c Timeline for the combinatorial approach of PLG bridge implantation and hNSC transplantation in Rag1 immunodeficient mice. Mice received a C5 left hemisection injury with immediate PLG bridge implantation and coverage of the dorsal surface with gel foam; SCI control mice received only gel foam. 4 WPI, mice received either vehicle injection or hNSC transplantation into the spared tissue parenchyma at four sites, two rostral and two caudal to the lesion site. Mice were randomly distributed into SCI control vs. PLG bridge groups at the time of initial surgery, and into the vehicle vs. hNSC groups on the day of transplantation. hNSC fate and distribution, host axonal regeneration, myelination status, and locomotor recovery were analyzed at 16 weeks post-transplantation (WPT). Finally, transsynaptic PRV retrograde tracing was performed at 26 WPT (30 WPI) to investigate synaptic connectivity of regenerated axons.
Fig. 2
Fig. 2. PLG bridge implantation modulates innate immune cell response and time course in the injured C57B/6 mouse spinal cord.
ac Representative flow cytometry plot shows gating for the total myeloid population (CD45+ CD11b+), and the myeloid population was further gated for Ly6G+ neutrophils (PMN) and CD68+ macrophage (MØ)/microglia subpopulations. d The total myeloid cell population infiltration in the SCI control (orange) group and PLG (blue) groups over time. e, f Proportions of PMN (b) and MØ/microglia (c) subpopulations were shown over time. g Comparison of the Ly6G+ PMN (dark orange circle line) and MØ/microglia (light orange square line) ratios in the SCI control group. h Comparison of the Ly6G+ PMN (dark blue circle line) and MØ/microglia (light blue square line) ratios in the PLG group. Comparisons showing * are using two-way ANOVA, followed by the Sidak test (****p ≤ 0.0001, ***P ≤ 0.001, **P ≤ 0.01, *P ≤ 0.05). Comparisons showing # are using unpaired t-tests two-tailed at each time point (####p ≤ 0.0001, ###P ≤ 0.001, ##P ≤ 0.01, #P ≤ 0.05). Graphs represent Mean ± SEM; n = 4–5 mice/group.
Fig. 3
Fig. 3. PLG substrate alters hNSC fate at baseline and in response to immune cues in vitro, enhancing oligodendroglial fate.
au Representative images and quantification of hNSC differentiation profile on either PLO/LAM or PLG substrate with differentiation medium (DM), PMN conditioned medium (PMN-CM), and macrophage conditioned medium (MØ-CM). Quantitative comparisons were performed for the following markers. ag Oligodendrocytic fate. hn Astrocytic fate. ou Neuronal fate. Statistical analysis One-way ANOVA, followed by Tukey post hoc tests (****p ≤ 0.0001, ***P ≤ 0.001, **P ≤ 0.01, and *P ≤ 0.05). Graphs show Mean ± SEM; N = 3–4 biological replicates/condition. Black lines: DM control vs. PMN-CM and MØ-CM on PLO/LAM substrate. Blue lines: DM control vs. PMN-CM and MØ-CM on PLG substrate. Green lines: PLO/LAM vs. PLG substrate. Purple lines: PLG-CM vs. PLO/LAM-DM control. v Hoechst nuclei counts of hNSC differentiated in the presence of PLG scaffold vs. PLO/LAM control revealed no significant differences by substrate. The graph shows Mean ± SEM; unpaired t-test two-tailed P = 0.5404. wy Sequestration of immune cues by PLG was investigated using MØ-CM collected after preincubation with PLG scaffold (MØ-CM-PI). w Preincubation (PI) of MØ-CM with PLG scaffold partially restored hNSC oligodendrocytic fate on PLO/LAM substrate. Comparisons showing * using One-way ANOVA (P < 0.0001), followed by Tukey post hoc tests (****p ≤ 0.0001 and *P ≤ 0.05). x MØ-CM total protein levels were significantly reduced by preincubation with PLG scaffold, indicating protein binding to the PLG substrate. y MØ-CM C1q protein was significantly reduced by preincubation with PLG scaffold, indicating binding to the PLG substrate. Groups were compared using unpaired Student’s t-test two-tailed (####p ≤ 0.0001 and ##P ≤ 0.01), as shown. Scale bar: 100 μm. Graphs show Mean ± SEM; n = 3–4 biological replicates/condition.
Fig. 4
Fig. 4. Stereological analysis of hNSC fate and distribution along the spinal cord.
a Schematic of spinal cord injury, showing the lesion epicenter at C5 and indications of coordinates in µm. ‘X’ represents locations of hNSC transplantation at two injection sites rostral and two sites caudal to the lesion epicenter. Ipsilateral refers to the same side as the lesion, and contralateral refers to the side opposite the lesion. Dashed lines represent rostral-caudal axis binning used for histological quantification (720, 1440, 2160 microns from lesion epicenter). b, c Representative images of a coronal spinal cord section showing the distribution of STEM121+ transplanted human hNSC (red) and total cell nuclei (blue) in the SCI control group (b) and PLG bridge group (c); inset shows higher power. d Stereological quantification of the total number of STEM121+ cells in rostral and caudal regions in PLG and SCI control groups. The graph represents Mean ± SEM. Statistical analysis by unpaired Student’s two-tailed t-tests. eg Distribution of transplanted STEM121+ hNSC in the spinal cord: e ipsilateral and contralateral combined; f ipsilateral; and g contralateral. hs Representative images and quantification for cell fate. STEM121+/OLIG2+ oligodendrocytes: h Immunostaining; i ipsilateral; j contralateral. STEM121+/DCX+ neuronal precursors: k Immunostaining; l ipsilateral; m contralateral. STEM121+/NeuN+ mature neurons: n Immunostaining; o ipsilateral; p contralateral. STEM121+/GFAP+ astrocytes: q Immunostaining; r ipsilateral; s contralateral. Statistical analysis by unpaired Student’s two-tailed t-tests (*p ≤ 0.05, **p ≤ 0.005; Mean ± SME; n = 3–6/group). Scale bars: b, c 200 μm; c-inset, h, k, n, q 10 μm.
Fig. 5
Fig. 5. PLG bridge implantation creates a permissive environment for hNSC engraftment and enhances oligodendroglial and neuronal fate.
a No hNSC engraftment was observed in the spinal cord lesion site for the SCI control group; inset b shows higher power (scale bars as indicated). c Numerous hNSC migrated into biomaterial channels in the PLG group; insets d, e show higher power. White dashed lines outline the lesion site. f Quantification of total STEM121+ hNSC comparing SCI control and PLG groups. Because donor cell distribution was not homogenous within the control and PLG bridge, we manually quantified the total number of cells per 30 µm tissue section. g Quantification of hNSC fate within the PLG bridge. Data represents the percentage of each lineage. Representative images of hNSC fate in the PLG bridge for: h STEM121+/Olig2+ oligodendrocytes; i STEM121+/DCX+ neuronal precursors; j STEM121+/NeuN+ mature neurons; and k STEM121+/GFAP+ astrocytes. l Quantification of total STEM121+ hNSC in the spared tissue contralateral to the lesion/bridge implantation site. mp Quantification of hNSC fate in the contralateral side comparing control and PLG groups. qt Comparison of proportional hNSC fate within the bridge (data from g) to hNSC fate within the spared contralateral side of the same section (data from mp). Statistical analysis by unpaired two-tailed t-tests (**p ≤ 0.005, ****p ≤ 0.0001; Mean ± SEM); n = 5–6/group). Scale bars: a, c 200 μm; b, d, e, hk 10 μm.
Fig. 6
Fig. 6. Combination of PLG bridge implantation and hNSC transplantation enhances axonal regeneration and oligodendrocytic myelination.
ag Immunostaining for total axonal regeneration (NF-H, green) counterstained with a nuclear marker (Hoechst, blue) of SCI control and PLG bridge implanted spinal cord sections. White dashed lines outline the lesion (ipsilateral side) and tissue interface in both control and PLG groups. a NF-H in a horizontal mouse spinal cord section (C5 left hemisection injury) in which the PLG bridge shows robust axonal regeneration from both the rostral and caudal parenchyma at 6WPI; b, c insets show higher power. d NF-H in a transverse spinal cord section in a SCI control mouse 16 WPT; e inset shows higher power. f NF-H in a transverse spinal cord section in a PLG bridge implanted mouse 16 WPT; g inset shows higher power. h, i Triple immunostaining for NF-H labeled axons (NF-H; green), oligodendrocyte-derived myelin (MBP; red) and Schwann cell myelin (P0; blue) in PLG bridge implanted spinal cord sections. Boxes indicate regions shown at higher magnification with 3D surface masks representing examples of unmyelinated axons (j quantified in n), oligodendrocyte myelinated axons (k quantified in n and p), and Schwann cell myelinated axons (l, m; quantified in n, q). n Total NF-H+ axon volume and axon proportional myelination status within the SCI control lesion and PLG bridge. The graph represents Mean ± SEM; n = 4–6 mice/group. o Total NF-H volume. p NF-H volume associated with oligodendrocyte myelin. q NF-H volume associated with Schwann cell myelin. Graphs represent Mean ± SEM; n = 5–6 mice/group. Statistical comparisons were conducted using unpaired Student’s t-tests two-tailed (***p ≤ 0.001). r STEM121+ processes (red) wrapped around NF-H axons (blue) in the middle of a channel at 26 WPT. s Co-localization of STEM121 (red) human-specific hNSC marker with MBP+ myelin (green) and NF-H+ axons (blue) in the PLG bridge at 26 WPT. t mT-mNSC exhibit close alignment with regenerated axons in the PLG bridge identified by NF-H+ (blue). u, v mT-mNSC exhibit close alignment with regenerated CST axons in the PLG bridge identified by CRYM-GFP+ (green). Scale bars: a, d, f 200 μm; b, c 50 μm; e, gi, r 10 μm; jm 2 μm; s 1 μm; tv 5 μm.
Fig. 7
Fig. 7. CST axons that regenerate through the PLG bridge are synaptically connected.
a Horizontal section showing PRV labeling (green) in the control group; inset b shows that PRV fibers were not observed in the SCI control lesion. c Horizontal section showing PRV labeling in the PLG group. Higher magnification insets show PRV+ fibers caudal to the PLG bridge (d); PRV+ regenerated fibers inside PLG bridge channels (eg); PRV+ fibers rostral to the PLG bridge (h). i Quantification of PRV labeling in the lesion site. Statistical analysis by unpaired Student’s t-tests one-tailed (*p < 0.044; n = 3 biological replicates/group; Mean ± SEM). j, k Representative image of PRV labeling in the contralateral motor cortex. j SCI control and k PLG bridge groups. l, m Quantification of total PRV-labeled CST cell bodies in the motor cortex. l contralateral motor context and m ipsilateral motor cortex. Statistical comparisons were conducted using one-way ANOVA, followed by Tukey post hoc tests (**P ≤ 0.01) and comparisons showing # are using unpaired t-tests two-tailed (#p ≤ 0.05, ##p ≤ 0.01; n = 3–5 biological replicates/group; Mean ± SEM). n STEM121+ cells (red) stained positive for PRV (GFP, green), suggest stable integration into host circuitry. o Representative image of STEM121+ processes (red) wraping around PRV fiber (green) suggests hNSC myelination of PRV-labeled host axon. Scale bars: a, c 500 μm; b 10 μm; d, h 100 μm; e, f 10 μm; g 5 μm; j, k 100 μm; n, o 10 μm.
Fig. 8
Fig. 8. PLG bridge implantation and hNSC transplantation improve locomotor recovery in a synergistic manner.
a Ladder beam data analysis showed a significant reduction in ipsilateral forepaw placement errors at 20 WPI (16 WPT) in the hNSC transplantation alone, PLG bridge implantation alone, and the combination of PLG bridge + hNSC groups. Statistical analysis via two-way ANOVA, followed by Tukey post hoc tests (*P ≤ 0.05, **P ≤ 0.01, and ****p ≤ 0.0001; n = 9–12 animals per group; Mean ± SEM). b Three-way ANOVA analysis of ladder beam data showed significant improvement in motor recovery only for the combination of PLG bridge implantation and hNSC transplantation. No significant differences in ladder beam performance were observed between the pre-transplantation groups. Three-way ANOVA, followed by Tukey post hoc tests (*P ≤ 0.05, **P ≤ 0.01, and ***p ≤ 0.001, Mean ± SEM; n = 9–12 animals per group). c Unbiased multivariate analysis identified a predominant effect of PLG bridge implantation on left (ipsilateral) limb function, and a predominant effect of hNSC transplantation on right (contralateral) limb function in CatWalk gait analysis at 16 WPT. LF left forelimb, RF right forelimb, LH left hindlimb, RH right hindlimb. Table of p values for two-way ANOVA analysis; n = 8–12 animals per group. CatWalk parameters highlighted in green have p value ≤0.05 for the effect of hNSC transplantation alone (Cells) vs. PLG bridge implantation alone (Bridge).

Update of

Similar articles

Cited by

References

    1. Fawcett JW, Schwab ME, Montani L, Brazda N, Muller HW. Defeating inhibition of regeneration by scar and myelin components. Handb. Clin. Neurol. 2012;109:503–522. doi: 10.1016/B978-0-444-52137-8.00031-0. - DOI - PubMed
    1. Anwar MA, Al Shehabi TS, Eid AH. Inflammogenesis of secondary spinal cord injury. Front. Cell Neurosci. 2016;10:98. doi: 10.3389/fncel.2016.00098. - DOI - PMC - PubMed
    1. Richardson PM, McGuinness UM, Aguayo AJ. Axons from CNS neurons regenerate into PNS grafts. Nature. 1980;284:264–265. doi: 10.1038/284264a0. - DOI - PubMed
    1. Bunge MB. Bridging areas of injury in the spinal cord. Neuroscientist. 2001;7:325–339. doi: 10.1177/107385840100700409. - DOI - PubMed
    1. Kadoya K, et al. Combined intrinsic and extrinsic neuronal mechanisms facilitate bridging axonal regeneration one year after spinal cord injury. Neuron. 2009;64:165–172. doi: 10.1016/j.neuron.2009.09.016. - DOI - PMC - PubMed