. 2024 Mar 18;11(1):303.
doi: 10.1038/s41597-024-03105-6.

Will we ever be able to accurately predict solubility?

Affiliations

Will we ever be able to accurately predict solubility?

P Llompart et al. Sci Data. .

Abstract

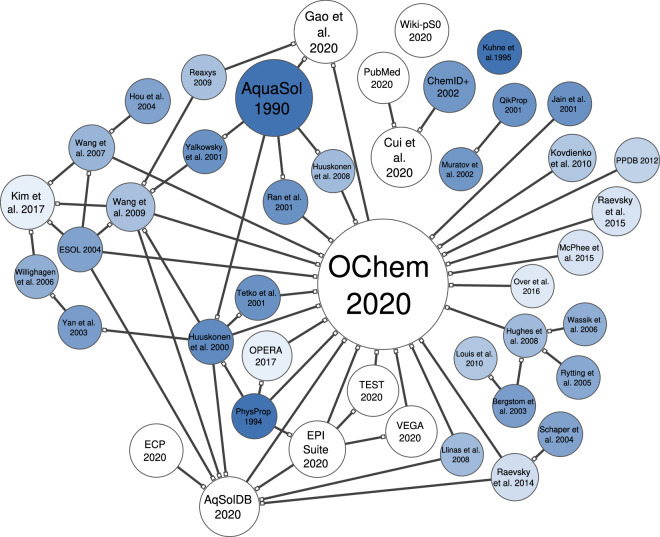
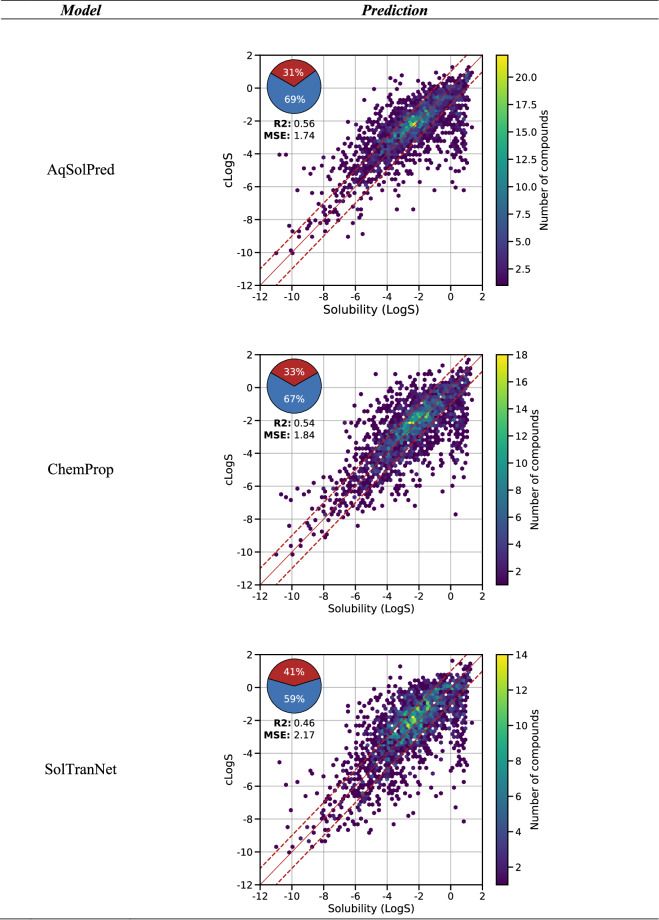
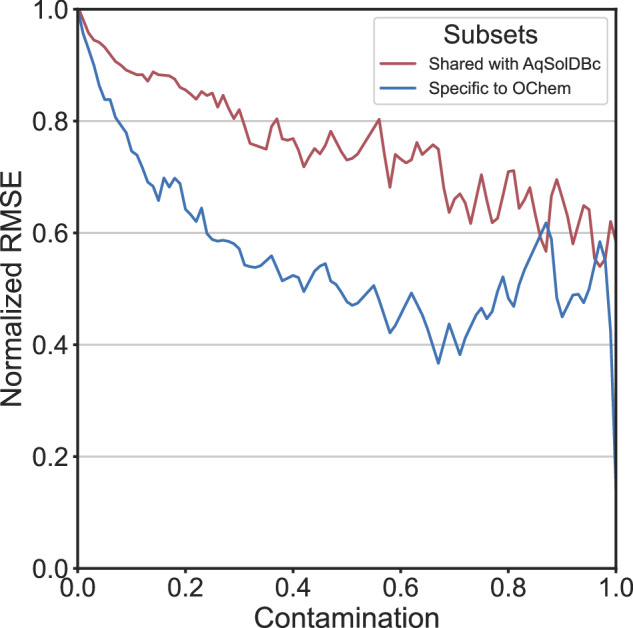
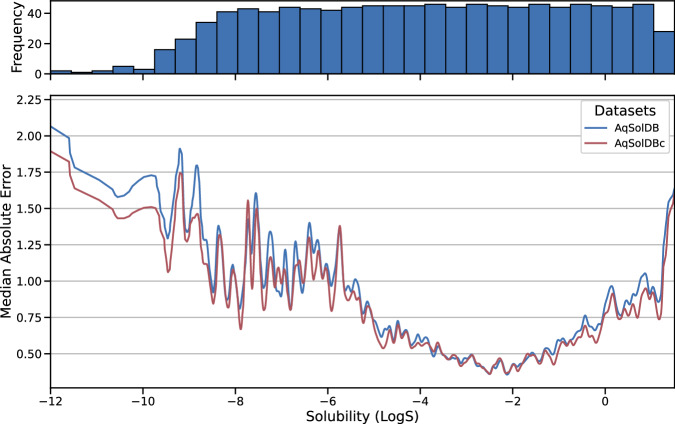
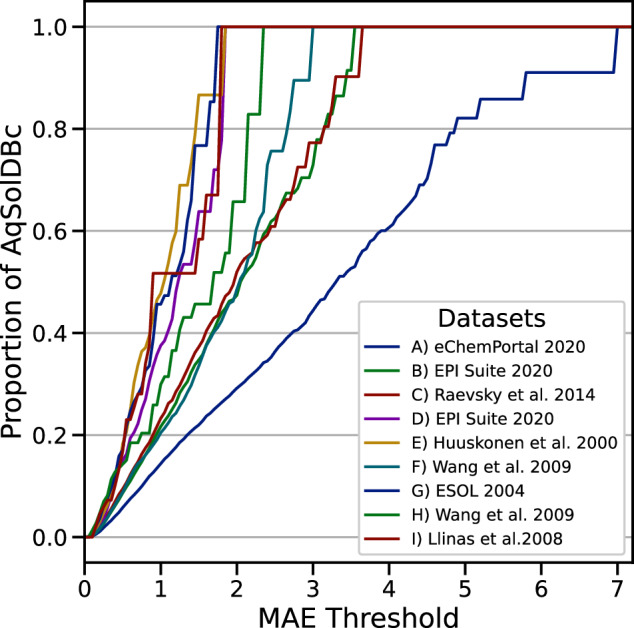
Accurate prediction of thermodynamic solubility by machine learning remains a challenge. Recent models often display good performances, but their reliability may be deceiving when used prospectively. This study investigates the origins of these discrepancies, following three directions: a historical perspective, an analysis of the aqueous solubility dataverse and data quality. We investigated over 20 years of published solubility datasets and models, highlighting overlooked datasets and the overlaps between popular sets. We benchmarked recently published models on a novel curated solubility dataset and report poor performances. We also propose a workflow to cure aqueous solubility data aiming at producing useful models for bench chemist. Our results demonstrate that some state-of-the-art models are not ready for public usage because they lack a well-defined applicability domain and overlook historical data sources. We report the impact of factors influencing the utility of the models: interlaboratory standard deviation, ionic state of the solute and data sources. The herein obtained models, and quality-assessed datasets are publicly available.


Conflict of interest statement

C. Minoletti and P. Llompart are Sanofi employees and may hold shares and/or stock options in the company. S. Baybekov, D. Horvath, G. Marcou, and A. Varnek have nothing to disclose.

Figures

Fig. 1
Fig. 1
Network of the reported thermodynamic aqueous solubility datasets. Supersets composed by merging of previously available datasets are connected to the latter by directed edges, on which a hollow square connector designs the superset. For example, Raevsky et al. includes Schaper et al., and is included in both OChem2020, and AqSolDB2020. The node size defines the number of entries of the datasets. The node color defines the age of the dataset, from dark blue (old) to white (recent). ECP stands for eChemPortal, and ChemID + states ChemIDPlus.
Fig. 2
Fig. 2
GTM density landscape of the chemical space jointly covered by AqSolDBc and OChem. White spaces are unpopulated areas. Colors represent the number of molecules per nodes, from blue (low) to red (high).
Fig. 3
Fig. 3
GTM landscape of the thermodynamic solubility from AqSolDBc and OChem datasets. Colors represent the experimental LogS of the aqueous solubility going from blue (poor) to red (high). Chemical space zones pertaining to specific chemotypes are highlighted. Squares and circles define areas representing respectively AqSolDBc and OChem compounds.
Fig. 4
Fig. 4
Class landscape of the test sets versus the training set, AqSolDBc. The color represents the proportion of compounds from each dataset. Blue regions are populated with structures from AqSolDBc. White spaces are unpopulated areas and red spaces are from compounds specific to OChem datasets.
Fig. 5
Fig. 5
Predicted thermodynamic solubility against experimental solubility for the set specific to OChem. The red line represents a ± 1.0 log interval. The hexbins represent the density of points in the plot.
Fig. 6
Fig. 6
Performance of the RF model (MOE2D) using the IsolationForest Applicability Domain. Performances were computed for each increment of the contamination parameter, from 0.0 to 0.99. Normalized RMSE is the external validation RMSE at contamination X divided by the RMSE at contamination zero.
Fig. 7
Fig. 7
Comparison of the MAE from AqSolDB and AqSolDBc. MAE from the 10-fold CV computed over all models for AqSolDB (blue) and AqSolDBc (red) against the solubility range.
Fig. 8
Fig. 8
Boxplots of the experimental standard deviation (SDi) of compounds in the OChem database. Data shared with AqSolDB (blue) are also present in AqSolDBc, and data specific to OChem (red) are absent from AqSolDBc. Boxplots are restrained to SDi > 0.01 log.
Fig. 9
Fig. 9
REC curve for each AqSolDBc subset corresponding to the major microspecies at pH7.0: Uncharged, Zwitterion, Negative and Positive ions. The y-axis is the proportion of AqSolDBc predicted better than a threshold MAE value on the x-axis; MAE in log from the 10-fold CV computed over all models for AqSolDBc.
Fig. 10
Fig. 10
REC curve of each of the 9 AqSolDB data source. The y-axis is the proportion of AqSolDBc predicted better than a threshold MAE value on the x-axis; MAE from the 10-fold CV computed over all models for AqSolDBc.
Fig. 11
Fig. 11
Structures and compound ID from the 20 hardest-to-predict compounds from AqSolDBc. The first letter of the ID corresponds to the source of the entry (see Fig. 10).
Fig. 12
Fig. 12
Structures and compound ID from the 20 hardest-to-predict compounds colored using ColorAtom. Coloration of compounds according to the fragment-based RF model. Red and blue regions correspond, respectively, to negative and positive contributions to LogS. Dark colors correspond to large positive or negative atomic contributions.
Fig. 13
Fig. 13
Flowchart describing the guidelines followed from compound standardization to data curation. Chemical structures are standardized and ionized using Chemaxon tools. To resolve some ambiguities the structures are verified in the ChemSpider database and in the CSD. Experimental meta-data are systematically retrieved, and the main chemical structure is extracted. The data are filtered according to the experimental conditions. When several thermodynamic solubility values are available, an entry is discarded if there is a doubt about which value to keep; otherwise, the median value is conserved.
Fig. 14
Fig. 14
Number of non-valid entries in AqSolDB identified with the help of the meta-data of measurement.
Fig. 15
Fig. 15
Decision tree proposed for the curation of thermodynamic solubility data. Red nodes define non-valid conditions or chemical states, and green nodes account for correct entries.

Similar articles

Cited by

References

    1. Kennedy T. Managing the drug discovery/development interface. Drug Discov. Today. 1997;2:436–444. doi: 10.1016/S1359-6446(97)01099-4. - DOI
    1. Kola I, Landis J. Can the pharmaceutical industry reduce attrition rates? Nat. Rev. Drug Discov. 2004;3:711–716. doi: 10.1038/nrd1470. - DOI - PubMed
    1. Millard J, Alvarez-Núñez F, Yalkowsky S. Solubilization by cosolvents. Establishing useful constants for the log-linear model. Int. J. Pharm. 2002;245:153–166. doi: 10.1016/S0378-5173(02)00334-4. - DOI - PubMed
    1. Jouyban A, Abolghassemi Fakhree MA. Solubility prediction methods for drug/drug like molecules. Recent Pat. Chem. Eng. 2008;1:220–231. doi: 10.2174/2211334710801030220. - DOI
    1. van de Waterbeemd H. Improving compound quality through in vitro and in silico physicochemical profiling. Chem. Biodivers. 2009;6:1760–1766. doi: 10.1002/cbdv.200900056. - DOI - PubMed