. 2024 Mar 18;7(1):59.
doi: 10.1038/s41746-024-01036-5.

Dynamic associations between glucose and ecological momentary cognition in Type 1 Diabetes

Affiliations

Dynamic associations between glucose and ecological momentary cognition in Type 1 Diabetes

Z W Hawks et al. NPJ Digit Med. .

Abstract

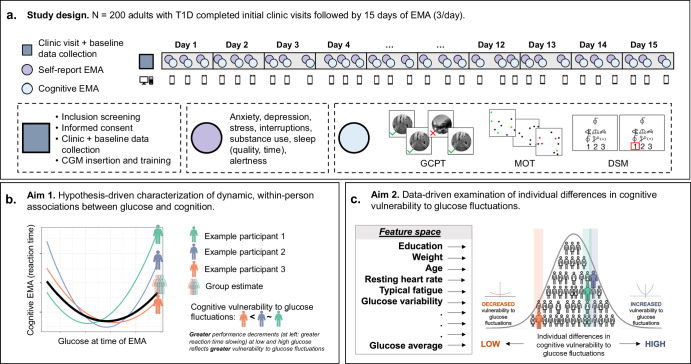
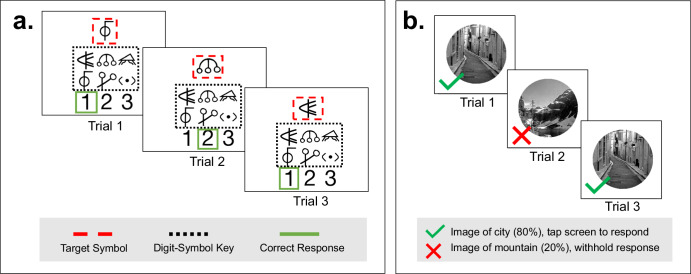
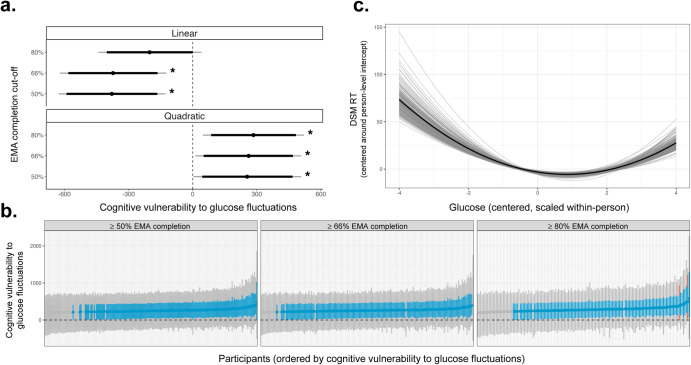
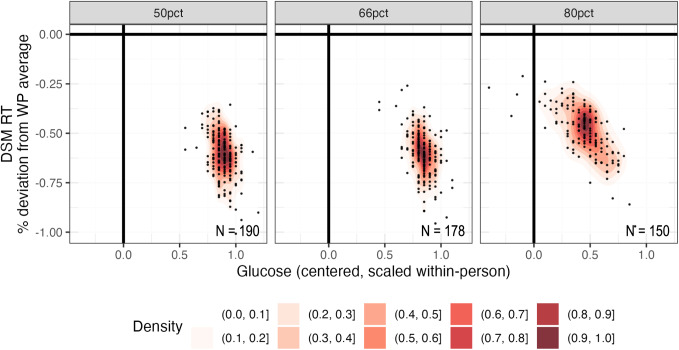
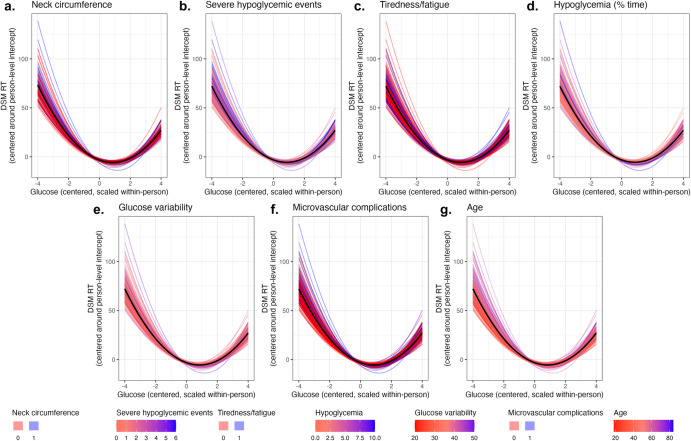
Type 1 diabetes (T1D) is a chronic condition characterized by glucose fluctuations. Laboratory studies suggest that cognition is reduced when glucose is very low (hypoglycemia) and very high (hyperglycemia). Until recently, technological limitations prevented researchers from understanding how naturally-occurring glucose fluctuations impact cognitive fluctuations. This study leveraged advances in continuous glucose monitoring (CGM) and cognitive ecological momentary assessment (EMA) to characterize dynamic, within-person associations between glucose and cognition in naturalistic environments. Using CGM and EMA, we obtained intensive longitudinal measurements of glucose and cognition (processing speed, sustained attention) in 200 adults with T1D. First, we used hierarchical Bayesian modeling to estimate dynamic, within-person associations between glucose and cognition. Consistent with laboratory studies, we hypothesized that cognitive performance would be reduced at low and high glucose, reflecting cognitive vulnerability to glucose fluctuations. Second, we used data-driven lasso regression to identify clinical characteristics that predicted individual differences in cognitive vulnerability to glucose fluctuations. Large glucose fluctuations were associated with slower and less accurate processing speed, although slight glucose elevations (relative to person-level means) were associated with faster processing speed. Glucose fluctuations were not related to sustained attention. Seven clinical characteristics predicted individual differences in cognitive vulnerability to glucose fluctuations: age, time in hypoglycemia, lifetime severe hypoglycemic events, microvascular complications, glucose variability, fatigue, and neck circumference. Results establish the impact of glucose on processing speed in naturalistic environments, suggest that minimizing glucose fluctuations is important for optimizing processing speed, and identify several clinical characteristics that may exacerbate cognitive vulnerability to glucose fluctuations.


Conflict of interest statement

LG is on the Board of Directors of the Many Brains Project, a 501c3 nonprofit organization that disseminates cognitive tests. NC is a paid consultant for Adaptelligence, LLC. ZWH and MRF have received consulting fees from Blueprint Health. SS has received consulting fees from Aphelion Capital. RSW has participated in multicenter clinical trials through her institution sponsored by Eli Lilly Novo Nordisk, Insulet, Tandem, Amgen, MannKind and Diasome and has used devices donated by DexCom in research studies. YCK has had product support from Dexcom Inc. and Tandem Inc., is on an advisory board for Novo Nordisk, USA, and has participated in multicenter clinical trials through his institution funded by Dexcom, Tandem, Medtronic and Mannkind. HVD is a paid consultant for Jazz Pharmaceuticals. The authors declare no other competing interests.

Figures

Fig. 1
Fig. 1. Schematic of study design, aims, and methods.
Results are summarized in Figs 3–5. a Adults with type 1 diabetes (T1D) completed initial clinic visits and baseline cognitive data collection followed by 15 days of ecological momentary assessment (EMA). b Analyses characterized dynamic, within-person associations between glucose and cognition for the full sample (group estimate; thick black line) and each participant (individual estimates; example participants 1–3 in green, purple, and orange). U-shaped curves for speeded outcomes (depicted below) indicate slower reaction time at low and high glucose, whereas inverted curves for accuracy outcomes indicate reduced accuracy at low and high glucose. Steeper curves (e.g., example participants 1-2, shaded green and purple) indicate greater cognitive vulnerability to glucose fluctuations, whereas shallower curves (e.g., example participant 3, shaded orange) indicate reduced cognitive vulnerability to glucose fluctuations. c Data-driven analyses identified strong person-level predictors of individual differences in cognitive vulnerability to glucose fluctuations. Strong predictors were selected from a feature space that included 58 clinical, physiological, and demographic variables. Gradual onset continuous performance test [GCPT], multiple object tracking [MOT], digit-symbol matching [DSM].
Fig. 2
Fig. 2. Example trials for Digit-Symbol Matching (DSM) and Gradual Onset Continuous Performance Test (GCPT).
a DSM: participants were presented with a target symbol and a digit-symbol pairing key. They used their touchscreen to press the digit that was paired with the target symbol in the key. There was no response deadline, and each EMA session lasted 30 seconds. b GCPT: participants viewed a circular, grayscale image of a city or mountain. They were instructed to press their touchscreen device when the image depicted a city and withhold a response when the image depicted a mountain. Each EMA session lasted 60 seconds and consisted of 75 trials. Legend items were not visible during administration.
Fig. 3
Fig. 3. Group and individual estimates of cognitive vulnerability to glucose fluctuations.
Counter-clockwise from top left: a Group estimates and credible intervals (CIs) for linear and quadratic terms relating glucose to DSM RT (x-axis), evaluated across EMA completion cut-offs (y-axis). 90% CIs are in black, and 95% CIs are in gray. Significant effects (marked by asterisks) were evaluated with respect to 95% CIs. Quadratic terms were significant across all EMA completion cut-offs, indicating cognitive vulnerability to glucose fluctuations. b Variation in individual estimates of cognitive vulnerability to glucose fluctuations for DSM RT. Cognitive vulnerability to glucose fluctuations (y-axis) is visualized for each participant (x-axis) across EMA completion cutoffs (panels). CIs illustrate different levels of uncertainty (95%, 90%, 66%) around individual estimates. Gray lines show 95% CIs, red lines show 90% CIs that do not overlap zero, and blue lines show 66% CIs that do not overlap zero. Most CIs are shaded blue but not red, suggesting moderate to high (66–90%) probability that a given individual exhibited cognitive vulnerability to glucose fluctuations. c Model-implied predictions relating glucose (x-axis) to DSM RT (y-axis) in ≥66% EMA completion data. Group predictions (based on a) are represented by the thick black line, and individual predictions (based on b) are represented by thin gray lines, where one gray line = one participant. DSM RT was slower at low and high glucose, reflecting cognitive vulnerability to glucose fluctuations. Variation in thin gray lines reflects individual differences in cognitive vulnerability to glucose fluctuations.
Fig. 4
Fig. 4. Optimal cognitive performance was associated with slightly elevated glucose levels.
Optimal DSM RT (y-axis) plotted against glucose levels that were associated with optimal DSM RT (x-axis) for each EMA completion cutoff (≥50%, ≥66%, ≥80%). Along the x-axis: glucose is centered and scaled within-person (WP). Along the y-axis: optimal DSM RT is plotted as percent (%) deviation from WP average performance. More negative values indicate a larger difference between optimal and average performance. Each dot represents one participant. For most participants (red high-density regions), optimal performance occurred 0.72 standard deviations (47.49 mg/dL) above WP glucose means and was associated with 0.57% (5.30 ms) faster performance relative to WP cognitive means.
Fig. 5
Fig. 5. Data-driven analyses identified seven variables that explained between-person differences in cognitive vulnerability to glucose fluctuations for DSM RT.
Group estimates of cognitive vulnerability to glucose fluctuations are visualized as thick black lines, and individual estimates are visualized as thin lines. The color of the individual lines reflects the value of each variable, ag: a neck circumference (NeckCir_binary: [0] circumference ≤40 cm, [1] circumference > 40 cm), b number of lifetime severe hypoglycemic events (SevereHypoEvents: 0 [no events] to 6 [>10 events]), c tiredness/fatigue (tired_binary: [0] not tired during the day, [1] tired during the day), d percent CGM time in hypoglycemic range (gluBelow70: percent time < 70 mg/dL), e CGM glucose variability (gluCV: percent ratio of glucose standard deviation to glucose mean), f presence vs. absence of microvascular disease (microvascular_binary: [0] microvascular disease absent, [1] microvascular disease present), and g age (in years). Additional details about variable derivation are in Supplementary Table 3.

References

    1. Van Belle TL, Coppieters KT, Von Herrath MG. Type 1 diabetes: etiology, immunology, and therapeutic strategies. Physiol. Rev. 2011;91:79–118. doi: 10.1152/physrev.00003.2010. - DOI - PubMed
    1. Ozougwu JC, Obimba KC, Belonwu CD, Unakalamba CB. The pathogenesis and pathophysiology of type 1 and type 2 diabetes mellitus. J. Physiol. Pathophysiol. 2013;4:46–57. doi: 10.5897/JPAP2013.0001. - DOI
    1. Kumar N, et al. Mild cognitive impairment in young type 1 diabetes mellitus patients and correlation with diabetes control, lipid profile, and high-sensitivity C-reactive protein. Indian J. Endocrinol. Metab. 2018;22:780. doi: 10.4103/ijem.IJEM_58_18. - DOI - PMC - PubMed
    1. Chaytor NS, et al. Clinically significant cognitive impairment in older adults with type 1 diabetes. J. Diabetes Complications. 2019;33:91–97. doi: 10.1016/j.jdiacomp.2018.04.003. - DOI - PubMed
    1. Shalimova A, et al. Cognitive dysfunction in type 1 diabetes mellitus. J. Clin. Endocrinol. Metab. 2019;104:2239–2249. doi: 10.1210/jc.2018-01315. - DOI - PubMed