Multi-omics pan-cancer analyses identify MCM4 as a promising prognostic and diagnostic biomarker
- PMID: 38499612
- PMCID: PMC10948783
- DOI: 10.1038/s41598-024-57299-1
Multi-omics pan-cancer analyses identify MCM4 as a promising prognostic and diagnostic biomarker
Abstract
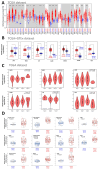
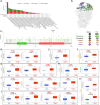
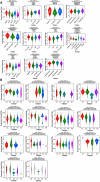
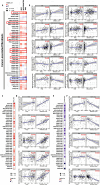
Minichromosome Maintenance Complex Component 4 (MCM4) is a vital component of the mini-chromosome maintenance complex family, crucial for initiating the replication of eukaryotic genomes. Recently, there has been a growing interest in investigating the significance of MCM4 in different types of cancer. Despite the existing research on this topic, a comprehensive analysis of MCM4 across various cancer types has been lacking. This study aims to bridge this knowledge gap by presenting a thorough pan-cancer analysis of MCM4, shedding light on its functional implications and potential clinical applications. The study utilized multi-omics samples from various databases. Bioinformatic tools were employed to explore the expression profiles, genetic alterations, phosphorylation states, immune cell infiltration patterns, immune subtypes, functional enrichment, disease prognosis, as well as the diagnostic potential of MCM4 and its responsiveness to drugs in a range of cancers. Our research demonstrates that MCM4 is closely associated with the oncogenesis, prognosis and diagnosis of various tumors and proposes that MCM4 may function as a potential biomarker in pan-cancer, providing a deeper understanding of its potential role in cancer development and treatment.
Keywords: Bioinformatics; Biomarker; Immune infiltration; MCM4; Multi-omics; Pan-cancer; Prognosis.
© 2024. The Author(s).
Conflict of interest statement
The authors declare no competing interests.
Figures



Similar articles
-
An MCM4 mutation detected in cancer cells affects MCM4/6/7 complex formation.J Biochem. 2017 Mar 1;161(3):259-268. doi: 10.1093/jb/mvw065. J Biochem. 2017. PMID: 27794528
-
Function of the amino-terminal region of human MCM4 in helicase activity.J Biochem. 2018 Dec 1;164(6):449-460. doi: 10.1093/jb/mvy072. J Biochem. 2018. PMID: 30184107
-
G364R mutation of MCM4 detected in human skin cancer cells affects DNA helicase activity of MCM4/6/7 complex.J Biochem. 2015 Jun;157(6):561-9. doi: 10.1093/jb/mvv015. Epub 2015 Feb 7. J Biochem. 2015. PMID: 25661590
-
MCM4 acts as a biomarker for LUAD prognosis.J Cell Mol Med. 2023 Nov;27(21):3354-3362. doi: 10.1111/jcmm.17819. Epub 2023 Oct 10. J Cell Mol Med. 2023. PMID: 37817427 Free PMC article.
-
Cell Division Cycle-Associated Protein 3 (CDCA3) Is a Potential Biomarker for Clinical Prognosis and Immunotherapy in Pan-Cancer.Biomed Res Int. 2022 Aug 30;2022:4632453. doi: 10.1155/2022/4632453. eCollection 2022. Biomed Res Int. 2022. Retraction in: Biomed Res Int. 2023 Jun 21;2023:9870382. doi: 10.1155/2023/9870382. PMID: 36082153 Free PMC article. Retracted. Review.
Cited by
-
Comprehensive analysis of lactylation-related gene and immune microenvironment in atrial fibrillation.Front Cardiovasc Med. 2025 Apr 22;12:1567310. doi: 10.3389/fcvm.2025.1567310. eCollection 2025. Front Cardiovasc Med. 2025. PMID: 40329965 Free PMC article.
-
Establishment of a nomogram-based prognostic model (LASSO-Cox regression) for predicting platelet storage lesions under different storage conditions.Front Mol Biosci. 2025 Mar 31;12:1561114. doi: 10.3389/fmolb.2025.1561114. eCollection 2025. Front Mol Biosci. 2025. PMID: 40230453 Free PMC article.
-
Minichromosome maintenance 4 is associated with poor survival and stemness of patients with pancreatic cancer.Med Mol Morphol. 2025 Apr 28. doi: 10.1007/s00795-025-00438-y. Online ahead of print. Med Mol Morphol. 2025. PMID: 40293517
-
MCM4 as Potential Metastatic Biomarker in Lung Adenocarcinoma.Diagnostics (Basel). 2025 Jun 18;15(12):1555. doi: 10.3390/diagnostics15121555. Diagnostics (Basel). 2025. PMID: 40564876 Free PMC article.
-
Proteomic analysis reveals potential biomarker candidates in serous ovarian tumors - a preliminary study.Contemp Oncol (Pozn). 2025;29(1):77-92. doi: 10.5114/wo.2025.149180. Epub 2025 Apr 4. Contemp Oncol (Pozn). 2025. PMID: 40330446 Free PMC article.
References
-
- Hanahan D. Hallmarks of cancer: New dimensions. Cancer Discov. 2022;12:31–46. doi: 10.1158/2159-8290.CD-1121-1059. - DOI - PubMed
MeSH terms
Substances
LinkOut - more resources
Full Text Sources
Medical
Miscellaneous

