

A comparison of two gene regions for assessing community composition of eukaryotic marine microalgae from coastal ecosystems
- PMID: 38499675
- PMCID: PMC10948787
- DOI: 10.1038/s41598-024-56993-4
A comparison of two gene regions for assessing community composition of eukaryotic marine microalgae from coastal ecosystems
Abstract
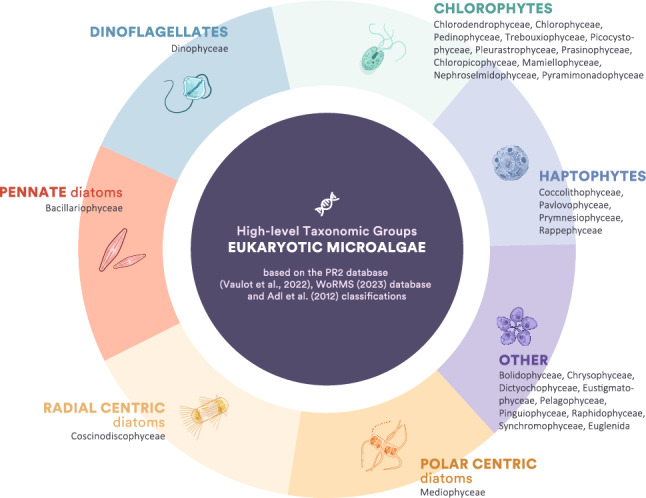
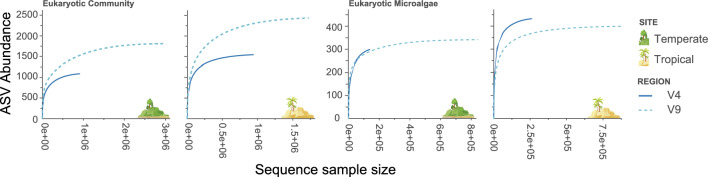
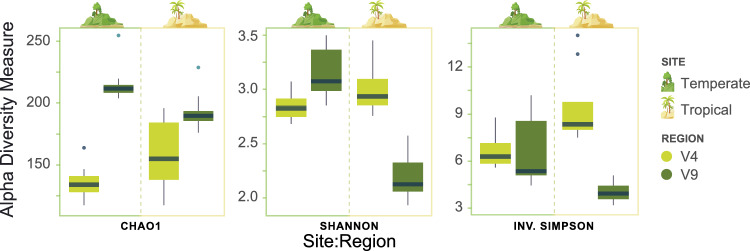
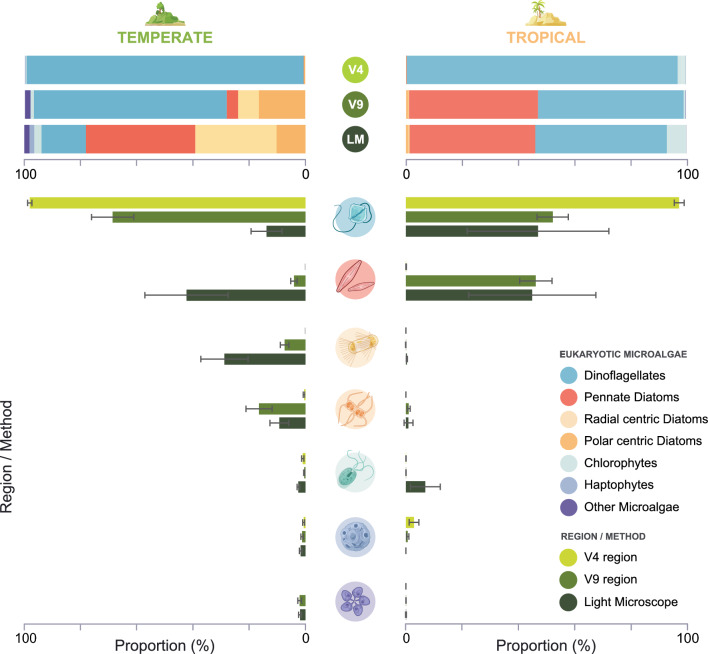
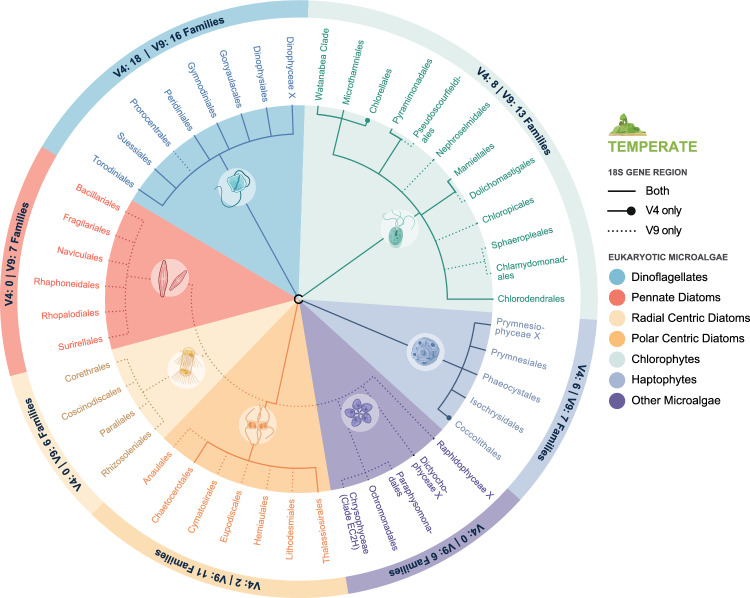
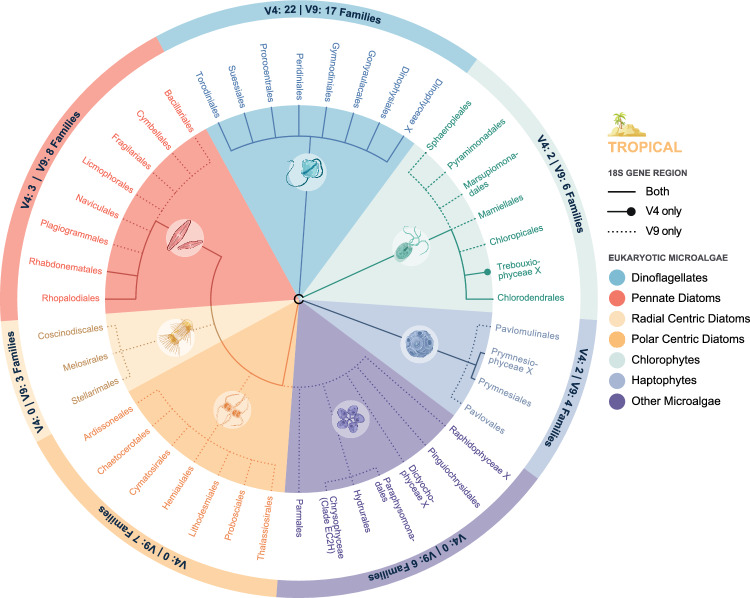
Two gene regions commonly used to characterise the diversity of eukaryotic communities using metabarcoding are the 18S ribosomal DNA V4 and V9 gene regions. We assessed the effectiveness of these two regions for characterising diverisity of coastal eukaryotic microalgae communities (EMCs) from tropical and temperate sites. We binned amplicon sequence variants (ASVs) into the high level taxonomic groups: dinoflagellates, pennate diatoms, radial centric diatoms, polar centric diatoms, chlorophytes, haptophytes and 'other microalgae'. When V4 and V9 generated ASV abundances were compared, the V9 region generated a higher number of raw reads, captured more diversity from all high level taxonomic groups and was more closely aligned with the community composition determined using light microscopy. The V4 region did resolve more ASVs to a deeper taxonomic resolution within the dinoflagellates, but did not effectively resolve other major taxonomic divisions. When characterising these communities via metabarcoding, the use of multiple gene regions is recommended, but the V9 gene region can be used in isolation to provide high-level community biodiversity to reflect relative abundances within groups. This approach reduces the cost of sequencing multiple gene regions whilst still providing important baseline ecosystem function information.
© 2024. The Author(s).
Conflict of interest statement
The authors declare no competing interests.
Figures
Similar articles
-
Quantitative analysis of dinoflagellates and diatoms community via Miseq sequencing of actin gene and v9 region of 18S rDNA.Sci Rep. 2016 Oct 10;6:34709. doi: 10.1038/srep34709. Sci Rep. 2016. PMID: 27721499 Free PMC article.
-
[Community Diversity of Eukaryotic Nano-phytoplankton in Yellow Sea Using DNA Metabarcoding Technology Based on Multiple Amplicons].Huan Jing Ke Xue. 2019 Sep 8;40(9):4052-4060. doi: 10.13227/j.hjkx.201811025. Huan Jing Ke Xue. 2019. PMID: 31854868 Chinese.
-
Distribution and diversity of eukaryotic microalgae in Kuwait waters assessed using 18S rRNA gene sequencing.PLoS One. 2021 Apr 26;16(4):e0250645. doi: 10.1371/journal.pone.0250645. eCollection 2021. PLoS One. 2021. PMID: 33901235 Free PMC article.
-
Annotated 18S and 28S rDNA reference sequences of taxa in the planktonic diatom family Chaetocerotaceae.PLoS One. 2018 Dec 26;13(12):e0208929. doi: 10.1371/journal.pone.0208929. eCollection 2018. PLoS One. 2018. PMID: 30586452 Free PMC article.
-
Genetic Markers for Metabarcoding of Freshwater Microalgae: Review.Biology (Basel). 2023 Jul 22;12(7):1038. doi: 10.3390/biology12071038. Biology (Basel). 2023. PMID: 37508467 Free PMC article. Review.
Cited by
-
What is Fragilaria koensabbei and does it matter what it is called? (Meta)barcoding and the science of taxonomy.J Phycol. 2025 Jun;61(3):433-439. doi: 10.1111/jpy.70020. Epub 2025 May 3. J Phycol. 2025. PMID: 40318160 Free PMC article. Review.
-
A glimpse into the future: How the timing of sea ice formation influences associated microalgal communities.iScience. 2025 Apr 15;28(5):112417. doi: 10.1016/j.isci.2025.112417. eCollection 2025 May 16. iScience. 2025. PMID: 40352721 Free PMC article.
-
Morphological and Molecular Diversity of Phytoplankton in Beibu Gulf, Northern South China Sea.Ecol Evol. 2025 Apr 9;15(4):e71207. doi: 10.1002/ece3.71207. eCollection 2025 Apr. Ecol Evol. 2025. PMID: 40212923 Free PMC article.
-
Stable dominance of parasitic dinoflagellates in Antarctic sponges.PeerJ. 2024 Nov 8;12:e18365. doi: 10.7717/peerj.18365. eCollection 2024. PeerJ. 2024. PMID: 39529628 Free PMC article.
References
-
- Hopes A, Mock T. Evolution of microalgae and their adaptations different marine ecosystems. In: Hopes A, editor. Encyclopedia of Life Sciences. Wiley; 2015.
-
- Haberman KL, Quetin LB, Ross RM. Diet of the Antarctic krill (Euphausia superba Dana) J. Exp. Mar. Biol. Ecol. 2003;283(1–2):79–95. doi: 10.1016/S0022-0981(02)00466-5. - DOI
-
- Acevedo-Trejos E, et al. A glimpse into the future composition of marine phytoplankton communities. Front. Mar. Sci. 2014 doi: 10.3389/fmars.2014.00015. - DOI
-
- Parmesan C. Ecological and Evolutionary Responses to Recent Climate Change. Annu. Rev. Ecol. Evol. Syst. 2006;37(1):637–669. doi: 10.1146/annurev.ecolsys.37.091305.110100. - DOI
-
- Verity PG, Smetacek V, Smayda TJ. Status, trends and the future of the marine pelagic ecosystem. Environ. Conserv. 2002;29(2):207–237. doi: 10.1017/S0376892902000139. - DOI
MeSH terms
Substances
Grants and funding
LinkOut - more resources
Full Text Sources
