. 2024 Apr;6(4):651-658.
doi: 10.1038/s42255-024-01018-7. Epub 2024 Mar 18.

Metformin and feeding increase levels of the appetite-suppressing metabolite Lac-Phe in humans

Affiliations

Metformin and feeding increase levels of the appetite-suppressing metabolite Lac-Phe in humans

Barry Scott et al. Nat Metab. 2024 Apr.

Abstract

Metformin, a widely used first-line treatment for type 2 diabetes (T2D), is known to reduce blood glucose levels and suppress appetite. Here we report a significant elevation of the appetite-suppressing metabolite N-lactoyl phenylalanine (Lac-Phe) in the blood of individuals treated with metformin across seven observational and interventional studies. Furthermore, Lac-Phe levels were found to rise in response to acute metformin administration and post-prandially in patients with T2D or in metabolically healthy volunteers.


Conflict of interest statement

B.S. is due to undertake a 3-month internship at Metabolon as part of his PhD. L.L. is a member of the scientific advisory board for MiNK Therapeutics and Faeth Therapeutics. The other authors declare no competing interests.

Figures

Fig. 1
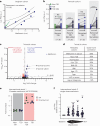
Fig. 1. Elevated serum Lac-Phe in patients with T2D.
a, Distribution of 33 non-diabetic (non-T2D), pre-diabetic (pre-T2D) and diabetic (T2D) participants in the Brigham and Women’s Hospital cohort study. b, Volcano plot comparing metabolomes of obese non-T2D (n = 11) and obese T2D (n = 8) individuals. Significantly upregulated (blue) and downregulated (red) metabolites are shown, and N-lactoyl amino acids are highlighted. c, Lac-Phe levels in non-T2D (n = 21), pre-T2D (n = 4) and T2D (n = 8) individuals (*P = 0.0198 and ****P < 0.0001; NS, non-significant). d, Spearmanʼs rank correlation between Lac-Phe and N-lactoyl-tyrosine (Lac-Tyr) in the total Brigham and Women’s Hospital cohort (n = 33). Graph shows mean linear regression with 95% confidence intervals. e, Lac-Phe in non-T2D (n = 5,876) and T2D (n = 162) individuals from the TwinsUK cohort (****P < 0.0001). Data are mean ± s.d. (c); violin plot with median (dashed line) plus maximum and minimum quartiles (dotted line) (e). Data were analysed using two-tailed Student’s t-test (b,e) or one-way ANOVA with Dunnett’s post test (c). Brigham cohort, Brigham and Women’s Hospital cohort. Source data
Fig. 2
Fig. 2. Metformin treatment increases serum Lac-Phe.
a, Spearmanʼs rank correlation between metformin and Lac-Phe levels in obese T2D individuals (n = 8) for the Brigham and Women’s Hospital cohort. Graph shows mean linear regression with 95% confidence intervals. One volunteer (highlighted with an arrow) had stopped taking their metformin medication. b, TwinsUK volunteers provided three serum samples, with an average of 6.5 years between samples. Paired data are shown for volunteers whose T2D status changed and/or who commenced metformin treatment between samples (***P = 0.0002 and ****P < 0.0001; NS, non-significant). c, Volcano plot comparing metabolomes in T2D volunteers with (n = 71) and without (n = 91) metformin treatment. Metabolites significantly upregulated (blue) and downregulated (red) with metformin treatment are shown, and N-lactoyl amino acids and metformin are labelled. d, Spearmanʼs rank correlation in T2D samples (n = 162) versus non-metabolite metadata (Years T2D, years since T2D diagnosis; Non-fasted, volunteer had eaten within 6 h of sample collection; >5yr T2D, more than 5 years since T2D diagnosis; BMI, body mass index of volunteer; VitC in serum, ascorbate detected in metabolomics; Age at diagnosis, age when volunteer received a T2D diagnosis). e, Comparison of amino acid (AA) and N-lactoyl-amino acid (N-lactoyl-AA) levels after a 12-week metformin intervention, relative to pre-treatment levels, in a 2019 Danish study (NCT01729156). Fold increases for patients with recent-onset T2D and age/BMI-matched non-T2D controls (n = 12 per group) showing five separate AAs and the corresponding N-lactoyl-AA; phenylalanine (circle), tyrosine (square), valine (hexagon), leucine (triangle) and isoleucine (diamond) (*P < 0.05). f, Lac-Phe levels (relative to baseline) over 36 h after a single oral dose of metformin in a study involving 26 young healthy male volunteers. Lac-Phe values measured before the maximum metformin concentration (Cmax) in the serum, at the Cmax and after the Cmax. A final sample was taken 36 h after dosing (**P = 0.0086, ***P = 0.0005 and ****P < 0.0001). Data are individual data points (a,f), individual paired data points (b) and mean values (e). Data were analysed using two-way ANOVA with Fisher’s LSD post test (b), two-tailed Student’s t-test (c), Welch’s two-sided Student’s t-test (e) and one-sample t-test against a theoretical value of 1 (f). Brigham cohort, Brigham and Women’s Hospital cohort. Source data
Fig. 3
Fig. 3. Feeding increases serum Lac-Phe concentrations.
a,b, Lac-Phe levels in T2D volunteers with (a) or without (b) metformin treatment (sample sizes indicated) and under fasted (blue bars) and non-fasted (red bars) conditions, where volunteers had eaten within 6 h (*P = 0.034). c, Lac-Phe levels 30 min before and 1 h after a standardized MMT involving non-T2D (n = 10), pre-T2D (n = 10) and T2D (n = 10) volunteers. Each volunteer completed the test on three separate days, resulting in a total of 90 paired samples (n = 30 for each group) (****P < 0.0001). d, Lac-Phe levels after a volunteer’s habitual meal (n = 24) or high-fat meal (n = 48), relative to fasted levels, in 24 overweight/obese sedentary men. Serum samples were taken before breakfast and approximately 45 min after dinner (****P < 0.0001). e, Lac-Phe levels after feeding with liquid glucose or dates. Left, Khalas date nutritional information is given for reference. Twenty-one participants undertook three separate dietary challenges, consuming either a glucose solution (OGTT, n = 21) or ten fruits of the Deglet Nour (n = 21) or Khalas (n = 20, one volunteer did not participate) date varieties. Blood samples were collected before intake and at intervals up to 120 min afterward. Lac-Phe levels were normalized to fasting levels. The AUC is shown. Data are violin plots with median (dashed line) plus maximum and minimum quartiles (dotted line) (a,b), individual paired data points (c), mean (dotted line) and individual data points (d) and mean ± s.e.m. (e). Data were analysed using two-sided Studentʼs t-test (a,b), two-way ANOVA with Sidakʼs post test (c) or Tukeyʼs post test (e) or one-sample t-test against a theoretical value of 1 (d). Source data
Extended Data Fig. 1
Extended Data Fig. 1. Glucagon does not induce Lac-Phe levels.
LacPhe levels before and 23 hours post treatment with low (GCG 12.5 ng/kg/min, n = 12) or high (GCG 25 ng/kg/min, n = 9) dose glucagon or placebo control (n = 8). Data shown is individual paired data points for Lac-Phe pre and post treatment. Data was analysed using a 2-way ANOVA with a Sidak post-test. (***, p = 0.008). Source data
Extended Data Fig. 2
Extended Data Fig. 2. Stable baseline Lac-Phe levels in non-T2D, pre-T2D and T2D individuals.
LacPhe levels 30 minutes before and 1 hour after a standardised mixed meal test involving non-T2D (n = 10), pre-T2D (n = 10), and T2D volunteers (n = 10). Each volunteer completed the test on 3 separate days (labelled visit 1, 2 and 3). (****, p < 0.0001). Data is individual linked measurements for each volunteer across the 3 visits. Data was analysed using a two-way ANOVA with a Tukey post-test comparing paired pre and post measurements for each group on each visit. Source data

Similar articles

Cited by

References

    1. Rena G, Pearson ER, Sakamoto K. Molecular mechanism of action of metformin: old or new insights? Diabetologia. 2013;56:1898–1906. doi: 10.1007/s00125-013-2991-0. - DOI - PMC - PubMed
    1. Foretz M, Guigas B, Viollet B. Metformin: update on mechanisms of action and repurposing potential. Nat. Rev. Endocrinol. 2023;19:460–476. doi: 10.1038/s41574-023-00833-4. - DOI - PMC - PubMed
    1. Diabetes Prevention Program Research Group. Long-term safety, tolerability, and weight loss associated with metformin in the Diabetes Prevention Program Outcomes Study. Diabetes Care. 2012;35:731–737. doi: 10.2337/dc11-1299. - DOI - PMC - PubMed
    1. Lee A, Morley JE. Metformin decreases food consumption and induces weight loss in subjects with obesity with type II non-insulin-dependent diabetes. Obes. Res. 1998;6:47–53. doi: 10.1002/j.1550-8528.1998.tb00314.x. - DOI - PubMed
    1. LaMoia TE, Shulman GI. Cellular and molecular mechanisms of metformin action. Endocr. Rev. 2021;42:77–96. doi: 10.1210/endrev/bnaa023. - DOI - PMC - PubMed

Publication types

MeSH terms