. 2024 Apr;6(4):659-669.
doi: 10.1038/s42255-024-00999-9. Epub 2024 Mar 18.

Lac-Phe mediates the effects of metformin on food intake and body weight

Affiliations

Lac-Phe mediates the effects of metformin on food intake and body weight

Shuke Xiao et al. Nat Metab. 2024 Apr.

Abstract

Metformin is a widely prescribed anti-diabetic medicine that also reduces body weight. There is ongoing debate about the mechanisms that mediate metformin's effects on energy balance. Here, we show that metformin is a powerful pharmacological inducer of the anorexigenic metabolite N-lactoyl-phenylalanine (Lac-Phe) in cells, in mice and two independent human cohorts. Metformin drives Lac-Phe biosynthesis through the inhibition of complex I, increased glycolytic flux and intracellular lactate mass action. Intestinal epithelial CNDP2+ cells, not macrophages, are the principal in vivo source of basal and metformin-inducible Lac-Phe. Genetic ablation of Lac-Phe biosynthesis in male mice renders animals resistant to the effects of metformin on food intake and body weight. Lastly, mediation analyses support a role for Lac-Phe as a downstream effector of metformin's effects on body mass index in participants of a large population-based observational cohort, the Multi-Ethnic Study of Atherosclerosis. Together, these data establish Lac-Phe as a critical mediator of the body weight-lowering effects of metformin.


Conflict of interest statement

Competing interests

The authors declare no competing interests.

Figures

Extended Data Fig. 1 |
Extended Data Fig. 1 |. Additional characterization of metabolites after metformin treatment.
(a) Retention time of metformin-induced Lac-Phe (red trace) and an authentic Lac-Phe standard (blue trace) with a 30-min LC method. (b) MS2 profile of metformin-induced Lac-Phe with 10 eV collision energy. Note a characteristic transition from 236.1 to 88.0 characteristic of the lactamide daughter ion of Lac-Phe. (c) Correlation of plasma metformin and Lac-Phe levels in the Stanford Cohort (N = 21). Pearson r = 0.1435, R2 = 0.0206, p = 0.5350 (two-sided). Error bands represent 95% confidence intervals. (d) Plasma levels of lactate pre- and post-3 months of metformin treatment in the Stanford cohort (n = 21). (e) Plasma levels of lactate in MESA participants on metformin (n = 179) compared to participants not on metformin (n = 3477). Dashed lines indicate medians and quartiles. (f) Metformin levels in the plasma of 12–14 week-old C57BL/6J DIO male mice treated with metformin at indicated doses, PO (n = 5, except for 100 mg/kg and 300 mg/kg at 24 h where n = 4). 100 mg/kg, 300 mg/kg, and 600 mg/kg corresponds to 0.60 × 10⁶nmol/kg, 1.81 × 10⁶nmol/kg, 3.62 × 10⁶nmol/kg, respectively. (g) Metformin levels in tissues of 14–15 week-old C57BL/6J DIO male mice treated with metformin (300 mg/kg, PO) (n = 4). (h) Fold changes of lactate and Lac-Phe in plasma of 12–14 week-old C57BL/6J DIO male mice treated with metformin (300 mg/kg, PO) (n = 5, except for 100 mg/kg and 300 mg/kg at 24 h where n = 4). (i) Fold changes of Lac-Phe in plasma of 14–15 week-old C57BL/6J DIO male mice 4 h and 24 h after fasting and 1 h and 4h after refeeding. (n = 5, except for the 4h fasting time point where n = 4). P values in (a-b), and (f) were calculated with two-sided paired t tests. P value in (c) was generated using linear regression models adjusting for age, sex, fasting plasma glucose, total cholesterol, and hypertension status. All error bars in (f-i) are SEM.
Extended Data Fig. 2 |
Extended Data Fig. 2 |. Metformin inhibits complex I to drive Lac-Phe production in primary macrophages.
(a) Cellular respiration following treatment of primary macrophages with the indicated concentrations of metformin (n = 5/concentration). (b) Cellular respiration of primary macrophages following treatment with the indicated concentrations of biguanides overnight (n = 5/concentration for biguanides, N = 6/concentration for control). (c) Fold-change in media Lac-Phe levels in primary macrophages following overnight treatment with the indicated inhibitor of oxidative phosphorylation at the indicated concentration (n = 3/concentration) (d) Fold-change in media Lac-Phe levels or 13C-labeled Lac-Phe levels in primary macrophage (n=3/condition) using 13C-labeled lactate. P values in (c) were calculated using two-sided one sample t test. *p < 0.05, **p < 0.01. The exact p values in (c) are: 0.051, 0.005, 0.011, 0.014, 0.002, 0.008, 0.084, 0.018. N values from (a-d) represent biological independent samples. All error bars are SEM.
Extended Data Fig. 3 |
Extended Data Fig. 3 |. Metformin inhibits complex I to drive Lac-Phe production in Caco-2 cells.
(a-b) Cellular respiration of Caco-2 cells following treatment with the indicated concentrations of metformin (a, n = 5/concentration) or biguanide (b, n = 6/concentration) overnight. (c-d) Percent inhibition of basal respiration (c, n = 5/concentration for metformin; n = 6/concentration for buformin and phenformin) and Lac-Phe concentration in media (d, n = 3/concentration) following overnight treatment of Caco-2 cells with the indicated biguanide at the indicated concentrations. (e) Fold-change in media Lac-Phe levels in Caco-2 cells following overnight treatment with the indicated oxidative phosphorylation inhibitor at the indicated concentration (n = 3/concentration) (f-g) Fold-change in media Lac-Phe levels or 13C-labeled Lac-Phe levels in Caco-2 cells (n = 3/condition) using either 13C-labeled glucose (f) or 13C-labeled lactate (g). (h) Cell viability after treated with Lac-Phe at indicated concentrations overnight as revealed by CCK-8 assay (n = 5/concentration). P values in (e) were calculated using two-sided one sample t test. *p < 0.05, **p < 0.01, *** p < 0.001. The exact p values in (e) are: 0.0050, 0.0144, 0.3965, 0.9973, 0.0232, 0.0004, 0.0064, 0.0007. N numbers in (a-h) represent biological independent samples. All error bars are SEM.
Extended Data Fig. 4 |
Extended Data Fig. 4 |. Additional characterization of cells and mice with genetic ablation of CNDP2.
(a) Western blotting using anti-CNDP2 and anti-β-tubulin antibodies of WT and CNDP2-KO primary macrophages, Caco-2 cells, and BV-2 cells. (b) Relative plasma lactate levels in 12–14 week-old male WT or global CNDP2-KO DIO mice in the basal state or 1 h after treatment with metformin (300 mg/kg, PO) (n = 6 for WT; n = 7 for CNDP2-KO mice). Error bars are SEM. (c) Schematic illustration of conditional knockout of Cndp2 in macrophage or gut. (d) Western blotting using an anti-β-tubulin antibody in peritoneal macrophages, gut, or kidney tissues isolated from the indicated genotypes. (e) Western blotting using anti-CNDP2 and anti-β-tubulin antibodies in heart, lung, liver tissues isolated from the indicated genotypes. P values in (b) were calculated with two-sided multiple paired t tests with Holm-Šídák corrections. Western Blot experiments in (a), (d), and (e) have been done twice, similar results obtained.
Extended Data Fig. 5 |
Extended Data Fig. 5 |. Additional control analyses for the mediation effect of Lac-Phe on metformin-associated BMI reduction.
(a) Schematic of the two subgroups of MESA in the post-hoc subgroup analysis stratified by ΔBMI. The change in BMI of the complete MESA sample prior to subgroup analysis was 0.24 ± 0.04 kg/m2, n = 3645. Participants with increased BMI are shown in red; participants with decreased BMI are shown in blue. (b-d) The mediation model in Fig. 3b was reordered to test if ΔBMI partially mediates the relationship between metformin use (exposure) and Lac-Phe levels (outcome). (b) Among MESA participants with decreased BMI, the total effect of metformin use on Lac-Phe levels was assessed in an ‘unmediated model’ using an age- and sex-adjusted linear regression model. (c) To construct mediation models, the individual associations of metformin use, lac-phe, lactate, and ΔBMI were assessed using linear regression models as described in Methods. The direct effect of metformin use on Lac-Phe levels was then assessed using an age- and sex-adjusted linear regression model adjusted for ΔBMI. No reduction in the direct effect of metformin on Lac-Phe levels was appreciated compared to the total effect of metformin on Lac-Phe in the unmediated model suggesting no meditation. (d) The mediation effect of ΔBMI derived from the mediation models in (c), n = 1184. Values are median with 95% confidence intervals. Statistical significance were calculated using nonparametric bootstrapping with the percentile method. (e-g) The mediation effects of Lac-Phe and lactate on the effect of metformin-associated BMI increase. (e) Among MESA participants with increased BMI, the total effect of metformin use on ΔBMI was assessed in an ‘unmediated model’ using an age- and sex-adjusted linear regression model. (f) To construct mediation models, the individual associations of metformin use, Lac-Phe, lactate, and ΔBMI were assessed using linear regression models as described in Methods. The direct effect of metformin use on ΔBMI was then assessed using an age- and sex-adjusted linear regression model adjusted for either Lac-Phe (left) or lactate (right). No reduction in the direct effects of metformin on ΔBMI compared to the total effect of metformin on ΔBMI in the unmediated model suggested no meditation effect of either Lac-Phe or lactate. (g) The mediation effects of Lac-Phe and lactate. derived from the mediation models in (f), n = 1460. Values are plotted as mean with 95% confidence intervals. Confidence intervals and statistical significance (unadjusted p values) were calculated using nonparametric bootstrapping with the percentile method, as described in Methods. (h) The mediation effects of additional 136 metabolites measured in MESA participants with decreased BMI using the amide negative LC-MS method. Seven out of the 136 tested metabolites were found to have a predicted mediation effect with unadjusted p-value ≤ 0.05 (right). Values are median values with 95% confidence intervals. The confidence intervals and statistical significance of the predicted mediation effects for these seven metabolites were calculated using nonparametric bootstrapping with the percentile method (n = 1619), as described in Methods.
Extended Data Fig. 6 |
Extended Data Fig. 6 |. Physiological effects of metformin and Lac-Phe treatments in DIO mice.
(a) Glucose levels of WT and CNDP2-KO DIO mice (12–14 week-old, male) during GTT after receiving metformin (300 mg/kg, PO) 30 minute before receiving glucose (1 g/kg, i.p.). N = 5 per group. (b) Circulating PYY levels in WT and CNDP2-KO DIO mice (12–14 week-old, male) after metformin treatment (300 mg/kg, PO). N = 5 per group. (c) Glucose levels of C57BL/6J DIO mice (14–15 week-old, male) during GTT after receiving Lac-Phe (50 mg/kg, i.p.) or vehicle control 30 minute before receiving glucose (1 g/kg, i.p.). N = 6 per group. (d) Glucose levels of C57BL/6J DIO mice (14–15 week-old, male) during ITT after receiving Lac-Phe (50 mg/kg, i.p.) or vehicle control 30 minute before receiving insulin (1 U/kg, i.p.). N = 6 per group. (e) Glucose levels of C57BL/6J DIO mice (14–15 week-old, male) during PTT after receiving Lac-Phe (50 mg/kg, i.p.) or vehicle control 30 minute before receiving sodium pyruvate (2.5 g/kg, i.p.). N = 7 per group. (f) Effect of GDF15 on body weight in C57BL/6J DIO mice (12–14 week-old, male) after receiving anti-GFRAL antibody or control IgG. N = 5 per group. P values in (a) and (c-e) were measured with two-sided two-way ANOVA. P values in (b) and (f) were calculated with two-sided Welch t tests. All error bars are SEM.
Fig. 1 |
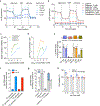
Fig. 1 |. Metformin increases Lac-Phe levels in vivo and in vitro.
a,b, Plasma levels of metformin (a) and Lac-Phe (b) before and after 3 months of metformin treatment in the Stanford cohort (n = 21). c, Plasma levels of Lac-Phe in participants of MESA on metformin (n = 179) compared to participants not on metformin (n = 3,477). Dashed lines indicate medians and quartiles. d, Plasma levels of Lac-Phe by increasing quartiles of metformin use among the 179 participants on metformin. e, Relative plasma Lac-Phe levels in 12–14-week-old male C57BL/6J DIO mice at the indicated time point after administration of metformin by oral gavage (n = 5 per group). f, Absolute quantitation of plasma Lac-Phe concentrations in 12–14 week-old male C57BL/6J DIO mice before and 1 h after 300 mg kg−1 metformin oral gavage (n = 5); 100 mg kg−1, 300 mg kg−1 and 600 mg kg−1 corresponds to 0.60 × 10⁶ nmol kg−1, 1.81 × 10⁶ nmol kg−1 and 3.62 × 10⁶ nmol kg−1, respectively. g, Lac-Phe concentrations in conditioned media from the indicated cell lines and primary cells when treated with metformin overnight at doses indicated (n = 3 per concentration). h,i, Percentage inhibition of basal respiration (n = 5 per concentration) (h) and Lac-Phe concentration in media (n = 3 per concentration) (i) following overnight treatment of primary macrophages with the indicated biguanide at the indicated concentrations. j, Fold-change of labeled and unlabeled media Lac-Phe levels in primary macrophage (n = 3 per condition) using either 12C-labeled or 13C-labeled glucose. k, Schematic illustration of intracellular glycolysis-derived lactate as a source for metformin-induced Lac-Phe production. P values in a, b and f were calculated with two-sided paired t-tests. P value in c was generated using linear regression models adjusting for age, sex, fasting plasma glucose, total cholesterol and hypertension status. P value in d was generated using the one-sided Jonckheere–Terpstra test for trend. P values in g were calculated with a two-sided Welch’s ANOVA test. The n numbers in gj represent independent biological samples. Error bars, s.e.m.
Fig. 2 |
Fig. 2 |. Gut epithelial CNDP2+ cells are primary sources of basal and metformin-inducible Lac-Phe.
ac, Relative Lac-Phe levels in media of WT or CNDP2-KO in primary macrophages (a), Caco-2 cells (b) or BV-2 cells (c) after overnight treatment with metformin at the indicated concentration (n = 3 per condition). d, Relative plasma Lac-Phe levels in 12–14-week-old male WT or global CNDP2-KO DIO mice in the basal state or 1 h after treatment with metformin (300 mg kg−1, PO) (n = 6 for WT; n = 7 for CNDP2-KO). e, Western blotting using an anti-CNDP2 antibody in peritoneal macrophages, gut or kidney tissues isolated from mice of the indicated genotypes. fg, Relative plasma Lac-Phe levels in the basal state or 1 h after treatment with metformin (300 mg kg−1, PO) in the indicated genotypes (n = 5 for Vil1Cre−/−; Cndp2fl/fl; n = 6 for Vil1Cre+/−; Cndp2fl/fl; 7–8 weeks old, mixed sexes; n = 8 for lysMCre−/−; Cndp2fl/fl; n = 10 for lysMCre+/−; Cndp2fl/fl; 18 weeks old, male). P values in ac were calculated with two-sided multiple unpaired t-tests with Welch and Bonferroni–Dunn corrections. P values in d, f and g were calculated with two-sided multiple paired t-tests with Holm–Šídák corrections. The n numbers in ac represent independent biological samples. Western blot experiments in e were done twice with similar results obtained. Error bars, s.e.m.
Fig. 3 |
Fig. 3 |. Lac-Phe mediates the effect of metformin on ΔBMI in a post-hoc subgroup analysis of MESA participants.
a, The total effect of metformin use on ΔBMI in an ‘unmediated model’ using an age-adjusted and sex-adjusted linear regression model. b, Mediated models with Lac-Phe and lactate on the association of metformin use and ΔBMI. The direct effect of metformin use on ΔBMI was assessed using an age-adjusted and sex-adjusted linear regression model adjusted for either Lac-Phe (left) or lactate (right). Individual associations of metformin use, Lac-Phe, lactate and ΔBMI were assessed using linear regression models as described in the Methods. cd, Graph showing the confidence intervals and statistical significance of the mediation effects of Lac-Phe and lactate (n = 1,184) (c) and GDF15 and GDF8 (n = 909) (d) on the association of metformin use and ΔBMI. Values are plotted as median with 95% confidence intervals. For c and d, the confidence intervals and statistical significance (unadjusted P values) were calculated using a nonparametric bootstrapping with the percentile method as described in the Methods; ns, not significant.
Fig. 4 |
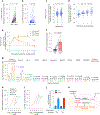
Fig. 4 |. Effects of metformin on body weight in CNDP2-KO mice.
a,b, Cumulative food intake (a) and change in body weight (b) in 10–14-week-old male WT and CNDP2-KO DIO mice following chronic metformin treatment (300 mg kg–1 daily, PO); n = 6 for KO-saline, n = 7 for other groups. c, Change in body weight of 14–16-week-old male WT and CNDP2-KO DIO mice with increasing doses of metformin treatment (100 mg kg−1, PO, 3 days; 300 mg kg−1, PO, 3 days; 600 mg kg−1, PO, 3 days); n = 11 for WT, n = 9 for CNDP2-KO. d,e, Plasma GDF15 (d) or GLP-1 (e) at the indicated time point in 12–14-week-old male WT and CNDP2-KO DIO mice after a single administration of metformin (300 mg kg−1, PO). For GDF15, n = 5 except for WT, 4 h (n = 4); for GLP-1, n = 5. fi, Change in food intake (f,h) and the delta change in body weight (g,i) in 12–16-week-old male WT and CNDP2-KO mice 24 h after a single administration of GDF15 (4 nmol kg−1, subcutaneous; f and g) or 24 h after a single administration of semaglutide (10 nmol kg−1, subcutaneous; h and i); n = 5 for WT, n = 6 for CNDP2-KO. For g and i, the delta values were calculated relative to the effect of vehicle treatment within the same mouse. j, Change in body weight of 12–14-week-old male DIO mice following the indicated treatment. The following dosages were used: Lac-Phe (50 mg kg−1 d−1, i.p.); anti-GFRAL or control IgG (10 mg kg−1 on days 0, 3 and 6); n = 5 per group. P values in ac and j were calculated with two-way ANOVA. P values in di were calculated with two-sided Welch t-tests. Error bars, s.e.m.

Similar articles

Cited by

References

    1. LaMoia TE & Shulman GI Cellular and molecular mechanisms of metformin action. Endocr. Rev 42, 77–96 (2021). - PMC - PubMed
    1. Foretz M, Guigas B, Bertrand L, Pollak M & Viollet B Metformin: from mechanisms of action to therapies. Cell Metab 20, 953–966 (2014). - PubMed
    1. Diabetes Prevention Program Research Group. Long-term safety, tolerability, and weight loss associated with metformin in the Diabetes Prevention Program Outcomes Study. Diabetes Care 35, 731–737 (2012). - PMC - PubMed
    1. Knell G, Li Q, Pettee Gabriel K & Shuval K Long-term weight loss and metabolic health in adults concerned with maintaining or losing weight: findings from NHANES. Mayo Clin. Proc 93, 1611–1616 (2018). - PMC - PubMed
    1. Apolzan JW et al. Long-term weight loss with metformin or lifestyle intervention in the Diabetes Prevention Program Outcomes Study. Ann. Intern. Med 170, 682–690 (2019). - PMC - PubMed

Publication types

Grants and funding