. 2024 May;25(5):2278-2305.
doi: 10.1038/s44319-024-00117-6. Epub 2024 Mar 18.

SorLA restricts TNFα release from microglia to shape a glioma-supportive brain microenvironment

Affiliations

SorLA restricts TNFα release from microglia to shape a glioma-supportive brain microenvironment

Paulina Kaminska et al. EMBO Rep. 2024 May.

Abstract

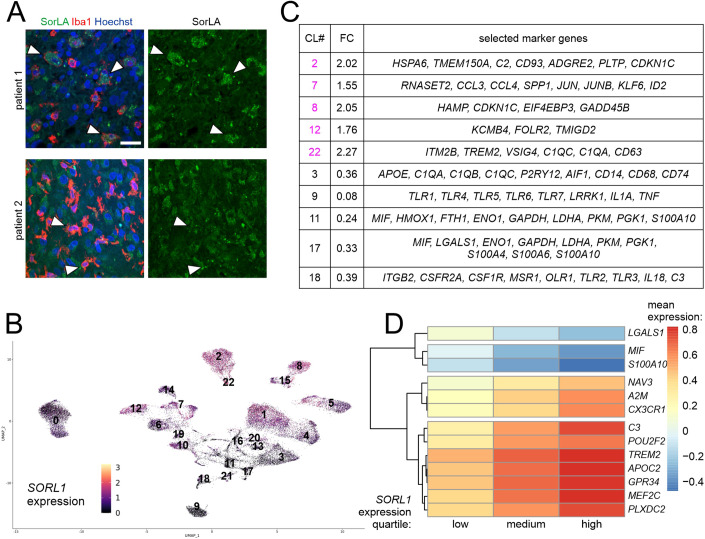
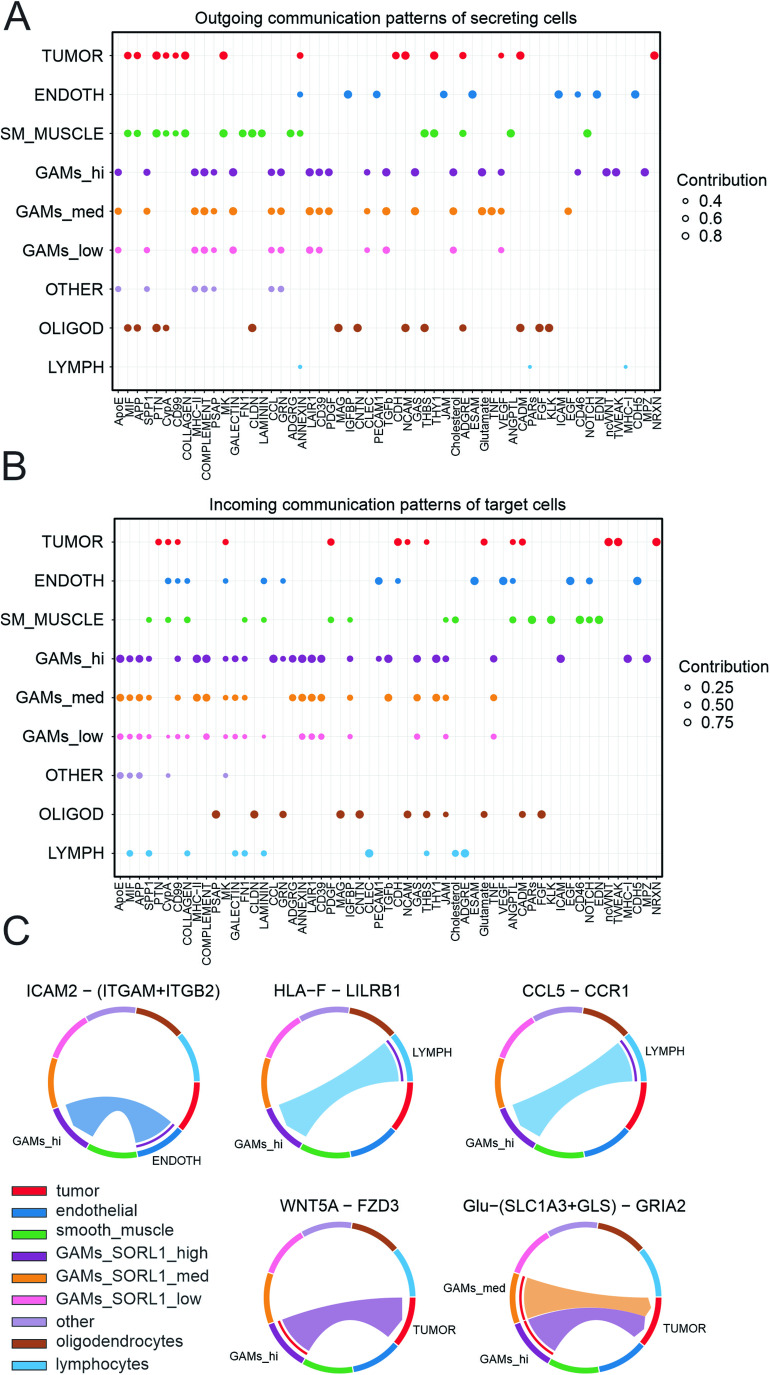
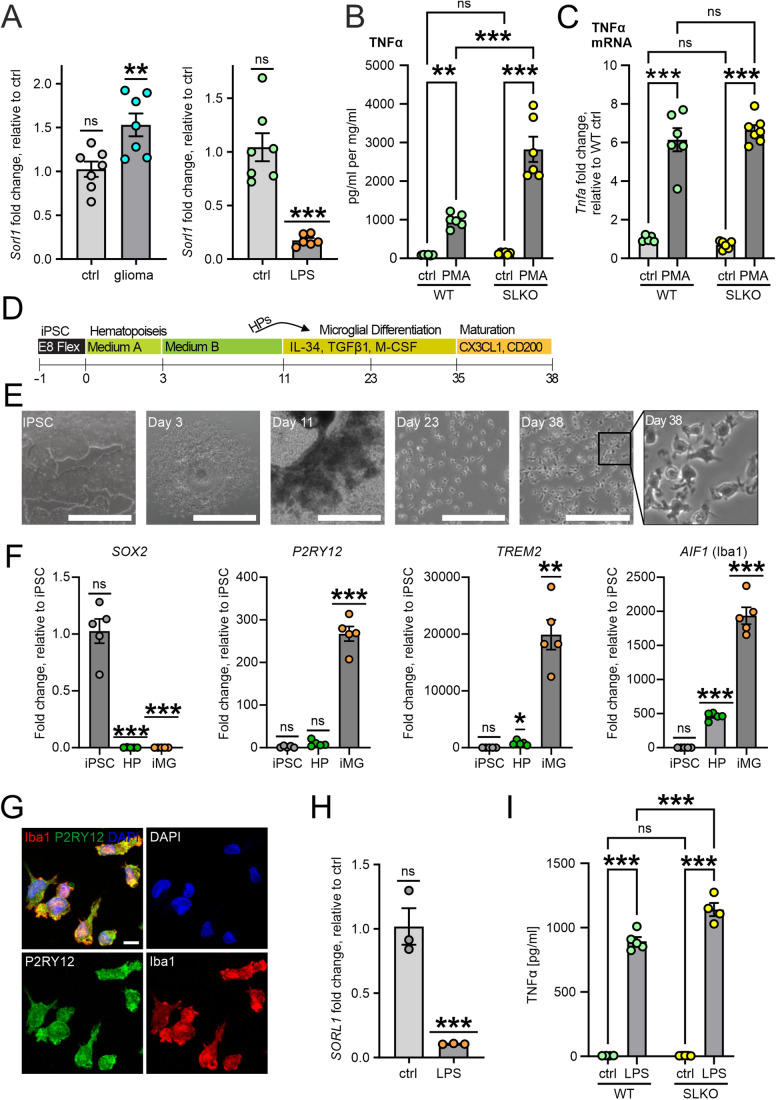
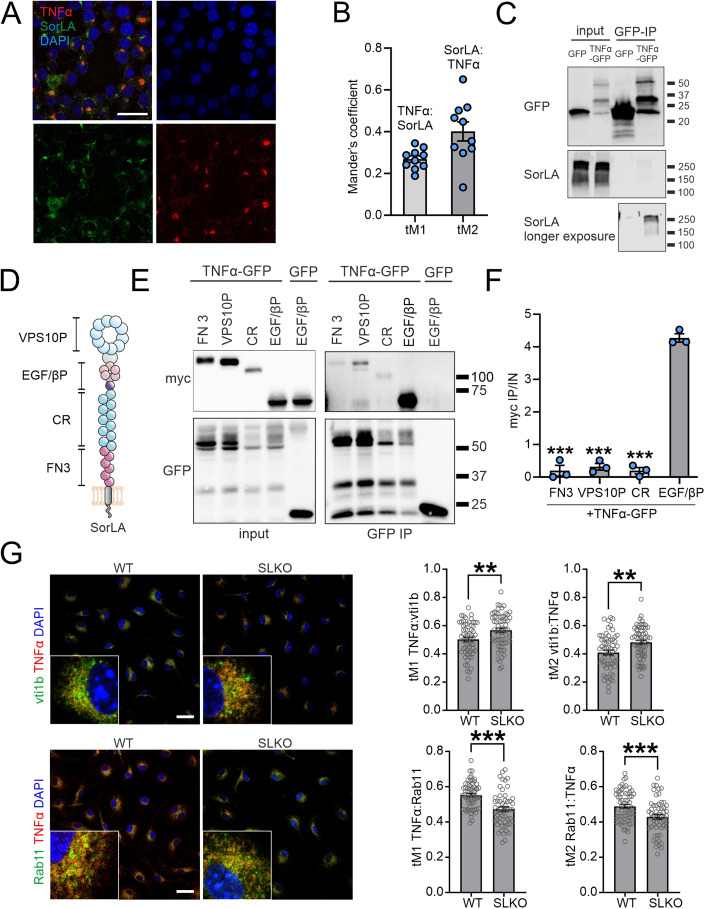
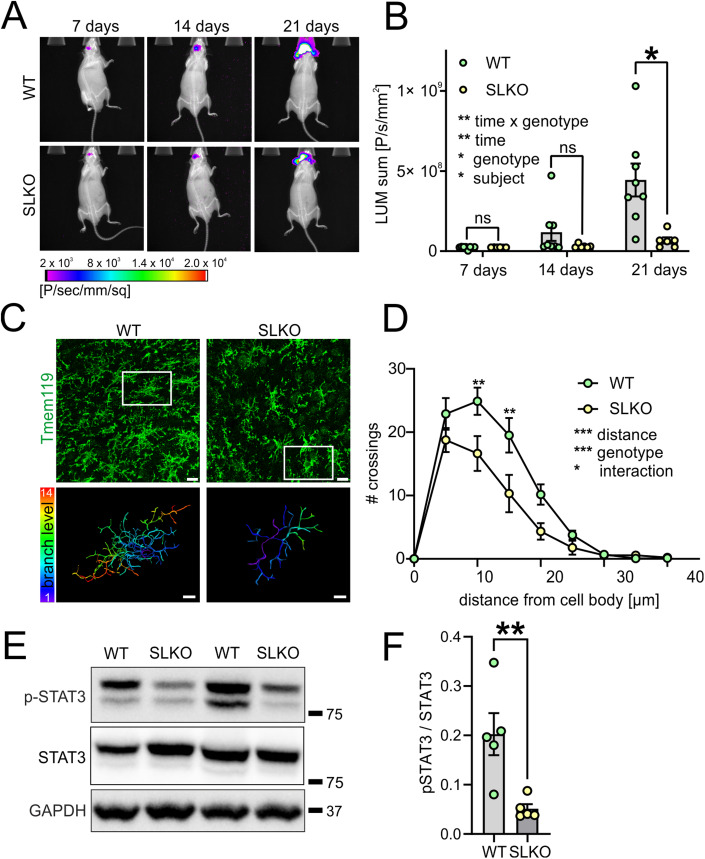
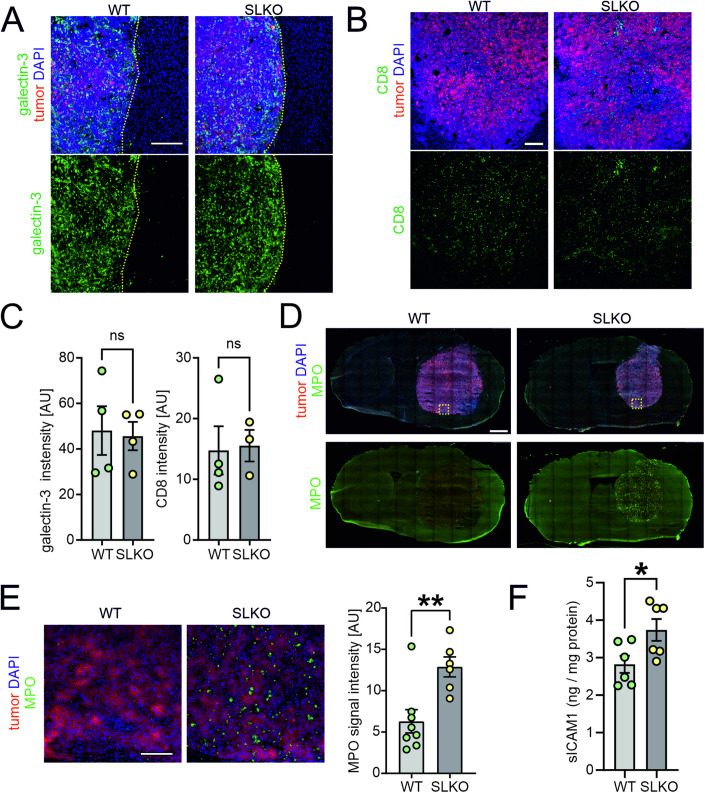
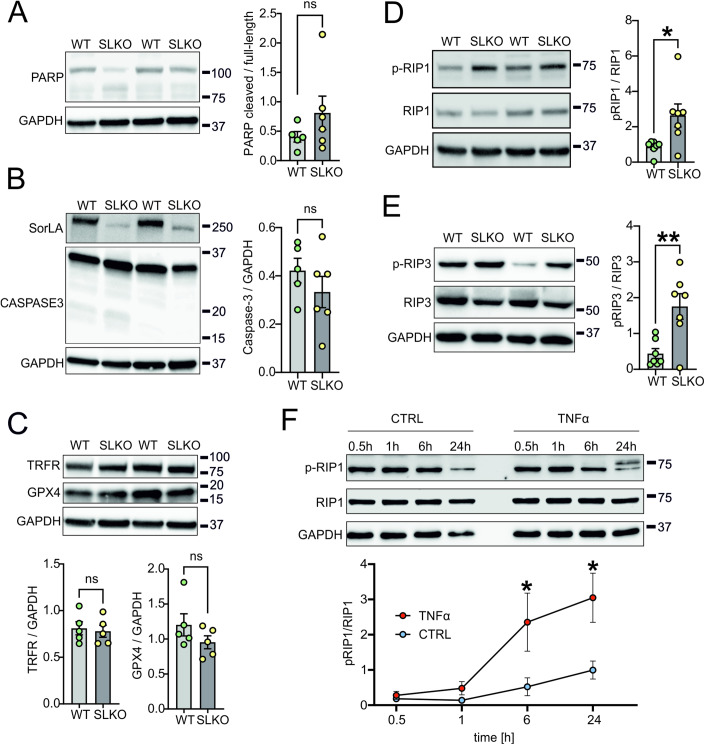
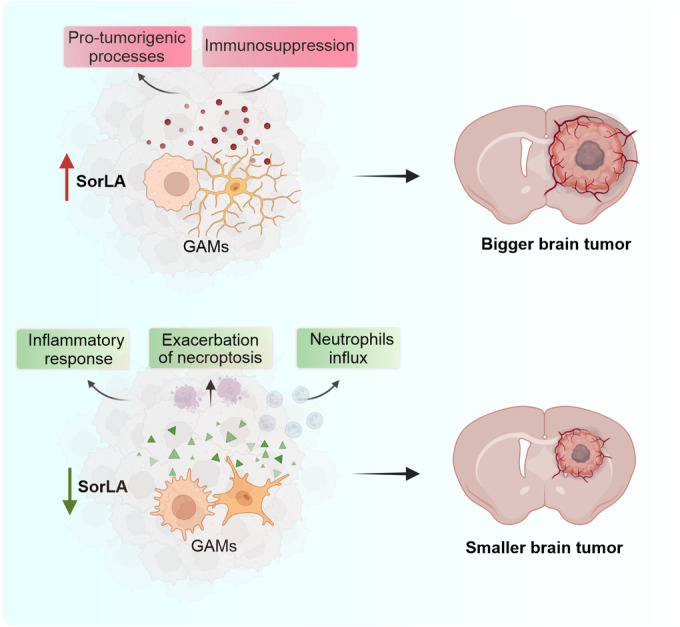
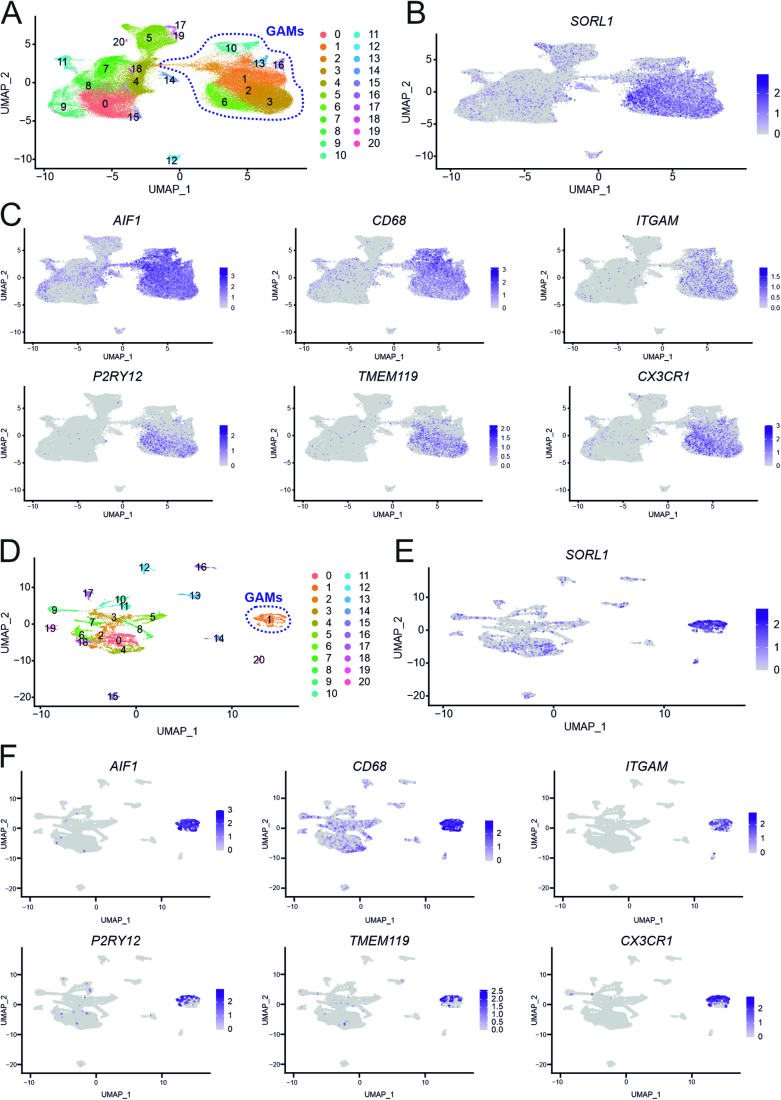
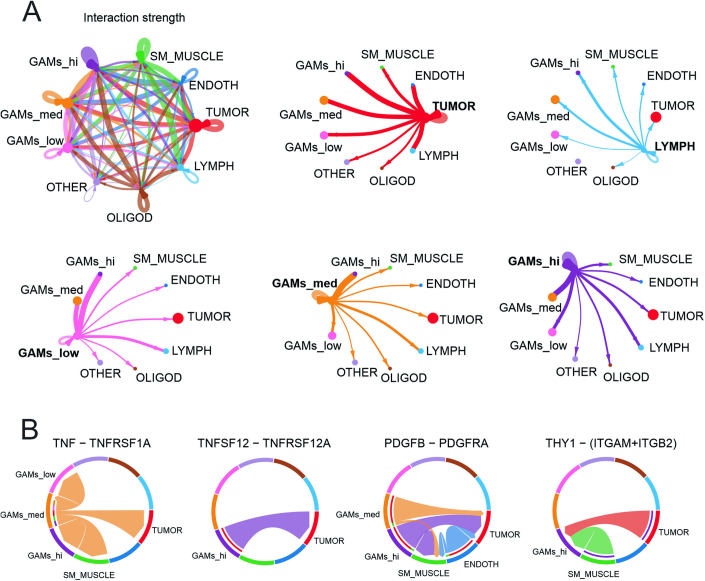
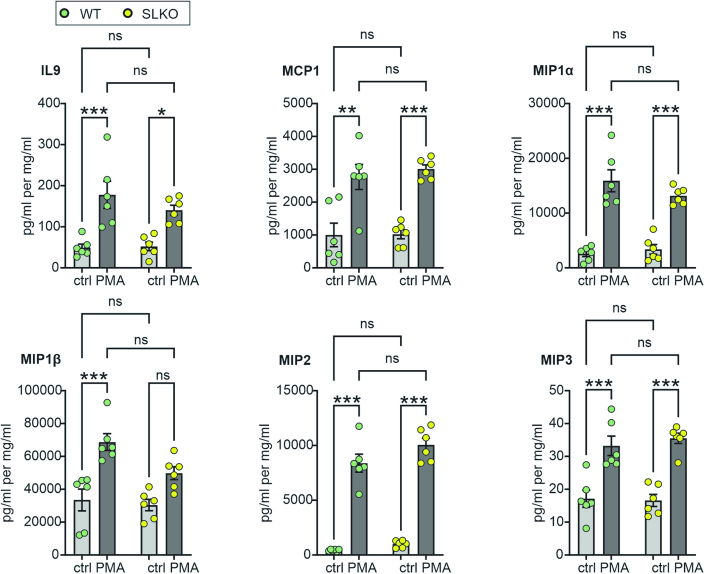
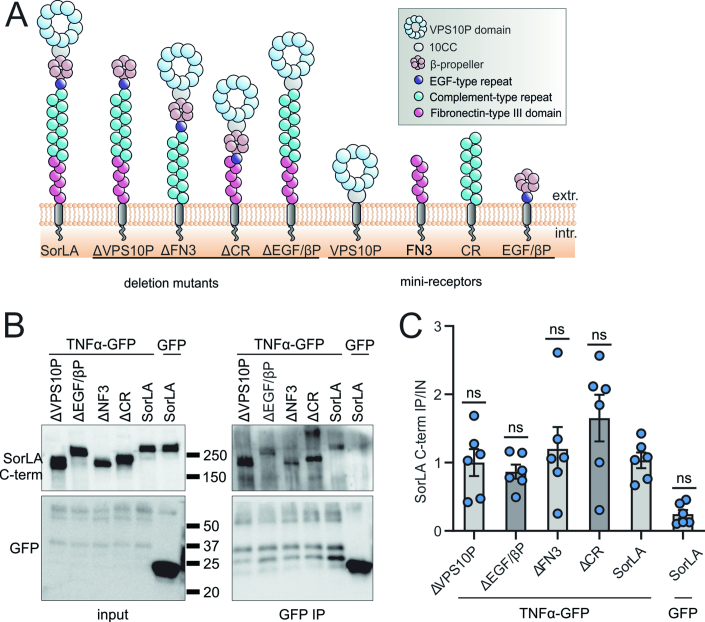
SorLA, encoded by the gene SORL1, is an intracellular sorting receptor of the VPS10P domain receptor gene family. Although SorLA is best recognized for its ability to shuttle target proteins between intracellular compartments in neurons, recent data suggest that also its microglial expression can be of high relevance for the pathogenesis of brain diseases, including glioblastoma (GBM). Here, we interrogated the impact of SorLA on the functional properties of glioma-associated microglia and macrophages (GAMs). In the GBM microenvironment, GAMs are re-programmed and lose the ability to elicit anti-tumor responses. Instead, they acquire a glioma-supporting phenotype, which is a key mechanism promoting glioma progression. Our re-analysis of published scRNA-seq data from GBM patients revealed that functional phenotypes of GAMs are linked to the level of SORL1 expression, which was further confirmed using in vitro models. Moreover, we demonstrate that SorLA restrains secretion of TNFα from microglia to restrict the inflammatory potential of these cells. Finally, we show that loss of SorLA exacerbates the pro-inflammatory response of microglia in the murine model of glioma and suppresses tumor growth.

Keywords: Brain Tumors; Glioblastoma; Intracellular Sorting; Phenotypic Polarization; VPS10P Domain Receptors.


Conflict of interest statement

The authors declare no competing interests.

Figures

Figure 1
Figure 1. SORL1 expression in human GAMs is linked to their functional properties.
(A) SorLA is present in Iba1+ cells in some patients (#1) but absent from these cells in other cases (#2). White arrowheads indicate selected Iba1+ cells. Scale bars, 25 µm. (B) UMAP plot showing SORL1 expression levels normalized with SCT, in clusters of human GAMs. (C) Selected marker genes of 5 GAMs clusters with the highest and 5 clusters with the lowest SORL1 expression levels. CL#, cluster number; FC, SORL1 expression fold change, mean cluster expression against mean expression in remaining clusters. (D) Hierarchical clustering of the most significant genes based on the mean values of standardized gene expression data. These genes were returned by MCFS-ID with the highest RI values and showed differential expression in the context of discretized values of SORL1 gene expression.
Figure 2
Figure 2. CellChat analysis reveals distinct interaction networks between cell populations in newly diagnosed GBM tumors.
(A, B) Dot plots showing relative contributions of signaling pathways to the outgoing signaling patterns of secreting cells (A) and incoming signaling patterns of target cells (B) for distinct cell populations inferred from ndGBM in Abdelfattah et al. The dot size is proportional to the strength of the contribution score. The higher contribution score, the higher enrichment of the signaling pathways in the corresponding cell group. Tumor cells (tumor), endothelial cells (endoth), smooth muscle cells (sm_muscle), GAMs, oligodendrocytes (oligod) and lymphocytes (lymph) were selected based on expression of marker genes (Appendix Tables S4–S7; Dataset EV1). GAMs with low, medium and high-SORL1 expression levels (GAMs_low, GAMs_med, GAMs_hi) were separated prior to analysis. (C) Chord diagrams indicating selected ligand-receptor pairs mediating interaction between cell populations. The width of chords is proportional to signal strength of a given ligand-receptor pair.
Figure 3
Figure 3. SorLA is differentially regulated by pro- and anti-inflammatory cues and restricts TNFα release from microglia.
(A) Sorl1 mRNA levels in primary murine microglia co-cultured with glioma cells (left) or stimulated with LPS (right) as assessed by qRT-PCR (relative to Hprt1 or β2M, respectively). n = 6–7 biological replicates. (B) TNFα levels as determined by ELISA in cell culture medium from primary WT and SorLA-KO microglia either untreated (ctrl) or treated with PMA for 24 h. TNFα levels were normalized to the protein content in the respective cell lysates. n = 6 biological replicates. (C) Tnfa mRNA levels in primary murine microglia stimulated with PMA as assessed by qRT-PCR (relative to Hprt1). n = 5–7 biological replicates. (D) Outline of the iPSC-to-microglia (iMG) differentiation protocol. (E) Phase contrast images of iPSCs, HPs, and iMG at different stages of the microglia differentiation. Scale bar, 1000 µm (iPSC, day 3, day 11); 200 µm (day 23, day 38). (F) Expression levels of marker genes for pluripotent stem cells (SOX2) and microglia (P2RY12, TREM2, AIF1) in iPSCs, HPs and iMG during microglia differentiation as assessed by qRT-PCR (relative to GAPDH). n = 5 biological replicates. (G) Representative images of human iMG immunostained for microglia markers Iba1 (red) and P2RY12 (green) and counterstained with DAPI (blue). Scale bar, 10 µm. (H) SORL1 mRNA levels in human iMG stimulated with LPS as assessed by qRT-PCR (relative to β2M). n = 3 biological replicates. (I) TNFα levels as determined by ELISA in cell culture medium from WT and SorLA-KO iMG either untreated (ctrl) or treated with LPS for 24 h. n = 4–5 biological replicates. Data information: (AC, F, H, I) Data are presented as mean ± SEM. ns not significant; *P < 0.05; **P  <  0.01; ***P  <  0.001 in one-sample t test compared to 1 (A, F, H) or in two-way ANOVA with Tukey’s multiple comparisons (B, C, I). Source data are available online for this figure.
Figure 4
Figure 4. SorLA interacts with TNFα to regulate its subcellular distribution.
(A) Representative image of SorLA and TNFα immunostaining in BV2 microglial cells stimulated with PMA. Cells were counterstained with DAPI. Scale bar: 25 µm. (B) Results of colocalization analysis performed for SorLA and TNFα signals exemplified in (A) calculated as thresholded Manders coefficients (tM). n = 10 fields of view. (C) Co-immunoprecipitation (co-IP) of SorLA with GFP-tagged TNFα overexpressed in HEK293 cells after GFP-IP. GFP serves as a negative control. (D) Scheme of SorLA protein structure indicating its functional domains. VPS10P VPS10P domain, EGF/βP EGF-type repeat/β-propeller domain, CR complement-type repeat, FN3 fibronectin-type III domain. (E) TNFα preferentially binds the EGF/β-propeller SorLA mini-receptor. Co-immunoprecipitation (co-IP) of myc-tagged SorLA mini-receptors with TNFα-GFP overexpressed in HEK293 cells after GFP-IP. GFP serves as a negative control. (F) Ratios of myc signals in co-IP and input samples (IP/IN) calculated for each transfection variant as in (E). n = 3 biological replicates. (G) Immunostaining for TNFα and the markers of secretory vesicles (Vti1b) and recycling endosome (Rab11) in WT and SorLA-KO microglia. Cells were counterstained with DAPI. Representative images (left) and the results of colocalization analysis (right) calculated as thresholded Manders coefficients (tM) are shown. n = 55–64 cells. Scale bar, 25 µm. Data information: (B, F, G) Data are shown as mean ± SEM. **P  <  0.01; ***P  <  0.001 in one-way ANOVA with Tukey’s multiple comparisons test (compared to EGF/βP; F) or in unpaired two-tailed t test (G). No statistical analysis was performed for (B) as we did not intend to directly compare tM1 and tM2. Source data are available online for this figure.
Figure 5
Figure 5. SorLA deficiency inhibits glioma growth and promotes pro-inflammatory properties of microglia.
(A) Representative images of bioluminescence signals emitted by luciferase-expressing gliomas in WT and SorLA-KO mice at 7, 14, and 21 days post-implantation. Relative signal intensities represented by color are combined with X-ray images. (B) Bioluminescence signals measured as in (A) at indicated days post-implantation. n = 6–8 mice per genotype. (C) Upper panel: representative images of microglia morphology revealed by Tmem119 staining in WT and SorLA-KO mice in glioma margin 21 days post-implantation. Scale bar, 15 µm. The white box indicates the cell reconstructed below. Lower panel shows reconstructed microglia branches; color depicts branch level. Scale bar, 5 µm. (D) Sholl analysis of microglia morphology reconstructed as in (C). n = 4 mice per genotype; for each mouse, five cells were quantified and an average of obtained values was treated as an individual data point. (E) Western blot analysis of p-STAT3 levels in WT and SorLA-KO glioma-bearing hemispheres at 21 days post-implantation. STAT3 and GAPDH are detected as loading controls. (F) Quantification of the western blot analysis as in (E). Signal intensities for p-STAT3 were normalized to STAT3 signals. n = 5 mice per genotype. Data information: (B, D, F) Data are shown as mean ± SEM. ns not significant; *P < 0.05; **P < 0.01; ***P < 0.001 in repeated measures two-way ANOVA with Sidak’s multiple comparisons test (B), in two-way ANOVA with Sidak’s multiple comparison test (D) or in unpaired two-tailed t test (F). Source data are available online for this figure.
Figure 6
Figure 6. Glioma microenvironment of SorLA-KO mice is infiltrated by neutrophils.
(A, B) Representative images of the sections from glioma-bearing WT and SorLA-KO brains 21 days after implantation of GL261-tdTomato+Luc+ cells, immunostained for the markers of macrophages, galectin-3 (A) and cytotoxic T lymphocytes, CD8 (B). Tumor cells are seen in red. Yellow dotted line marks tumor border. Sections were counterstained with DAPI (blue). Scale bars, 200 µm. (C) Galectin-3 and CD8 signal intensities in WT and SorLA-KO glioma-bearing hemispheres. n = 4 mice per genotype. (D) Representative images of murine brains sections 21 days post-implantation stained for neutrophils marker MPO and counterstained with DAPI (blue). Tumor cells are seen in red. Scale bar, 1 mm. Yellow box indicates the area imaged with higher magnification in (E). (E) MPO+ cells in the glioma mass in WT and SorLA-KO brains. Scale bar, 100 µm. Right panel: quantification of MPO signal intensity observed in WT and SLKO mice. n = 6–8 mice per genotype. (F) Levels of sICAM1 in soluble fractions extracted from glioma-bearing brain hemispheres 21 days post-implantation, normalized to protein content. n = 6 mice per genotype. Data information: (C, E, F) Data are presented as mean ± SEM. ns not significant; *P < 0.05; **P < 0.01 in unpaired two-tailed t test. Source data are available online for this figure.
Figure 7
Figure 7. Necroptosis, but not apoptosis or ferroptosis, is activated in gliomas in SorLA-deficient mice.
(AE) Western blot analysis of apoptosis, ferroptosis and necroptosis markers in WT and SorLA-KO glioma-bearing hemispheres at 21 days post-implantation. Graphs present quantification of the western blot analyses. n = 5–7 mice per genotype. (A) Western blot analysis of apoptosis marker PARP which is cleaved upon apoptosis activation to yield bands of lower size. Detection of GAPDH was used as a loading control. Ratio of cleaved and full-length PARP was calculated. (B) Western blot analysis of apoptosis marker caspase-3 which is cleaved upon apoptosis activation. Detection of GAPDH was used as a loading control. Detection of SorLA is also presented. Signal intensity for caspase-3 was normalized to GAPDH. (C) Western blot analysis of ferroptosis markers, TRFR and GPX4. Detection of GAPDH was used as a loading control. Signal intensities for TRFR and GPX4 were normalized to GAPDH. (D) Western blot analysis of necroptosis marker p-RIP1. Detection of RIP1 and GAPDH was used as a control. Signal intensity for p-RIP1 was normalized to RIP1. (E) Western blot analysis of necroptosis marker p-RIP3. Detection of RIP3 and GAPDH was used as a control. Signal intensity for p-RIP3 was normalized to RIP3. (F) Upper panel: western blot analysis of a necroptosis marker p-RIP1 in cultured glioma GL261 cells treated with 20 ng/ml TNFα for indicated time. Cells kept in serum-free medium serve as a control (CTRL). Detection of RIP1 and GAPDH was used as a loading control. Lower panel: quantification of western blot results from three biological replicates. Signal intensity for p-RIP1 was normalized to RIP1. Data information: (AF) data are presented as mean ± SEM. ns not significant; *P < 0.05; **P < 0.01 in unpaired two-tailed t test (AE) or in two-way ANOVA with Sidak’s multiple comparisons test (F). Source data are available online for this figure.
Figure 8
Figure 8. SorLA has impact on the properties of GAMs, and in consequence on the glioma microenvironment and tumor growth.
Summary of the main findings. High SorLA levels in GAMs are linked to their pro-tumorigenic properties. Loss of SorLA elicits enhanced inflammatory response, necroptosis and neutrophils influx to the glioma microenvironment, which coincides with inhibition of tumor growth in a murine model of GBM. Created with Biorender.com.
Figure EV1
Figure EV1. SORL1 is expressed in GAMs.
(A) UMAP projection of single cells from human ndGBM tumors described in Abdelfattah et al, grouped in 21 clusters. Clusters identified as GAMs are indicated with purple dashed line. (B, C) UMAP projections presenting expression of SORL1 (B) and GAMs marker genes (C) in all clusters as exemplified in (A). Expression levels are normalized with SCT. (D) UMAP projection of single cells from human GBM tumors described in Neftel et al, grouped in 21 clusters. Cluster identified as GAMs is indicated with purple dashed line. (E, F) UMAP projections presenting expression of SORL1 (E) and GAMs marker genes (F) in all clusters as exemplified in (D). Expression levels are normalized with SCT.
Figure EV2
Figure EV2. Interaction networks between cell populations in newly diagnosed GBM tumors.
(A) Network plots showing strength of ligand-receptor interactions between cell populations. The line width is proportional to the number of ligand-receptor pairs identified. (B) Chord diagrams indicating selected ligand-receptor pairs mediating interaction between cell populations. Width of chords is proportional to signal strength of the given ligand-receptor pair.
Figure EV3
Figure EV3. SorLA deficiency has no major impact on microglial cytokine secretion.
Cytokine levels as determined by ELISA in cell culture medium from primary WT and SorLA-KO microglia either untreated (ctrl) or treated with PMA for 24 h. Cytokine levels were normalized to the protein content in the respective cell lysates. n = 6 biological replicates. Data information: data are presented as mean ± SEM. ns not significant; *P < 0.05; **P  <  0.01; ***P  <  0.001 in two-way ANOVA with Tukey’s multiple comparisons test.
Figure EV4
Figure EV4. Binding of SorLA mutants to TNFα.
(A) Schematic representation of SorLA structure and the mutant proteins used in this study. (B) Co-immunoprecipitation (co-IP) of SorLA deletion mutants with TNFα-GFP overexpressed in HEK293 cells after GFP-IP. GFP serves as a negative control. SorLA was detected using an antibody raised against its C-terminus. (C) Quantification of the results of 6 biological replicates as exemplified in (B). Ratio of co-IP and input signals (IP/IN) was calculated for each transfection variant. Data information: (C) Data are presented as mean ± SEM. ns not significant in one-way ANOVA with Tukey’s multiple comparisons test, comparing to full-length SorLA.

References

    1. Abdelfattah N, Kumar P, Wang C, Leu J-S, Flynn WF, Gao R, Baskin DS, Pichumani K, Ijare OB, Wood SL, et al. Single-cell analysis of human glioma and immune cells identifies S100A4 as an immunotherapy target. Nat Commun. 2022;13:767. doi: 10.1038/s41467-022-28372-y. - DOI - PMC - PubMed
    1. Andersen OM, Reiche J, Schmidt V, Gotthardt M, Spoelgen R, Behlke J, von Arnim CAF, Breiderhoff T, Jansen P, Wu X, et al. Neuronal sorting protein-related receptor sorLA/LR11 regulates processing of the amyloid precursor protein. Proc Natl Acad Sci USA. 2005;102:13461–13466. doi: 10.1073/pnas.0503689102. - DOI - PMC - PubMed
    1. Bui TM, Wiesolek HL, Sumagin R. ICAM-1: a master regulator of cellular responses in inflammation, injury resolution, and tumorigenesis. J Leukoc Biol. 2020;108:787–799. doi: 10.1002/JLB.2MR0220-549R. - DOI - PMC - PubMed
    1. Caglayan S, Takagi-Niidome S, Liao F, Carlo A-S, Schmidt V, Burgert T, Kitago Y, Füchtbauer E-M, Füchtbauer A, Holtzman DM, et al. Lysosomal sorting of amyloid-β by the SORLA receptor is impaired by a familial Alzheimer’s disease mutation. Sci Transl Med. 2014;6:223ra20. doi: 10.1126/scitranslmed.3007747. - DOI - PubMed
    1. Cavalheiro VJ, Campos ACP, Lima LGCA, Roça CT, Docema MFL, Lancellotti CLP, Martinez RCR, Pagano RL, Chammas R, Teixeira MJ, et al. Unraveling the peripheral and local role of inflammatory cytokines in glioblastoma survival. Cytokine. 2023;161:156059. doi: 10.1016/j.cyto.2022.156059. - DOI - PubMed

MeSH terms

Substances