. 2024 Apr;9(4):938-948.
doi: 10.1038/s41564-024-01626-9. Epub 2024 Mar 18.

High-throughput characterization of bacterial responses to complex mixtures of chemical pollutants

Affiliations

High-throughput characterization of bacterial responses to complex mixtures of chemical pollutants

Thomas P Smith et al. Nat Microbiol. 2024 Apr.

Abstract

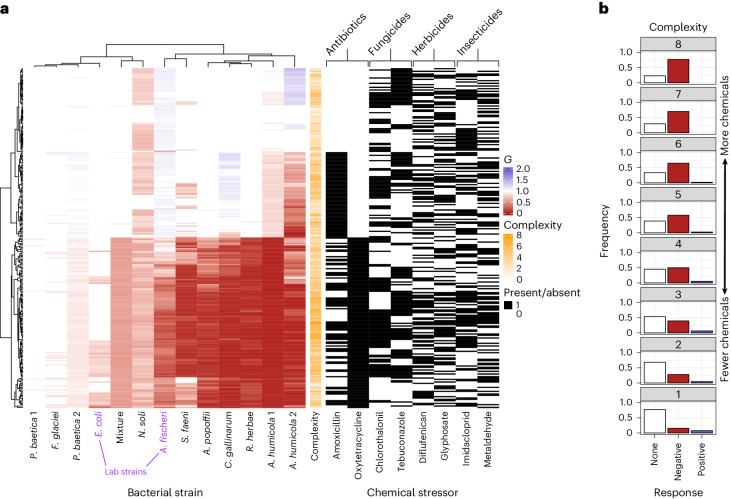
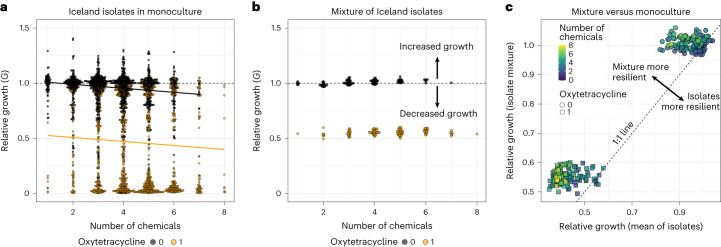
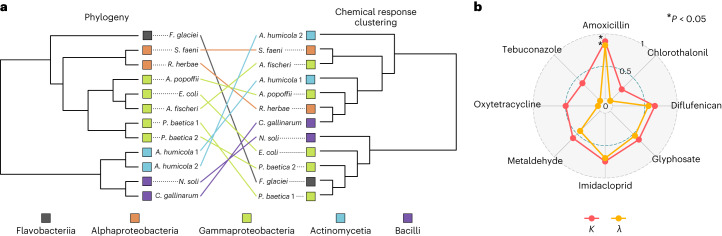
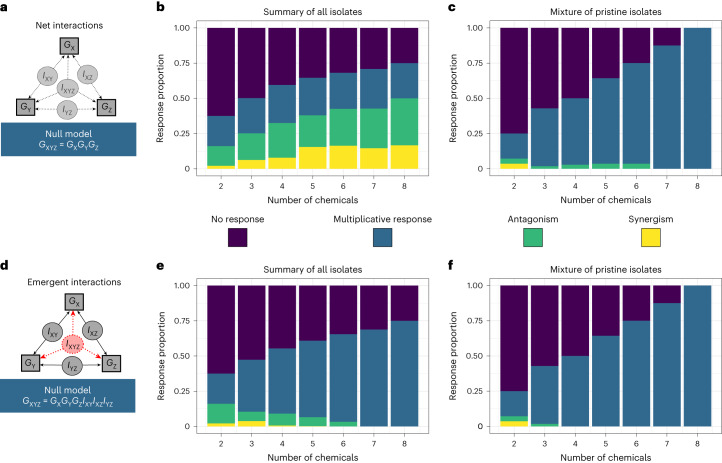
Our understanding of how microbes respond to micropollutants, such as pesticides, is almost wholly based on single-species responses to individual chemicals. However, in natural environments, microbes experience multiple pollutants simultaneously. Here we perform a matrix of multi-stressor experiments by assaying the growth of model and non-model strains of bacteria in all 255 combinations of 8 chemical stressors (antibiotics, herbicides, fungicides and pesticides). We found that bacterial strains responded in different ways to stressor mixtures, which could not be predicted simply from their phylogenetic relatedness. Increasingly complex chemical mixtures were both more likely to negatively impact bacterial growth in monoculture and more likely to reveal net interactive effects. A mixed co-culture of strains proved more resilient to increasingly complex mixtures and revealed fewer interactions in the growth response. These results show predictability in microbial population responses to chemical stressors and could increase the utility of next-generation eco-toxicological assays.


Conflict of interest statement

The authors declare no competing interests.

Figures

Fig. 1
Fig. 1. Chemical stressor responses vary between strains.
a, Heat map of all chemical stressor responses. Left: the mean (n = 4 biologically independent replicates) relative growth (G) in the presence of chemical stressor(s) on a scale from positive responses (blue) to to negative responses (red). Colours are only shown where G is significantly different from 1 (that is, the chemical mixture has a significant impact on growth). Each column is the fingerprint of responses for a given strain; each row is a particular mixture of chemicals. Columns are clustered by similarity between strains; rows are clustered by similarity between responses. Each chemical stressor present in a given mixture is indicated by black lines in the right panel. The number of chemicals in a mixture (‘complexity’) is shown in orange. Model strains are identified in purple; the mixture of strains is highlighted in bold. Chemicals are grouped by their target organisms. b, Proportion of strain and chemical mixtures showing negative, positive or no growth response, grouped by the number of chemicals in the mixture. Most chemicals alone have no impact on most bacteria; however, increasingly complex mixtures of chemicals have increasingly negative effects on growth.
Fig. 2
Fig. 2. Mixtures of increasing numbers of chemical stressors reduce bacterial growth in monoculture but not in community.
a, Combined responses of all environmental bacterial strains to all chemical mixtures, given as growth (area under the growth curve) in chemical mixture relative to control growth for a given strain (G). Dashed line marks 1, below which there is reduced growth and above which there is increased growth. There is bimodality in the responses, with mixtures containing oxytetracycline (orange) showing lower growth on average than those without (black). As the number of chemicals in the mixture increases, growth is on average reduced across strains, both in the presence and absence of oxytetracycline (linear regression, intercept = 1.02, slope = −0.03, oxytetracycline presence = −0.42, P < 2.2 × 10−16, r2 = 0.33). b, Responses of the mixture of environmental strains to all chemical mixtures. There is similar bimodality to the monocultures, due to the presence of oxytetracycline; however, the addition of further chemicals has an almost negligibly small impact on growth (linear regression, intercept = 0.99, slope = 0.005, oxytetracycline presence = −0.46, P < 2.2 × 10−16, r2 = 0.99). c, The mean growth response for the Iceland isolates in monoculture (x axis) against the growth response of the mixed culture (y axis). Points are coloured by the number of chemicals present. Squares are mixtures containing oxytetracycline. Below or above the 1:1 line, the mixed culture shows lower or higher relative growth than the mean of isolates in monoculture, respectively. The mixed culture is more resilient to the negative growth effects of increasingly complex chemical mixtures than the mean of the isolates in monoculture. In all plots, points are a mean of four replicates.
Fig. 3
Fig. 3. Chemical responses are not strongly driven by phylogenetic relatedness.
a, Phylogeny of the bacterial isolates from their 16S sequences juxtaposed against their clustered phenotypic distances based on growth responses to the chemical stressors. These are presented as cladograms for visualization purposes, and thus branch lengths are not indicative of phylogenetic or phenotypic similarity. Strains are coloured by the their taxonomic class, and lines show placement of the same species in the phylogeny and phenotypic clustering. We find no significant correlation between the phylogenetic and phenotypic distance matrices (one-sided Mantel test, P = 0.154). b, Testing for phylogenetic signal in the responses of all strains to each single-chemical treatment, using Blomberg’s K and Pagel’s λ metrics. Briefly, values close to 0 indicate no phylogenetic signal, values of 1 approximate a Brownian motion model of trait evolution; see Methods for full details. P values for λ are derived from a log-likelihood ratio test; P values for K are derived from a randomization test (n = 1,000). Significant phylogenetic signal (P < 0.05) indicated by an asterisk. P values are not adjusted for multiple comparisons. Only the responses to amoxicillin show strong phylogenetic signal (K, P = 0.029; λ, P = 0.037). See Supplementary Table 1 for all P values and test statistics.
Fig. 4
Fig. 4. Quantifying multi-stressor interactions.
a, We tested for net interactions in chemical stressor mixtures by quantifying bacterial growth (G) in mixture and comparing this to growth in the presence of each stressor (here X, Y and Z) individually. A net interaction can be caused by any of the specific interactions (I) that occur within a mixture. For the three-chemical example, this includes all possible two-way interactions as well as the three-way emergent interaction, and thus the null model contains terms for the individual stressor responses only. b,c, Bars summarize the proportion of occurrences of each net interaction type (multiplicative response, blue; antagonistic, green; synergistic, yellow; no response, purple) for every mixture of a given number of chemicals, for every strain of bacteria in monoculture (b) and the mixed culture (c). d, We test for emergent interactions (here the three-way interaction, red) using a null model which accounts for all lower-order terms. e,f, The proportion of occurrences of emergent interactions for all monoculture isolates (e) and the mixed culture (f).
Fig. 5
Fig. 5. Lower-level interactions persist in higher-complexity chemical mixtures.
Net interactions visualized as networks for each strain. Each point represents a different chemical mixture with the bottom row representing each individual chemical (designated by the first character of their name below the point) and every subsequent row above being a more complex mixture of these chemicals, finishing with a single point for the eight-chemical mixture. Nodes without a significant interaction are left as unfilled circles; nodes with interactions are larger and coloured by antagonism (teal) or synergism (yellow). Edges are drawn between nodes with significant interactions one row apart where the mixture below is a subset of the mixture above. Strains P. baetica 1 and F. glaciei are omitted from this figure due to a lack of interactions to visualize (P. baetica no interactions, F. glaciei a single net interaction). Networks are ordered here based on the phylogeny (Fig. 3a).

Similar articles

Cited by

References

    1. Jackson MC, Pawar S, Woodward G. The temporal dynamics of multiple stressor effects: from individuals to ecosystems. Trends Ecol. Evol. 2021;36:402–410. doi: 10.1016/j.tree.2021.01.005. - DOI - PubMed
    1. Jones KR, et al. One-third of global protected land is under intense human pressure. Science. 2018;360:788–791. doi: 10.1126/science.aap9565. - DOI - PubMed
    1. Stehle S, Schulz R. Agricultural insecticides threaten surface waters at the global scale. Proc. Natl Acad. Sci. USA. 2015;112:5750–5755. doi: 10.1073/pnas.1500232112. - DOI - PMC - PubMed
    1. Thompson MSA, et al. Gene-to-ecosystem impacts of a catastrophic pesticide spill: testing a multilevel bioassessment approach in a river ecosystem. Freshw. Biol. 2016;61:2037–2050. doi: 10.1111/fwb.12676. - DOI
    1. Gautam, K. & Anbumani, S. Ecotoxicological effects of organic micro-pollutants on the environment. in Current Developments in Biotechnology and Bioengineering 481–501 (Elsevier, 2020); 10.1016/b978-0-12-819594-9.00019-x