. 2024 May;11(20):e2307480.
doi: 10.1002/advs.202307480. Epub 2024 Mar 18.

AMPK Suppression Due to Obesity Drives Oocyte mtDNA Heteroplasmy via ATF5-POLG Axis

Affiliations

AMPK Suppression Due to Obesity Drives Oocyte mtDNA Heteroplasmy via ATF5-POLG Axis

Yanting Chen et al. Adv Sci (Weinh). 2024 May.

Abstract

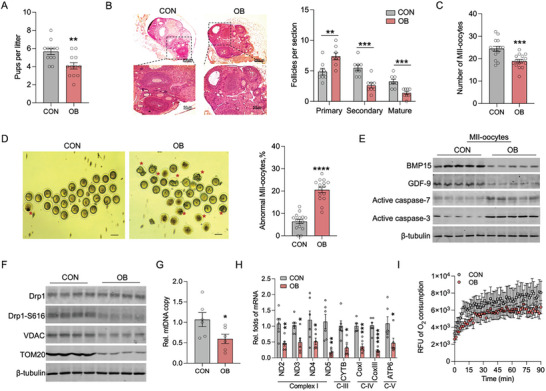
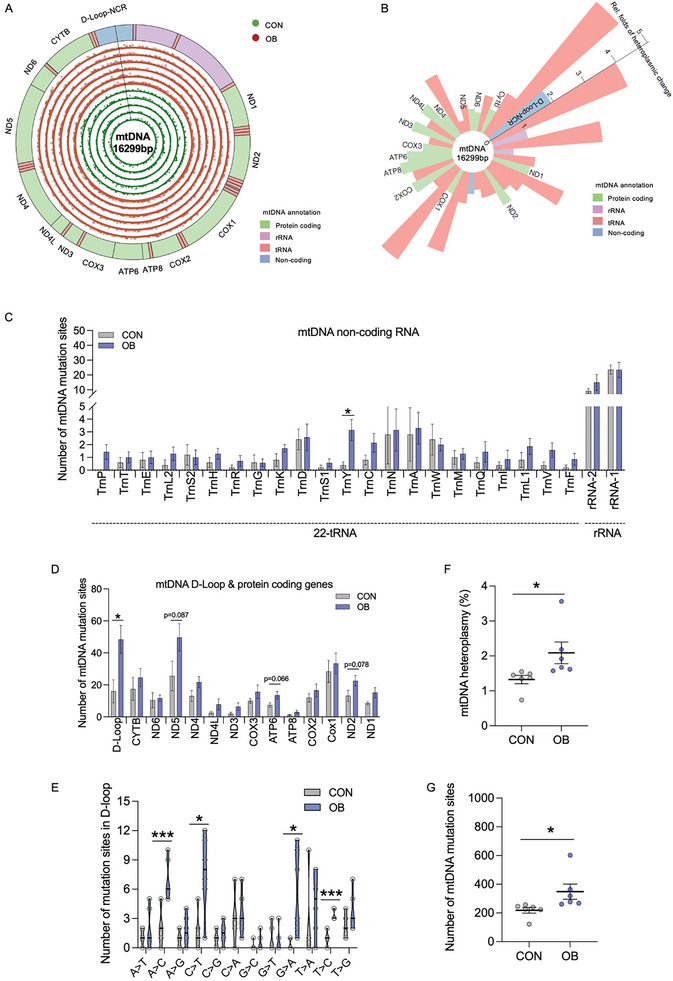
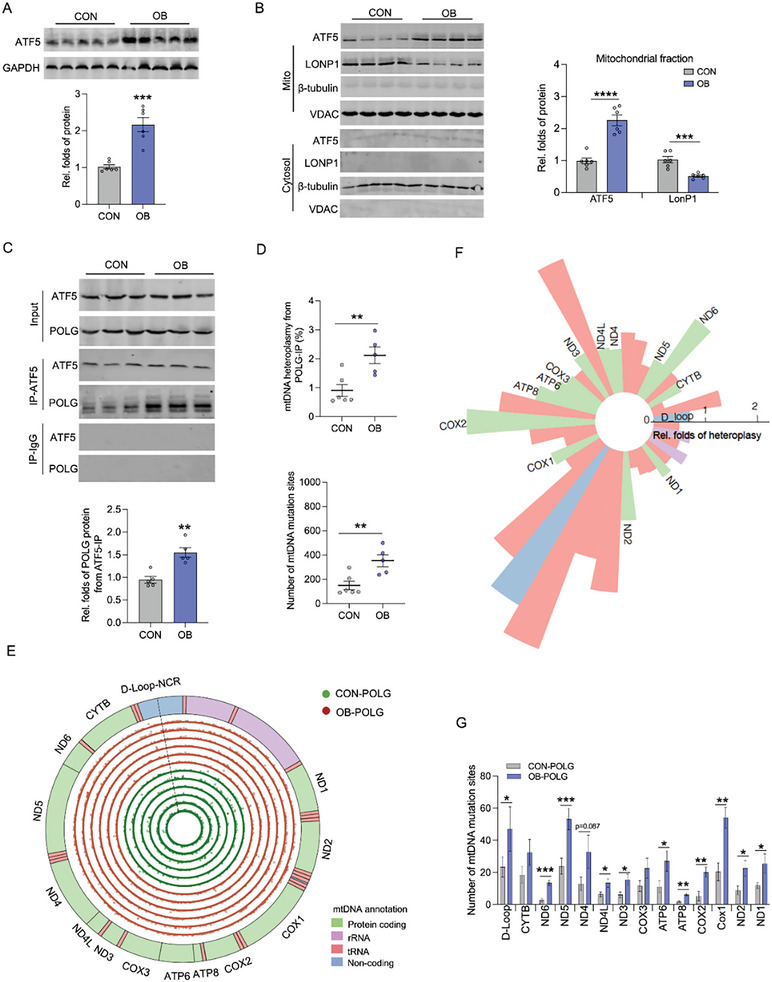
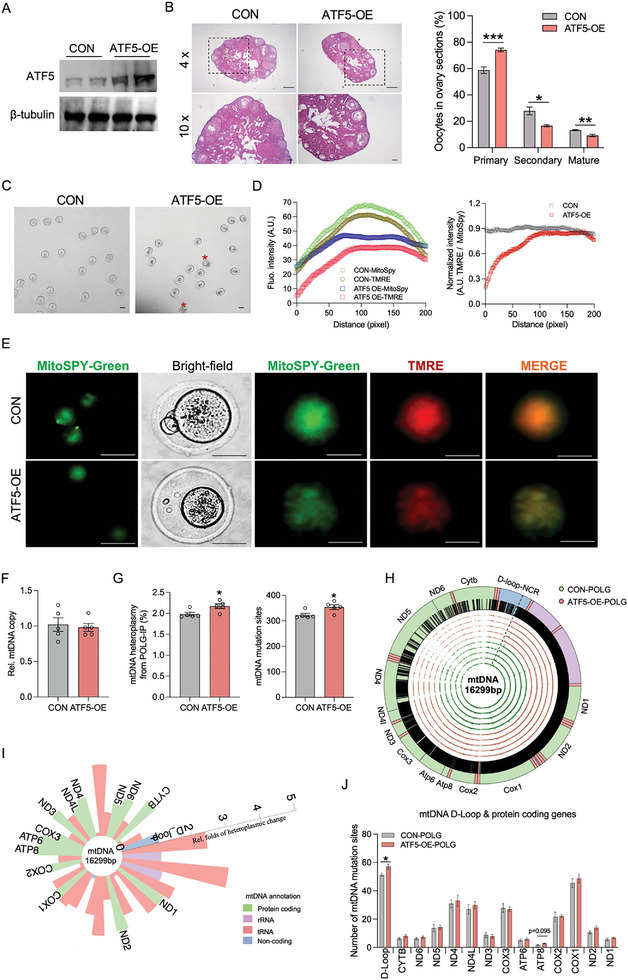
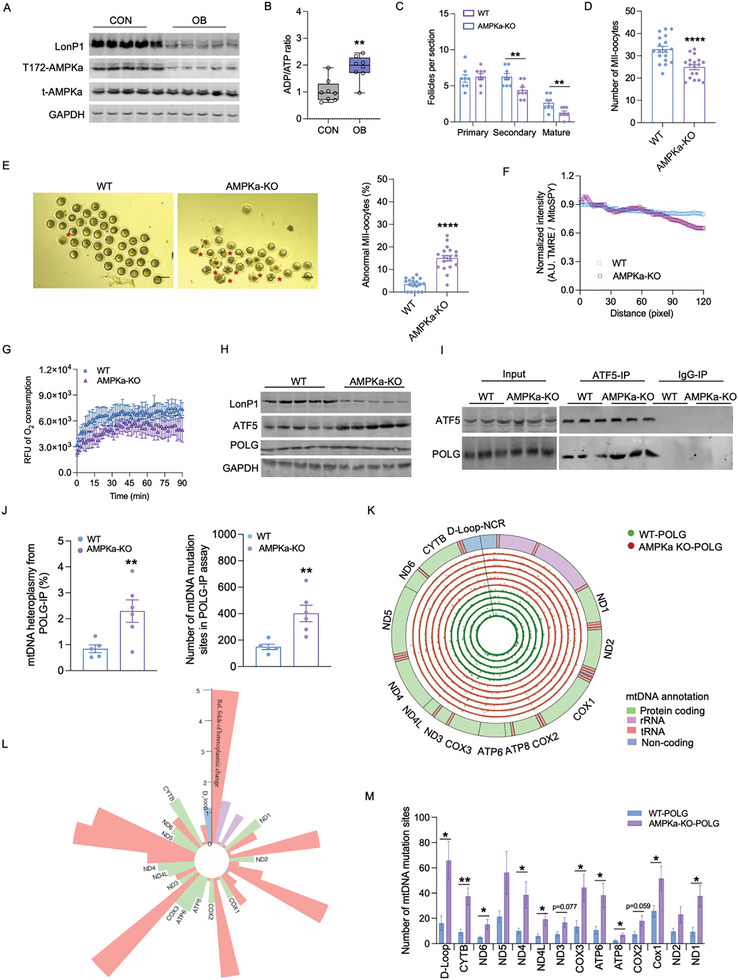
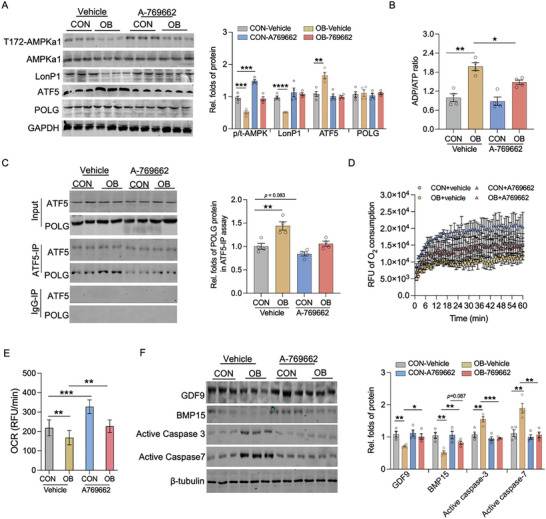
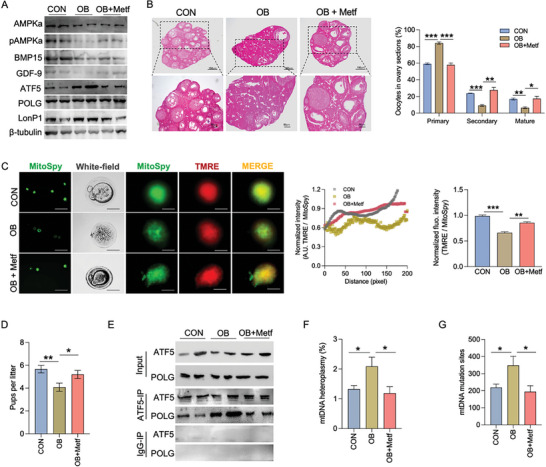
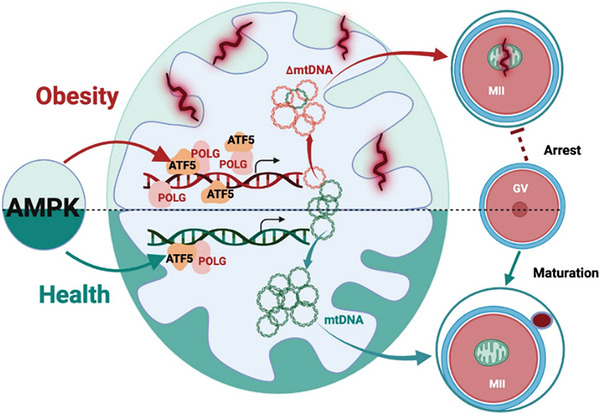
Due to the exclusive maternal transmission, oocyte mitochondrial dysfunction reduces fertility rates, affects embryonic development, and programs offspring to metabolic diseases. However, mitochondrial DNA (mtDNA) are vulnerable to mutations during oocyte maturation, leading to mitochondrial nucleotide variations (mtSNVs) within a single oocyte, referring to mtDNA heteroplasmy. Obesity (OB) accounts for more than 40% of women at the reproductive age in the USA, but little is known about impacts of OB on mtSNVs in mature oocytes. It is found that OB reduces mtDNA content and increases mtSNVs in mature oocytes, which impairs mitochondrial energetic functions and oocyte quality. In mature oocytes, OB suppresses AMPK activity, aligned with an increased binding affinity of the ATF5-POLG protein complex to mutated mtDNA D-loop and protein-coding regions. Similarly, AMPK knockout increases the binding affinity of ATF5-POLG proteins to mutated mtDNA, leading to the replication of heteroplasmic mtDNA and impairing oocyte quality. Consistently, AMPK activation blocks the detrimental impacts of OB by preventing ATF5-POLG protein recruitment, improving oocyte maturation and mitochondrial energetics. Overall, the data uncover key features of AMPK activation in suppressing mtSNVs, and improving mitochondrial biogenesis and oocyte maturation in obese females.

Keywords: AMPK; female obesity; mature oocyte; mtDNA heteroplasmy.


Conflict of interest statement

The authors declare no conflict of interest.

Figures

Figure 1
Figure 1
Obesity impairs oocyte maturation and mtDNA activity. A) Number of pups per litter born from female mice fed control (CON) and obesogenic diet (OB) (n = 12). B) H&E staining of ovaries and follicles. Scale bar 200 µm, 50 µm (n = 8). The number of primary, secondary and antral follicles per section of ovary in CON and OB females (n = 8). C, D) The mature oocytes were collected in the fallopian tubes, and the number of MII oocytes and the proportion of abnormal MII oocytes were counted. Stars indicate the abnormal oocytes, and scale bar 50 µm (n = 15). E) Immunoblotting of oocyte maturation indicators in MII oocytes, including BMP15, GDF‐9, active caspase‐7, and active caspase‐3. β‐Tubulin was used as a loading control (n = 5). F) Immunoblotting of mitochondrial fission and biomass indicators in MII oocytes, including Drp1, Drp1‐S616, VDAC and Tom20. β‐Tubulin was used as a loading control (n = 5). G) mtDNA content in mature oocytes (n = 6). H) mRNA expression of mtDNA genes involved in respiration chain complex (n = 6). I) O2 consumption was measured in mature oocytes (n = 5; 70 oocytes were pooled per replicate). Data are presented as mean ± s.e.m. *P < 0.05, **P < 0.01, ***P < 0.001, and ****P < 0.0001; unpaired two‐tail Student's t test was used in analyses.
Figure 2
Figure 2
Obesity increases mtDNA heteroplasmy in D‐loop and protein‐coding genes. A) Circular plot of the mitochondrial genome shows annotation on the outer circle. Five‐green inner circles and six‐red outside circles show the genomic locations and the relative frequencies of mtDNA mutations in mature oocytes of control (CON; green color) and obese (OB; red color) females, respectively. Regions corresponding to the different mtDNA genes (green, protein coding genes; pink, rRNA; red, tRNA; blue, non‐coding regions). B) Relative folds of mutation rates in various mtDNA genomic regions. The heteroplasmic change was OB compared with controls. Regions corresponding to the different mtDNA genes (green, protein coding genes; pink, rRNA; red, tRNA; blue, non‐coding regions). C, D) Number of mtDNA mutation sites in mtDNA non‐coding RNAs (C), D‐Loop and protein coding‐genes (D) (n = 5–6). E) Number of mutation sites in D‐loop region (n = 5–6). F, G) The percentage of mtDNA heteroplasmy (F), and number of mutation sites (G) in mature oocytes (n = 5–6). Data are presented as mean ± s.e.m. *P < 0.05, **P < 0.01; unpaired two‐tail Student's t test was used in analyses.
Figure 3
Figure 3
ATF5‐POLG protein axis dysregulates mtDNA heteroplasmy in mature oocytes. A) Immunoblotting of ATF5 in mature oocytes of control (CON) and obese (OB) females. GAPDH was used as a loading control (n = 6). B) Immunoblotting of ATF5 and LonP1 proteins in cytosol and mitochondria of mature oocytes. VDAC was used as mitochondrial loading control, and β‐tubulin was used as a cytosol loading control (n = 6). C) Co‐immunoprecipitation of ATF5 in measuring POLG in mature oocytes. ATF5 and POLG were immunoprecipitated followed with SDS‐PAGE separation and measured by immunoblotting. IgG was used as a negative control in immunoprecipitation (n = 6). D) The percentage of mtDNA heteroplasmy and total mutation sites in POLG‐immunoprecipitants (n = 5–6). E, F) Circular plot of the mitochondrial genome shows the genome annotation on the outer circle. The six green inner circles and six red outside cycles show the genomic locations and the relative frequencies of mtDNA mutations from POLG immunoprecipitants in mature oocytes of CON (green, inner cycle) and OB females (red, outside cycle) (E). Relative fold changes of mtDNA heteroplasmy between CON and OB mature oocytes were mapped (F). The heteroplasmic change was OB compared with controls. Regions corresponding to the different mtDNA genes (green, protein coding genes; pink, rRNA; red, tRNA; blue, non‐coding regions) (n = 5–6). G) Total mutation sites in D‐loop and protein coding genes of mtDNA from POLG immunoprecipitate in mature oocytes (n = 5–6). Data are presented as mean ± s.e.m. *P < 0.05, **P < 0.01, ***P < 0.001, and ****P < 0.0001; unpaired two‐tail Student's t test was used in analyses.
Figure 4
Figure 4
ATF5 activation impairs oocyte maturation and increases mtDNA heteroplasmy. A) 3‐month old mice were administrated AAV9‐MCS‐CMV (CON) or AAV9‐Atf5‐CMV (ATF5‐OE) viral particles. After 3‐weeks transfection, ATF5 was overexpressed in mature oocytes of ATF5‐OE mice. B) Ovary H&E staining in CON and ATF5‐OE mice. Scale bar 200 µm, 50 µm (n = 5). The primary, second and mature oocytes were quantified per ovary section. C) Mature oocytes were collected in the fallopian tubes. Stars indicate the abnormal oocytes, and scale bar 50 µm. D, E) Immunocytochemical staining of mitochondria (MitoSpy; green color) and mitochondrial membrane potential (TMRE, red color) in mature oocytes isolated in CON and ATF5‐OE females. Intensity was quantified by Image J, and normalized by MitoSpy/TMRE. Scar bar MitoSpy, 200 µm; bright field, 150 µm; TMRE, 80 µm. Six mature oocytes were used in the analyses. F) mtDNA content in mature oocytes (n = 5). G) The percentage of mtDNA heteroplasmy, and number of mutation sites from POLG‐immunoprecipitate in mature oocytes (n = 5). H, I) Circular plot of the mitochondrial genome shows the genome annotation on the outer circle. Green inner circles and red outside cycles show the genomic locations and the relative frequencies of mtDNA mutations from POLG‐immunoprecipitants of mature oocytes from CON and ATF5‐OE females (n = 5) (H). Relative fold changes of mtDNA heteroplasmy from POLG‐immunoprecipitants between CON and ATF5‐OE mature oocytes were mapped (I). The heteroplasmic change was ATF5‐OE compared with controls. Regions corresponding to the different mtDNA genes (green, protein coding genes; pink, rRNA; red, tRNA; blue, non‐coding regions) (n = 5). J) Number of mtDNA mutation sites in mtDNA D‐Loop and protein coding‐genes in mtDNA from POLG‐immunoprecipitants (n = 5). Data are presented as mean ± s.e.m. *P < 0.05, **P < 0.01, ***P < 0.001, and ****P < 0.0001; unpaired two‐tail Student's t test was used in analyses.
Figure 5
Figure 5
AMPK inactivation impairs oocyte maturation and ATF5‐POLG‐mtSNVs axis. A) Immunoblotting of LonP1, AMPKa and phosphorylated AMPKa at Thr172 in mature oocytes of control and obese females. GAPDH was used as a loading control (n = 5). B) The ADP/ATP ratio in mature oocytes (n = 8). C) The primary, secondary and mature follicles per section of ovaries (n = 8). D, E) The total number (D) and abnormal MII oocytes (E) were collected in the fallopian tube in wild type (WT) and Prkaa1‐knockout (AMPKa1‐KO) mice (n = 18). Star indicates mature oocytes with abnormal morphology. F) Immunostaining of MitoSpy (green color) and TMRE (red color) in mature oocytes, and fluorescent intensity was qualified by ImageJ and normalized by MitoSpy/TMRE. G) Oxygen consumption was measured in WT and AMPKa1‐KO oocytes. H) Immunoblotting of LonP1, ATF5 and POLG proteins in mature oocytes. GAPDH was used as a loading control (n = 5). I) Co‐immunoprecipitation of ATF5 in measuring POLG in mature oocytes. ATF5 and POLG were immunoprecipitated followed with SDS‐PAGE separation and measured by immunoblotting. IgG was used as a negative control in immunoprecipitation (n = 5). J) The mtDNA heteroplasmy and total mutation sites derived from POLG immunoprecipitants in mature oocytes (n = 6). K) Circular plot of the mitochondrial genome shows the genome annotation on the outer circle. The six green inner circles and six red outside cycles show the genomic locations and the relative frequencies of mtDNA mutations in POLG immunoprecipitants of mature oocytes of WT (green inner cycle) and AMPK‐KO mice (red outside cycle). L) Relative fold changes of mtDNA heteroplasmy in mature oocytes of WT and AMPK‐KO mice. The heteroplasmic change was AMPK‐KO compared with WT. Regions corresponding to the different mtDNA genes (green, protein coding genes; pink, rRNA; red, tRNA; blue, non‐coding regions) (n = 6). M) Number of mutation sites in mtDNA D‐loop and protein coding genes in mature oocytes (n = 6). Data are presented as mean ± s.e.m. *P < 0.05, **P < 0.01, ***P < 0.001, and ****P < 0.0001; unpaired two‐tail Student's t test and two‐way ANOVA with Bonferroni post hoc were used in analyses.
Figure 6
Figure 6
AMPK mediates the dysregulation in LonP1‐ATF5‐POLG axis and oocyte maturation due to obesity. A) Oocytes were isolated in control (CON) and obese females (OB), and treated AMPKa agonists A‐769662 in vitro. Immunoblotting of AMPKa, AMPKa phosphorylation at Thr‐172, LonP1, ATF5 and POLG proteins in mature oocytes. GAPDH was used as loading controls (n = 4). B) ADP/ATP ratio in mature oocytes (n = 4). C) Co‐immunoprecipitation of ATF5 in measuring POLG in mature oocytes. ATF5 and POLG were immunoprecipitated followed with SDS‐PAGE separation and measured in immunoblotting. IgG was used as a negative control in immunoprecipitation (n = 4). D, E) Oxygen consumption was measured in mature oocytes supplemented with A‐769662. F) Immunoblotting of GDF9, BMP15, active‐caspase3 and active‐caspase7 proteins in mature oocytes. β‐tubulin was used as a loading control (n = 4). Data are presented as mean ± s.e.m. *P < 0.05, **P < 0.01, ***P < 0.001, and ****P < 0.0001; Two‐way ANOVA with Bonferroni post hoc was used in data analysis; obesity and AMPKa activator were as main factors in the analysis.
Figure 7
Figure 7
AMPK activation improves oocyte maturation and limits mtDNA heteroplasmy in obese females. A) Obese females were fed metformin in drinking water for 4‐weeks (OB+Metf). Immunoblotting of AMPKa, AMPKa phosphorylation at Thr‐172, BMP15, GDF‐9, ATF5, POLG and LonP1 proteins in mature oocytes of control (CON), obese (OB) and OB+Metf females. The β‐tubulin was used as a loading control (n = 5). B) H&E staining in ovary. The primary, secondary and mature oocytes were quantified in each ovary section (n = 5). C) Immunostaining of MitoSpy (green color) and TMRE (red color) in mature oocytes. Fluorescent intensity was qualified by ImageJ and normalized by MitoSpy/TMRE. Five mature oocytes were used in the analyses. Scar bar MitoSpy, 200 µm; bright field, 150 µm; TMRE, 80 µm. D) Number of pups per litter born from female mice. E) Co‐immunoprecipitation of ATF5 in measuring POLG in mature oocytes. ATF5 and POLG were immunoprecipitated followed with SDS‐PAGE separation and measured in immunoblotting. IgG was used as a negative control in immunoprecipitation. F) Percentage of mtDNA heteroplasmy and total mutation sites in mature oocytes from mtDNA‐sequencing (n = 5). Data are presented as mean ± s.e.m. *P < 0.05, **P < 0.01, ***P < 0.001, and ****P < 0.0001; one‐way ANOVA was used in analysis.
Figure 8
Figure 8
Diagram summaries that obesity induces AMPK inactivation, lower mtDNA quantity and quality in mature oocytes, attributing to impaired mitochondrial energetics and female fertility. AMPK inactivation increases binding affinity of ATF5‐POLG protein complex to D‐loop and protein‐coding regions of mutated mtDNA, leading to replication of heteroplasmic mtDNA, impaired mitochondrial biogenesis and oocyte quality. AMPK activation blocks the detrimental impacts of OB by preventing ATF5‐POLG protein recruitment, benefiting oocyte maturation and fertility.

Similar articles

Cited by

References

    1. Blüher M., Nat. Rev. Endocrinol. 2019, 15, 288. - PubMed
    1. Heslehurst N., Rankin J., Wilkinson J., Summerbell C., Int. J. Obes. 2010, 34, 420. - PubMed
    1. a) Creanga A., Catalano P., Bateman B., N. Engl. J. Med. 2022, 387, 248; - PubMed
    2. b) Han L., Ren C., Li L., Li X., Ge J., Wang H., Miao Y., Guo X., Moley K., Shu W., Wang Q., Nat. Genet. 2018, 50, 432; - PubMed
    3. c) Purcell S., Moley K., J. Assist. Reprod. Genet. 2011, 28, 517. - PMC - PubMed
    1. Aydogan Mathyk B., Quaas A., J. Assist. Reprod. Genet. 2021, 38, 343. - PMC - PubMed
    1. a) Godfrey K., Reynolds R., Prescott S., Nyirenda M., Jaddoe V., Eriksson J., Broekman B., Lancet Diabetes Endocrinol. 2017, 5, 53; - PMC - PubMed
    2. b) Lippert R., Brüning J., Biol. Psychiatry 2022, 91, 898. - PubMed

Substances