. 2024 Mar 19;24(1):199.
doi: 10.1186/s12870-024-04898-9.

Whole genome identification, molecular docking and expression analysis of enzymes involved in the selenomethionine cycle in Cardamine hupingshanensis

Affiliations

Whole genome identification, molecular docking and expression analysis of enzymes involved in the selenomethionine cycle in Cardamine hupingshanensis

Xixi Zeng et al. BMC Plant Biol. .

Abstract

Background: The selenomethionine cycle (SeMTC) is a crucial pathway for the metabolism of selenium. The basic bioinformatics and functions of four enzymes involved in the cycle including S-adenosyl-methionine synthase (MAT), SAM-dependent methyltransferase (MTase), S-adenosyl-homocysteine hydrolase (SAHH) and methionine synthase (MTR), have been extensively reported in many eukaryotes. The identification and functional analyses of SeMTC genes/proteins in Cardamine hupingshanensis and their response to selenium stress have not yet been reported.

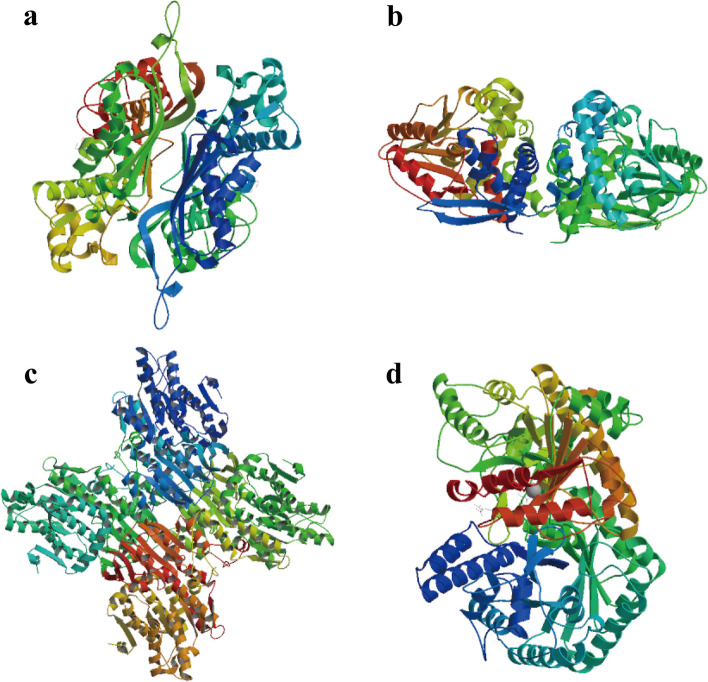
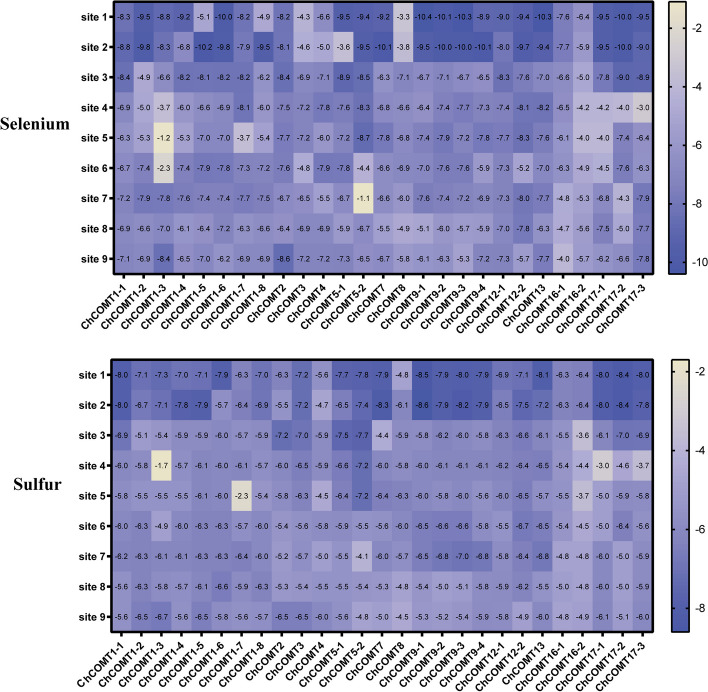
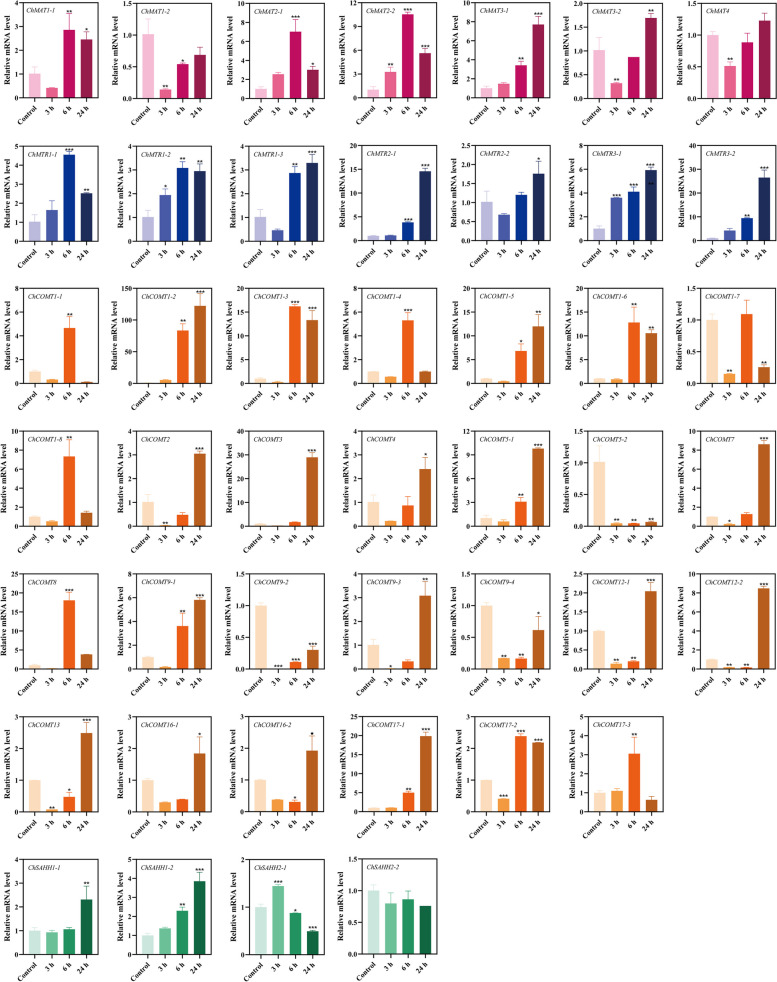
Results: In this study, 45 genes involved in SeMTC were identified in the C. hupingshanensis genome. Phylogenetic analysis showed that seven genes from ChMAT were clustered into four branches, twenty-seven genes from ChCOMT were clustered into two branches, four genes from ChSAHH were clustered into two branches, and seven genes from ChMTR were clustered into three branches. These genes were resided on 16 chromosomes. Gene structure and homologous protein modeling analysis illustrated that proteins in the same family are relatively conserved and have similar functions. Molecular docking showed that the affinity of SeMTC enzymes for selenium metabolites was higher than that for sulfur metabolites. The key active site residues identified for ChMAT were Ala269 and Lys273, while Leu221/231 and Gly207/249 were determined as the crucial residues for ChCOMT. For ChSAHH, the essential active site residues were found to be Asn87, Asp139 and Thr206/207/208/325. Ile204, Ser111/329/377, Asp70/206/254, and His329/332/380 were identified as the critical active site residues for ChMTR. In addition, the results of the expression levels of four enzymes under selenium stress revealed that ChMAT3-1 genes were upregulated approximately 18-fold, ChCOMT9-1 was upregulated approximately 38.7-fold, ChSAHH1-2 was upregulated approximately 11.6-fold, and ChMTR3-2 genes were upregulated approximately 28-fold. These verified that SeMTC enzymes were involved in response to selenium stress to varying degrees.

Conclusions: The results of this research are instrumental for further functional investigation of SeMTC in C. hupingshanensis. This also lays a solid foundation for deeper investigations into the physiological and biochemical mechanisms underlying selenium metabolism in plants.

Keywords: Cardamine Hupingshanensis; Gene expression; Molecular docking; Selenium stress response; Selenomethionine cycle.


Conflict of interest statement

The authors declare no competing interests.

Figures

Fig. 1
Fig. 1
Schematic diagram of selenium metabolism and the cycle of selenomethionine in plants [17]. ATPs: ATP sulfurylase; APSe: adenosine 5’-phosphoselenate; APK: adenosine 5’-phosphosulfate kinase; PAPSe: phospho adenosine phosphor-selenate; SOT: sulfotransferase; APR: adenosine 5’-phosphosulfate reductase; SiR: sulfite reductase; OASTL: O-acetylserine (thiol) lyase; SeCys: selenocysteine; SMT: selenocysteine methyltransferase; SeMSeCys: selenomethylselenocysteine; DMDSe: dimethyl diselenide; SL: SeCyslyase; CγS: cystathionine gamma synthase; SeCysth: selenocystathionine; CβL: cystathionine beta lyase; SeHcys: selenium homocysteine; MMT: methionine methyl transferase; methl-SeMet: selenium methyl selenomethionine; DMSeP: dimethylselenonium propionate; DMSP: dimethylsulfoniopropionate lyase; DMSe: dimethyl selenide
Fig. 2
Fig. 2
Chromosomal distribution of SeMTC genes in C. hupingshanensis. The chromosome numbers are shown on the left side of each strip
Fig. 3
Fig. 3
Phylogenetic tree of SeMTC genes. The phylogenetic tree from Brassica napus (Bn), Brassica oleracea (Bo), Brassica rapa (Br), Camelina sativa (Cs), Glycine max (Gm), Musa nana (Mn), Oryza sativa (Os), Triticum aestivum (Ta), Zea mays (Zm), Arabidopsis thaliana (At) and C. hupingshanensis (Ch). a The phylogenetic tree of MTR. b The phylogenetic tree of MAT. c The phylogenetic tree of COMT. d The phylogenetic tree of SAHH.
Fig. 4
Fig. 4
Phylogenetic trees, motif, domain, and gene structure of the SeMTC genes. a The phylogenetic tree; b,c Conserved motifs and domains of the proteins, different colors represent different motifs or domains. d Exon-intron structures; exons are indicated by yellow boxes, and introns are indicated by lines
Fig. 5
Fig. 5
Predicted 3D structures of proteins by the SWISS-MODEL server. a ChMAT1-1. b ChCOMT1-1. c ChSAHH1-1. d ChMTR1-1.
Fig. 6
Fig. 6
Visualization of some of the predicted ligand-binding sites for protein by PrankWeb. a ChMAT1-1. b ChCOMT1-1. c molChSAHH1-1. d ChMTR1-1.
Fig. 7
Fig. 7
Binding energies of ChMAT and SeMet/Met, ChSAHH and SeAH/SAH, ChMTR and SeHcys/Hcys. The bottom of the heat map represents different genes, and the vertical coordinates represent the ligand binding sites. The value represents the binding energy shown by the ligand-protein docking, unit: kcal·mol−1
Fig. 8
Fig. 8
Binding energies of ChCOMT and SeAM/SAM. The bottom of the heat map represents different genes, and the vertical coordinates represent the ligand binding sites. The value represents the binding energy shown by the ligand-protein docking, unit: kcal·mol−1
Fig. 9
Fig. 9
Interactions of the SeMTC enzymes and ligands. The left panel is the overall view, and the right panel is the focused view. The SeMTC enzymes are shown on the surface, the amino acid residues at the binding site are gray-blue, and the ligands are heavily yellow. The gray dotted line represents hydrophobic interactions, the solid blue line represents the hydrogen bond, the dashed yellow line represents the salt bridge, and the red dashed line represents a π-cation interaction. ChMAT4: Interactions of the binary ChMAT-ATP complex with SeMet. ChCOMT9-1: Interactions of the binary ChCOMT with SeAM. ChSAHH1-2: Interactions of the binary ChSAHH with SeAH. ChMTR3-2: Interactions of the binary ChMTR-5-methyltetrahydrofolate complex with SeHcys. CS: putative binding mode of SeMTC enzymes and ligands to model the protein structure at the catalytic site. MBS: SeMTC enzymes and ligands are in a putative binding mode that mimics the protein structure at the site of minimum binding energy, the site of maximum affinity binding
Fig. 10
Fig. 10
Expression of ChSeMTC genes in leaves under low-concentration selenium stress (100 µg Se L−1). Red, blue, brown, and green represent ChMAT, ChMTR, ChCOMT, and ChSAHH, respectively. Each data point represents the mean ± standard deviation (SD) (n = 3). Error bars represent the standard deviation
Fig. 11
Fig. 11
Expression of ChSeMTC genes in roots under low-concentration selenium stress (100 µg Se L−1). Red, blue, brown, and green represent ChMAT, ChMTR, ChCOMT, and ChSAHH, respectively. Each data point represents the mean ± standard deviation (SD) (n = 3). Error bars represent the standard deviation
Fig. 12
Fig. 12
Expression of ChSeMTC genes in leaves under high-concentration selenium stress (80,000 µg Se L−1). Red, blue, brown, and green represent ChMAT, ChMTR, ChCOMT, and ChSAHH, respectively. Each data point represents the mean ± standard deviation (SD) (n = 3). Error bars represent the standard deviation
Fig. 13
Fig. 13
Expression of ChSeMTC genes in roots under high-concentration selenium stress (80,000 µg Se L−1). Red, blue, brown, and green represent ChMAT, ChMTR, ChCOMT, and ChSAHH, respectively. Each data point represents the mean ± standard deviation (SD) (n = 3). Error bars represent the standard deviation

References

    1. El Mehdawi AF, Pilon-Smits EA. Ecological aspects of plant selenium hyperaccumulation. Plant Biol. 2012;14(1):1–10. doi: 10.1111/j.1438-8677.2011.00535.x. - DOI - PubMed
    1. White PJ. Selenium metabolism in plants. Biochim Biophys Acta. 2018;1862(11):2333–2342. doi: 10.1016/j.bbagen.2018.05.006. - DOI - PubMed
    1. Schiavon M, Pilon-Smits EA. The fascinating facets of plant selenium accumulation–biochemistry, physiology, evolution and ecology. New Phytol. 2017;213(4):1582–1596. doi: 10.1111/nph.14378. - DOI - PubMed
    1. White PJ, Bowen HC, Marshall B, Broadley MR. Extraordinarily high leaf selenium to sulfur ratios define ‘Se-accumulator’plants. Ann Botany. 2007;100(1):111–118. doi: 10.1093/aob/mcm084. - DOI - PMC - PubMed
    1. O’Donohue B, Hiti-Bandaralage J, Gleeson M, O’Brien C, Harvey M-A, van der Ent A, Pinto Irish K, Mitter N, Hayward A. Tissue culture tools for selenium hyperaccumulator Neptunia Amplexicaulis for development in phytoextraction. Nat Prod Bioprospecting. 2022;12(1):28. doi: 10.1007/s13659-022-00351-2. - DOI - PMC - PubMed

LinkOut - more resources