. 2024 Mar 19;24(1):201.
doi: 10.1186/s12870-024-04897-w.

Identification and expression analyses of B3 genes reveal lineage-specific evolution and potential roles of REM genes in pepper

Affiliations

Identification and expression analyses of B3 genes reveal lineage-specific evolution and potential roles of REM genes in pepper

Young-Soo Park et al. BMC Plant Biol. .

Abstract

Background: The B3 gene family, one of the largest plant-specific transcription factors, plays important roles in plant growth, seed development, and hormones. However, the B3 gene family, especially the REM subfamily, has not been systematically and functionally studied.

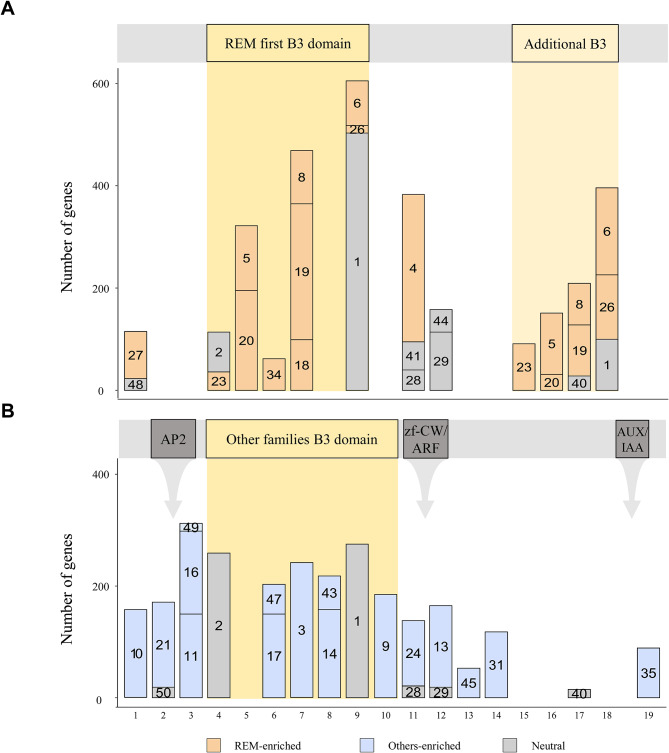
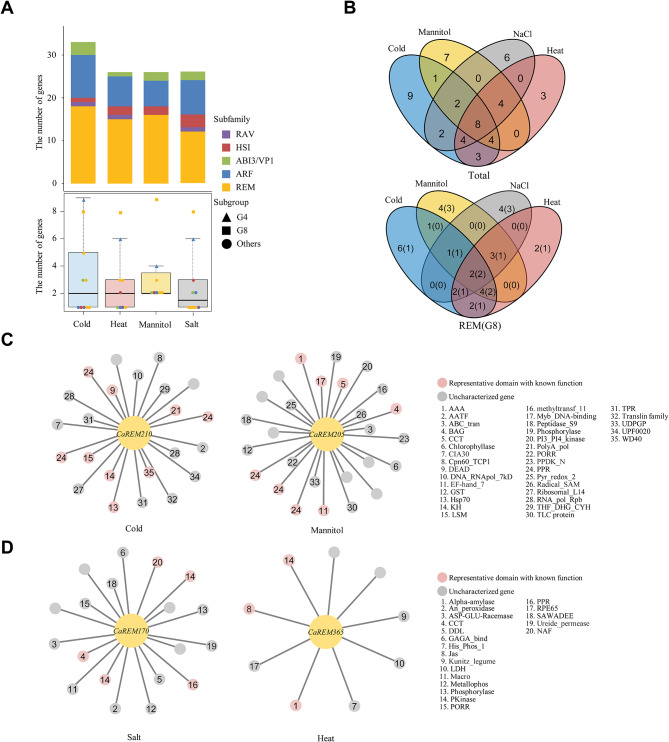
Results: In this study, we performed genome-wide re-annotation of B3 genes in five Solanaceae plants, Arabidopsis thaliana, and Oryza sativa, and finally predicted 1,039 B3 genes, including 231 (22.2%) newly annotated genes. We found a striking abundance of REM genes in pepper species (Capsicum annuum, Capsicum baccatum, and Capsicum chinense). Comparative motif analysis revealed that REM and other subfamilies (ABI3/VP1, ARF, RAV, and HSI) consist of different amino acids. We verified that the large number of REM genes in pepper were included in the specific subgroup (G8) through the phylogenetic analysis. Chromosome location and evolutionary analyses suggested that the G8 subgroup genes evolved mainly via a pepper-specific recent tandem duplication on chromosomes 1 and 3 after speciation between pepper and other Solanaceae. RNA-seq analyses suggested the potential functions of REM genes under salt, heat, cold, and mannitol stress conditions in pepper (C. annuum).

Conclusions: Our study provides evolutionary and functional insights into the REM gene family in pepper.

Keywords: Abiotic stress; B3; Pepper; REM; Re-annotation; Solanaceae; Transcription factors.


Conflict of interest statement

The authors declare no competing interests.

Figures

Fig. 1
Fig. 1
Genomic features of the B3 genes in seven plant genomes. (A) The number of B3 subfamilies and their domain architectures in seven plant genomes. Different symbols located on the left represent the corresponding domains. The color of the bars indicates subfamilies. The dots next to B3-REM express one or more of the B3 domains. (B) The ratio and number of subfamilies per species. The bar colors present each subfamily. (C) Multiple sequence alignments and secondary structures of B3 domain sequences in seven plant genomes. The secondary structure positions are shown above the amino acid logo. The height of the logos within the stack shows the relative frequency at each position. In the sequence alignment, it is capitalized if more than half of the genes have a particular amino acid at that position, otherwise, it is lowercase. Gaps are marked with dashes. The calculated sequence conservation is presented as a bar diagram. (D) Enriched motifs in the B3 domain of REM and other subfamilies. The numbers in brackets manifest the motif sequences shown in Table S4. The size of the numbers shows the frequency of motifs from genes. Colors display the result of the enrichment test for REM and other families (p < 0.0001). (E) The Gene Ontology (GO) term for updated B3 genes. The GO categories are listed below the heatmap
Fig. 2
Fig. 2
Motif compositions of B3 genes in seven species. (A) The motif compositions of the REM genes. If one or more B3 domains are present, only the first B3 is depicted in the REM first B3 domain box, and the remaining B3 domains are illustrated in the additional B3 box. (B) The motif compositions of the non-REM genes. The integrated domains are shown in the gray box. (A-B) The number in the bar indicates the motif sequence in Table S4. The result of the enrichment test is displayed as REM-enriched, Others-enriched, or neutral in different colored boxes (p < 0.0001)
Fig. 3
Fig. 3
Lineage-specific copy number expansion of REM genes in pepper. (A) The phylogenetic relationship of the B3 genes among seven species. The outer and middle rings represent subfamilies and subgroups, respectively. Colored dots at the end of the branch indicate species. (B) The most abundant motifs near the B3 domain are shown. Motifs are portrayed as numbers in the box. The boxes are colored to show the type of enriched result of the motifs (p < 0.0001). (C) The number of subgroups indicated by species on the heatmap. (D) Microsynteny relationship of G8 genes in pepper (C. annuum), potato, and tomato. The line implies an orthologous relationship between genes. Black and gray blocks mark the chromosome locations of orthologous and non-orthologous B3 genes. White blocks mean orthologous genes of non-B3 genes. (E) Duplication history of G8 genes in pepper, potato, and tomato. The Ks values of duplication pairs of genes are shown in a dot plot. The Ka/Ks ratio is displayed as a bar graph
Fig. 4
Fig. 4
Expression analyses of pepper B3 genes under abiotic stress. (A) Expression patterns of whole DEGs with B3 genes. (B) The number of B3 genes in expression clusters. The heatmap represents the number of B3 genes by subgroup. (C) Abundant GO descriptions of genes in representative clusters. Dot plots display the top three GO enrichment results for each cluster under abiotic stress. The shape and size of symbols indicate the cluster number and frequency of GO descriptions, respectively, depicted on the right side of the dot plots
Fig. 5
Fig. 5
Co-expression network analysis of REM genes in pepper under abiotic stress. (A) The number of B3 DEGs under each abiotic stress. Colors and shapes next to the diagram symbolize the subfamilies and subgroups. (B) DEGs of the B3, REM, and G8 genes. (C) The networks illustrate associations with G8 genes and other genes under cold and mannitol conditions. (D) Co-expression network of stress response-related REM genes under salt and heat (C-D). The number written in the circle provides domain information, which is located on the right side of the network. The empty circle represents an uncharacterized gene

References

    1. Swaminathan K, Peterson K, Jack T. The plant B3 superfamily. Trends Plant Sci. 2008;13(12):647–55. doi: 10.1016/j.tplants.2008.09.006. - DOI - PubMed
    1. McCarty DR, Hattori T, Carson CB, Vasil V, Lazar M, Vasil IK. The Viviparous-1 developmental gene of maize encodes a novel transcriptional activator. Cell. 1991;66(5):895–905. doi: 10.1016/0092-8674(91)90436-3. - DOI - PubMed
    1. Suzuki M, Kao CY, McCarty DR. The conserved B3 domain of VIVIPAROUS1 has a cooperative DNA binding activity. Plant Cell. 1997;9(5):799–807. - PMC - PubMed
    1. Ulmasov T, Murfett J, Hagen G, Guilfoyle TJ. Aux/IAA proteins repress expression of reporter genes containing natural and highly active synthetic auxin response elements. Plant Cell. 1997;9(11):1963–71. - PMC - PubMed
    1. Kagaya Y, Ohmiya K, Hattori T. RAV1, a novel DNA-binding protein, binds to bipartite recognition sequence through two distinct DNA-binding domains uniquely found in higher plants. Nucleic Acids Res. 1999;27(2):470–8. doi: 10.1093/nar/27.2.470. - DOI - PMC - PubMed

LinkOut - more resources