. 2024:1:20240025.
doi: 10.59368/agingbio.20240025. Epub 2024 Feb 20.

Early-Onset Hearing Loss in Mouse Models of Alzheimer's Disease and Increased DNA Damage in the Cochlea

Affiliations

Early-Onset Hearing Loss in Mouse Models of Alzheimer's Disease and Increased DNA Damage in the Cochlea

Jae-Hyeon Park et al. Aging Biol. 2024.

Abstract

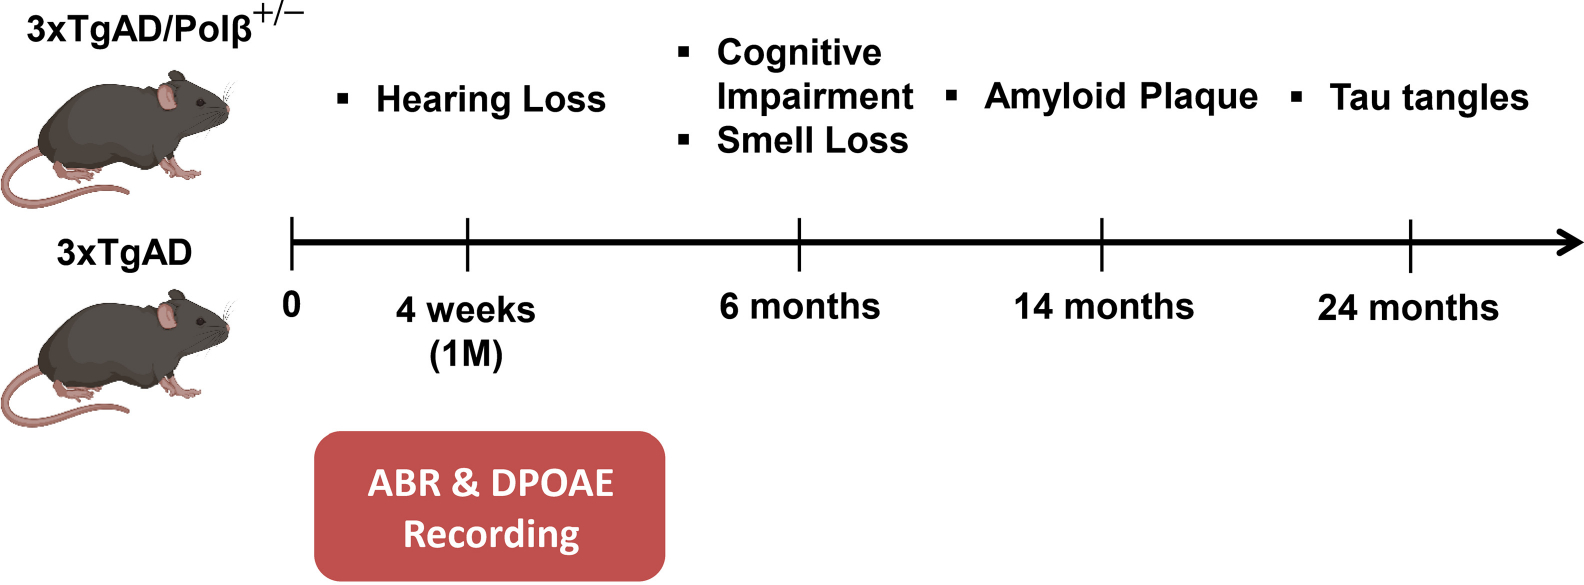
There is considerable interest in whether sensory deficiency is associated with the development of Alzheimer's disease (AD). Notably, the relationship between hearing impairment and AD is of high relevance but still poorly understood. In this study, we found early-onset hearing loss in two AD mouse models, 3xTgAD and 3xTgAD/Polβ+/-. The 3xTgAD/Polβ+/- mouse is DNA repair deficient and has more humanized AD features than the 3xTgAD. Both AD mouse models showed increased auditory brainstem response (ABR) thresholds between 16 and 32 kHz at 4 weeks of age, much earlier than any AD cognitive and behavioral changes. The ABR thresholds were significantly higher in 3xTgAD/Polβ+/- mice than in 3xTgAD mice at 16 kHz, and distortion product otoacoustic emission signals were reduced, indicating that DNA damage may be a factor underlying early hearing impairment in AD. Poly ADP-ribosylation and protein expression levels of DNA damage markers increased significantly in the cochlea of the AD mice but not in the adjacent auditory cortex. Phosphoglycerate mutase 2 levels and the number of synaptic ribbons in the presynaptic zones of inner hair cells were decreased in the cochlea of the AD mice. Furthermore, the activity of sirtuin 3 was downregulated in the cochlea of these mice, indicative of impaired mitochondrial function. Taken together, these findings provide new insights into potential mechanisms for hearing dysfunction in AD and suggest that DNA damage in the cochlea might contribute to the development of early hearing loss in AD.


Conflict of interest statement

Conflict of Interest Statement V.A.B. had a material CRADA agreement with ChromaDex, Inc.

Figures

Figure 1.
Figure 1.. Hearing loss in 3xTgAD and 3xTgAD/Polβ+/− mice.
(A) Experiment scheme for auditory brainstem response (ABR) recordings at 4 weeks of age in the 4, 8, 16, 24, and 32 kHz. WT, Polβ+/−, 3xTgAD, and 3xTgAD/Polβ+/− mice were used. (B) ABR threshold in male mice. (C) ABR threshold in female mice. Significant elevation of ABR thresholds was observed at 4 weeks of age in 3xTgAD and 3xTgAD/Polβ+/− mice. In male, ABR thresholds between 3xTgAD and 3xTgAD/Polβ+/− mice were significantly different at 16 kHz. (D,E) Quantification of the amplitude of wave I in each group at 16 kHz and 90 dB. (F,G) Quantification of the latency of wave I in each group at 16 kHz and 90 dB. The dots represent individual mice. (H) Distortion product otoacoustic emission (DPOAE) recordings in male mice and (I) DPOAE recordings in female mice. A significant reduction of DPOAE signals at 16 kHz was observed at 4 weeks of age in 3xTgAD and 3xTgAD/Polβ+/− male mice but not in female mice. n = 7–11 mice per group. *p < 0.05, **p < 0.01, 3xTg and 3xTgAD/Polβ+/− mice compared to WT mice. #p < 0.05, 3xTgAD/Polβ+/− mice compared to 3xTg mice. Two-way ANOVA with Tukey’s multiple comparisons test. Error bars represent the mean ± standard deviation (SD).
Figure 2.
Figure 2.. DNA damage in the cochlea induces defects in functional synapses in 3xTgAD/Polβ+/− mice.
(A–C) Representative image of immunostaining for synaptic ribbons in the apex (8 kHz), middle (16 kHz), and base (32 kHz) regions of the cochlea in WT and 3xTgAD/Polβ+/− mice at 4 weeks of age. A magnification of 100× was used for all images. (D) Quantitative analysis of paired puncta per inner hair cell (IHC) in the cochlea at 8, 16, and 32 kHz. The average number of paired puncta is reduced in 3xTgAD/Polβ+/− mice relative to WT mice. (E,F) The graphs show the average number of orphan ribbons per IHC at 8, 16, and 32 kHz. The green puncta (anti-Ctbp2) and the magenta puncta (anti-Homer1). Each puncta represents a single synaptic ribbon in an individual mouse. (G) Representative images of base inner and outer hair cells of WT and 3xTgAD/Polβ+/− mice at 4 weeks of age. A magnification of 20× was used for the hair cell image. (H,I) The average number of inner and outer hair cells per 150 μm in the basal region of the cochlea in WT or 3xTgAD/Polβ+/− mice. The number of IHCs decreased in 3xTgAD/Polβ+/− mice. In contrast, there were no significant changes in the number of outer hair cells. n = 5 male mice per group. *p < 0.05, **p < 0.01, two-way ANOVA with Tukey’s multiple comparisons test. Error bars represent the mean ± SD.
Figure 3.
Figure 3.. DNA damage is accumulated in the cochlea.
(A) Schematic drawing of the mouse cochlea and auditory cortical regions for recording. (B) Heatmap of pathways from NanoString analysis in the cochlea and auditory cortex. Significant pathways with a fold change of ≥1.5 from each comparison relative to WT. The heatmap shows significantly downregulated DNA damage repair pathways in the cochlea. (C,D) Representative western blots showing PAR, PARP1, and γH2AX in the cochlea and auditory cortex. (E–J) Quantification of PAR, PARP1, and γH2AX protein levels in the cochlea and auditory cortex. The γH2AX band was normalized to loading controls β-actin. AC denotes the auditory cortex. (K) Relative NAD+ levels were measured in the cochlea and auditory cortex of WT, Polβ+/−, 3xTgAD, and 3xTgAD/Polβ+/− mice at 4 weeks of age. n = 3 male mice per group. Note: The ratio of NAD+/NADH in WT mice was lower in the auditory cortex compared with the cochlea. NAD+/NADH levels were normalized to total protein. *p < 0.05, **p < 0.01, two-way ANOVA with Tukey’s multiple comparisons test. Error bars represent the mean ± SD.
Figure 4.
Figure 4.. Increased DNA damage may affect the hearing adversely.
(A) Outline for irradiation (IR) treatment and ABR recordings at 4 weeks of age in WT and 3xTgAD/Polβ+/− mice. (B) ABR threshold in male mice. (C) ABR threshold in female mice. n = 3–4 mice per group. (D,F) Representative western blots showing γH2AX in the cochlea and auditory cortex of WT and 3xTgAD/Polβ+/− male mice. (E,G) Quantification of γH2AX protein levels in the cochlea and auditory cortex. n = 3 mice per group. The γH2AX band was normalized to loading controls β-actin. #p < 0.05, IR-treated 3xTgAD/Polβ+/− mice compared to 3xTgAD/Polβ+/− mice. Two-way ANOVA with Tukey’s multiple comparisons test. Error bars represent the mean ± SD. Note: §p is the p value obtained with the student’s t-test as the two-way ANOVA analysis did not quite reach significance of p < 0.05.
Figure 5.
Figure 5.. Phosphoglycerate mutase 2 (Pgam2) is downregulated in the cochlea of 3xTgAD and 3xTgAD/Polβ+/− mice.
(A) Heatmap of gene expression from NanoString analysis in the cochlea and auditory cortex. (B,C) Representative western blots show Pgam2 and Tbx2 in the cochlea and auditory cortex. (D,H) Quantification of Pgam2 protein levels in the cochlea and auditory cortex. (E,I) Quantitative real-time PCR (qPCR) analysis for the relative gene expression of Pgam2 in the cochlea and auditory cortex. (F,J) Quantitative measurement of Pgam2 levels in the cochlea and auditory cortex. (G,K) Quantification of Tbx2 protein levels in the cochlea and auditory cortex. Pgam2 and Tbx2 bands were normalized to loading controls β-actin. n = 3 male mice per group. *p < 0.05, **p < 0.01, two-way ANOVA with Tukey’s multiple comparisons test. Error bars represent the mean ± SD.
Figure 6.
Figure 6.. Increased DNA damage decreases sirtuin 3 (SIRT3) levels in the cochlea of 3xTgAD and 3xTgAD/Polβ+/− mice.
(A,G) Representative western blots show SIRT3, SOD2, and Ac-SOD2 (acetyl K68) in the cochlea and auditory cortex. (B,C,H,I) Quantification of SIRT3 and Ac-SOD2 (acetyl K68) protein levels in the cochlea and auditory cortex. (D–F,J–L) qPCR analysis for the relative gene expression of SIRT3, BAX, and Caspase-3 in the cochlea and auditory cortex. n = 3 male mice per group. The Ac-SOD2 band was normalized to total SOD2. The other bands were normalized to loading controls β-actin. *p < 0.05, **p < 0.01, two-way ANOVA with Tukey’s multiple comparisons test. Error bars represent the mean ± SD. Note: §p is the p value obtained with the student’s t-test.
Figure 7.
Figure 7.. Schematic drawing of the time sequence of occurrence of hearing loss and typical Alzheimer’s disease (AD) phenotypes in 3xTgAD and 3xTgAD/Polβ+/− mice.
Hearing analyses (ABR and DPOAE) in the 3xTgAD and 3xTgAD/Polβ+/− mice were performed and significant elevation of ABR thresholds and reduction of DPOAE signal were observed at 4 weeks of age. Hearing impairment was much earlier than the occurrence of the AD phenotype, which appeared from 4 months of age. Cognitive impairment and smell loss (6 months). Amyloid plaque (14 months). Tau tangles (24 months).

Similar articles

Cited by

References

    1. Bloom GS (2014). Amyloid-β and tau: The trigger and bullet in Alzheimer disease pathogenesis. JAMA Neurol. 71(4), 505–508; doi: 10.1001/jamaneurol.2013.5847. - DOI - PubMed
    1. Spillantini MG, & Goedert M (2013). Tau pathology and neurodegeneration. Lancet Neurol. 12(6), 609–622.; doi: 10.1016/S1474-4422(13)70090-5. - DOI - PubMed
    1. Hammond TC, Xing X, Wang C, Ma D, Nho K, Crane PK, … Lin A-L (2020). β-amyloid and tau drive early Alzheimer’s disease decline while glucose hypometabolism drives late decline. Commun. Biol. 3(1), 352.; doi: 10.1038/s42003-020-1079-x. - DOI - PMC - PubMed
    1. Hebert LE, Weuve J, Scherr PA, & Evans DA (2013). Alzheimer disease in the United States (2010–2050) estimated using the 2010 census. Neurology 80(19), 1778–1783; doi: 10.1212/WNL.0b013e31828726f5. - DOI - PMC - PubMed
    1. Hou Y, Dan X, Babbar M, Wei Y, Hasselbalch SG, Croteau DL, & Bohr VA (2019). Ageing as a risk factor for neurodegenerative disease. Nat. Rev. Neurol. 15(10), 565–581; doi: 10.1038/s41582-019-0244-7. - DOI - PubMed