. 2024 Mar 4:12:1344734.
doi: 10.3389/fcell.2024.1344734. eCollection 2024.

High-resolution 3D ultrastructural analysis of developing mouse neocortex reveals long slender processes of endothelial cells that enter neural cells

Affiliations

High-resolution 3D ultrastructural analysis of developing mouse neocortex reveals long slender processes of endothelial cells that enter neural cells

Michaela Wilsch-Bräuninger et al. Front Cell Dev Biol. .

Abstract

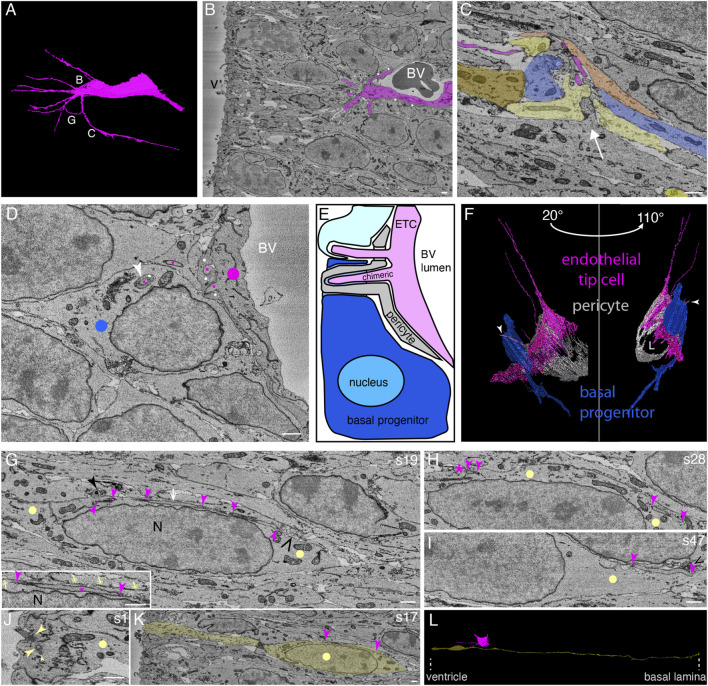
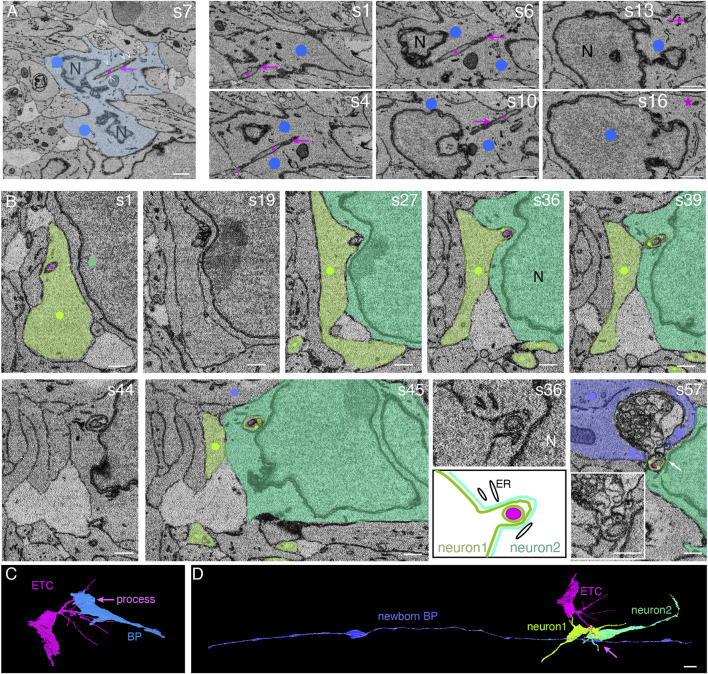
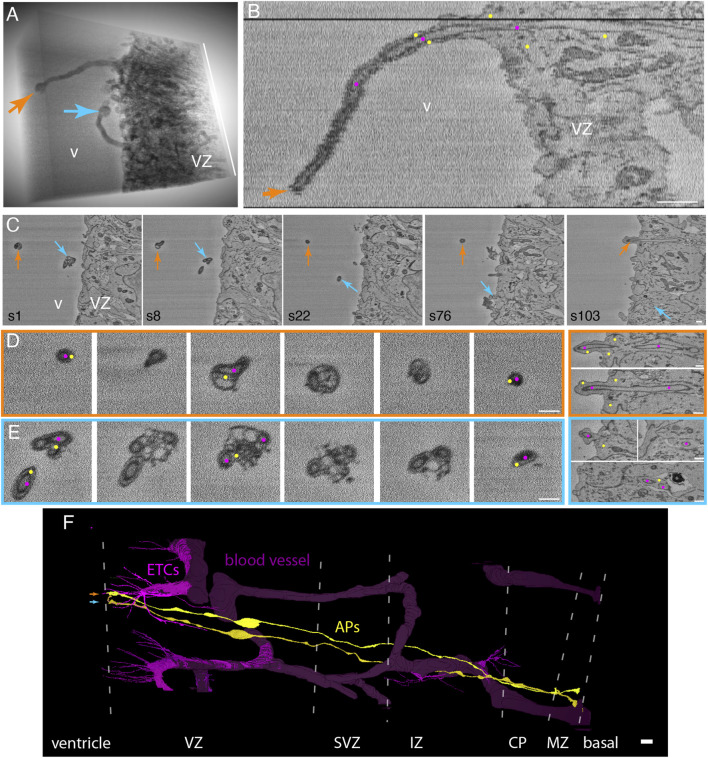
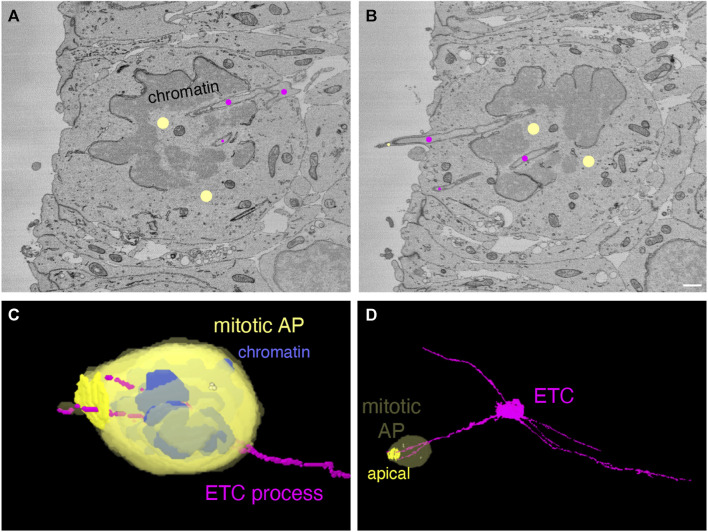
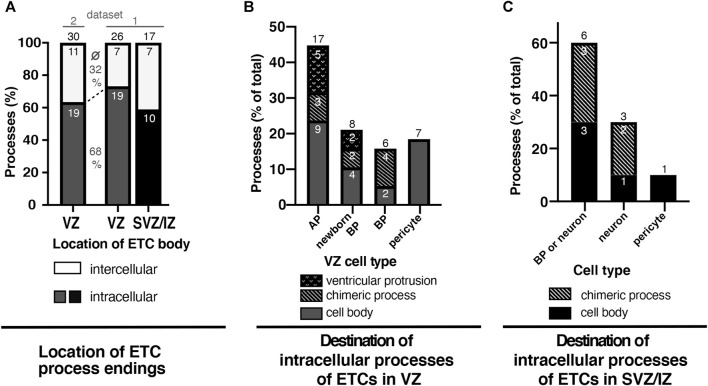
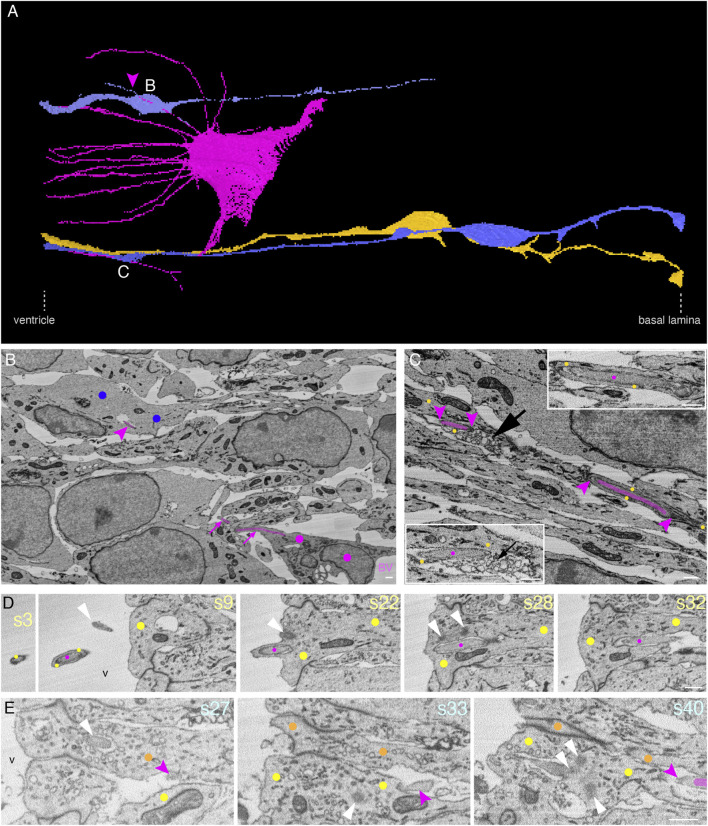
The development of the neocortex involves an interplay between neural cells and the vasculature. However, little is known about this interplay at the ultrastructural level. To gain a 3D insight into the ultrastructure of the developing neocortex, we have analyzed the embryonic mouse neocortex by serial block-face scanning electron microscopy (SBF-SEM). In this study, we report a first set of findings that focus on the interaction of blood vessels, notably endothelial tip cells (ETCs), and the neural cells in this tissue. A key observation was that the processes of ETCs, located either in the ventricular zone (VZ) or subventricular zone (SVZ)/intermediate zone (IZ), can enter, traverse the cytoplasm, and even exit via deep plasma membrane invaginations of the host cells, including apical progenitors (APs), basal progenitors (BPs), and newborn neurons. More than half of the ETC processes were found to enter the neural cells. Striking examples of this ETC process "invasion" were (i) protrusions of apical progenitors or newborn basal progenitors into the ventricular lumen that contained an ETC process inside and (ii) ETC process-containing protrusions of neurons that penetrated other neurons. Our observations reveal a - so far unknown - complexity of the ETC-neural cell interaction.

Keywords: apical progenitors; basal progenitors; cortical development; endothelial tip cell; neurogenesis; radial glial cells; sprouting angiogenesis; volume electron microscopy.


Conflict of interest statement

The authors declare that the research was conducted in the absence of any commercial or financial relationships that could be construed as a potential conflict of interest.

Figures

FIGURE 1
FIGURE 1
In the embryonic mouse neocortex, endothelial tip cell processes can enter, traverse the cytoplasm, and even exit neural cells in the ventricular zone, with cytoplasmic vesicle clusters often associated with the endothelial tip process. (A) Model of an apical ETC from a segmented serial block-face SEM volume through the ventricular zone of a mouse E14.5 neocortex with many long, slender filopodia originating from the cell body. The white letters indicate the positions from which the images in the corresponding subsequent panels are acquired. (B) Single plane of the SBF-SEM stack through the apical ventricular zone of the mouse E14.5 neocortex showing the extremity of a blood vessel (BV, with a dark erythrocyte in the lumen) surrounded by an ETC (colored in magenta, model view in (A)) with multiple filopodia and processes. White dots indicate a pericyte adjacent to the ETC. v, ventricle. (C) Apical progenitors (each AP is indicated by a different type of yellow color) and a newborn basal progenitor (blue) in the vicinity of an endothelial tip cell filopodium (magenta, originating from the blood vessel (not shown) located at the upper side of the micrograph) in the apical ventricular zone. The neural cells adjust their shape and extend protrusions toward the tip cell filopodia (the white arrow indicates the direction of the protrusions). (D) Single plane of the SBF-SEM stack showing an ETC (marked by magenta dots) delimiting a blood vessel (BV) and extending processes that traverse the neighboring pericyte (marked by white dots) and enter the neighboring progenitor cells (blue dot: BP), either on their own or ensheathed by a protrusion of the pericyte (white arrowhead). (E) Schematic representation summarizing the position shown in (D). The processes of the ETC (magenta) are traversing the pericyte and entering the neighboring progenitor cells (progenitor: turquoise and newborn BP: blue), either on their own (upper process) or traversing the cytoplasm surrounded by a chimeric, sheath-like process of a pericyte (lower process, pericyte: gray). The cells entered by the ETC process are a pericyte (gray), a newborn basal (blue) progenitor, and a progenitor (not defined whether apical or basal, light turquoise). BV lumen, blood vessel lumen. (F) Model from the SBF-SEM segmentation of the position shown in (D). The ETC (magenta) entering a pericyte (white) into a newborn basal progenitor (blue) in views at two different angles (20° and 110° tilts with respect to the plane of (D)). The white arrowhead is pointing to the penetrating chimeric process. L, blood vessel lumen. (G–I) Selected SBF-SEM planes through an apical progenitor cell (yellow dots) in the apical VZ traversed by an ETC process (indicated by magenta arrowheads). The ETC process is passing through the elongated progenitor nucleus (N). The area indicated by the white arrow in (G) is shown enlarged in the inset at the bottom left. There, the plasma membrane of the surrounding progenitor cell is marked with yellow double-headed arrows. The solid black arrowhead points to a vesicle cluster bulging from the AP cytoplasm into a neighboring cell. The open black arrowhead points to a vesicle cluster within the AP cytoplasm. (H, I) Different sectioning planes (as indicated by the section number (s) on the top right) from (G) show the endothelial process entering (I, s47) and terminating in (H, s28, asterisk) the apical progenitor cell. Vesicle clusters close to the entry point of the endothelial process in the progenitor cells are indicated by black open arrowheads in (G) and (I). A vesicle cluster protruding from the apical progenitor and surrounded by a neighboring cell is indicated by a black closed arrowhead in (G) (right). (J) First sectioning plane (s1) showing the apical-most end of the cell shown in (G), with an apical primary cilium emerging from a basal body and a duplicated centriole (large arrowheads, basal body, and mother centriole; small arrowhead, duplicated daughter centriole). (K) Sectioning plane through the apical-most VZ, showing the apical process and the nuclear region of the cell shown in (G) (indicated in yellow). The ETC process shown in (G) is visible between the two arrowheads. (L) Model view of the AP (yellow) entered by the ETC (magenta) process shown in panels (G–K) from the segmented SBF-SEM stack. The position of the ventricular surface and the basal lamina is indicated by dotted lines at the bottom. The scale bar for all panels in Figure 1 is 1 µm. Dots, arrows, and arrowheads indicate structures of the following cell types: endothelial cell (magenta), AP (yellow), BP (blue), and pericyte (white).
FIGURE 2
FIGURE 2
Endothelial tip cell processes can enter, traverse the cytoplasm, and even exit basal progenitors and newborn neurons in the intermediate zone of the embryonic mouse neocortex. (A) Selected sectioning planes from a SBF-SEM stack through a basal progenitor (indicated by blue overlay and dots) in the intermediate zone of an embryonic mouse E14.5 neocortex. An ETC process (indicated by magenta dots and arrows) traverses the cytoplasm of the basal progenitor. The ETC process ends in the cytoplasm of the BP close to the plasma membrane opposite to the entry point (asterisk on s16). White open arrowheads in the first panel indicate the endoplasmic reticulum adjacent to the ETC process. Section numbers are indicated at the top right corner. Scale bars: 1 µm. (B) Selected SBF-SEM sectioning planes through the intermediate zone of the E14.5 mouse telencephalon. A process from a basal endothelial tip cell (magenta dots) is entering a first neuron (light green) and traversing its cytoplasm (s1–s27). The cytoplasm of the first neuron bulges out and forms a chimeric, sheath-like protrusion surrounding the ETC process, penetrating together the neighboring second neuron (darker green, s36–s45). The end of the ETC process is found in a large cytoplasmic vesicle cluster that is engulfed by a newborn basal progenitor cell (blue, s57). This transition between neuron 2 and the vesicle cluster (marked by the white arrow) is shown at a higher magnification in the inset in panel s57. The sheath-like protrusion of the first neuron into the second neuron shown in s36 is displayed at higher magnification and with a schematic representation below panel s36. ER, endoplasmic reticulum; N, nucleus. Scale bars: 1 µm. (C) Model view of the position shown in panel (A) from the segmented SBF-SEM stack: the ETC (magenta) traverses with one of its processes the basal progenitor (BP, blue). (D) Model view of the position shown in panel (B) from the segmented SBF-SEM stack: the ETC (magenta, same cell as in (C)) process traverses the cytoplasm of two neurons (greens) and ends engulfed by a newborn basal progenitor (blue) with contact to the ventricle (left) and the basal lamina (right).
FIGURE 3
FIGURE 3
Endothelial tip cell processes that have entered apical progenitors in the embryonic mouse neocortex extend as long “chimeric” processes into the ventricle lumen, with cytoplasmic vesicle clusters at the process. (A) 3D representation of an SBF-SEM volume through the apical-most VZ of a mouse E14.5 neocortex (to the right) with two processes (orange and blue arrows) protruding into the ventricle (v). The processes end in bubble-like structures. The height of the volume is 12.6 µm (white bar on the right). (B) Single xz-plane representation of the SBF-SEM stack containing the orange ventricular protrusion shown in panel (A). The longitudinal view through the protrusion reveals that it consists of an ETC process (magenta dots) surrounded by the cytoplasm sheath of an apical progenitor (AP, marked by yellow dots). (C) Selected sectioning planes (section numbers (s) indicated at the bottom left) of the volume shown in (A) with cross-sections through the two ventricular protrusions (orange and blue arrows). (D, E) High-magnification selected sectioning planes (in ∼250-nm steps) through the orange and blue chimeric processes in the ventricular lumen (left boxed panels) and of the apical-most stretch of the VZ (right boxed panels). The color of the frames indicates the respective labeled protrusion in (A) and (C). These cross-sections show the clustered vesicles in the AP cytoplasm (yellow dots) surrounding the ETC processes (magenta dots) at the bubble-like end of the protrusion. The ETC processes can be followed through the apical end-feet of the respective APs (right panels). v, ventricle; VZ, ventricular zone. Scale bars in (B–E) are 1 µm. (F) Model view of the endothelial tip cells (magenta) and blood vessels (dark violet) contained in the SBF-SEM volume through the mouse E14.5 neocortex. The apical progenitor cells labeled in orange and blue (in A-E) in which the ETC (magenta) processes traversing are shown in yellow. They span from the ventricle (left) to the basal lamina (right). The positions of the borders between the cortical layers are indicated by dotted white lines. VZ, ventricular zone; SVZ, subventricular zone; IZ, intermediate zone; CP, cortical plate; MZ, mantle zone. The scale bar in (F) is 10 µm.
FIGURE 4
FIGURE 4
Endothelial tip cell processes can enter mitotic apical progenitors in the embryonic mouse neocortex. (A, B) Two sectioning planes through an anaphase cell (marked by yellow dots) at the ventricle surface of a mouse E14.5 neocortex serial block-face SEM volume. The anaphase cell is traversed by ETC processes (marked by magenta dots). An ETC process is splitting at the basal end of the anaphase cell (in A) into two branches that pass through the de-condensing chromatin. One ETC branch ends within the cytoplasm of the mitotic cell, whereas the other branch extends into the ventricle surrounded by a protrusion from the anaphase cell. The scale bar in (B) (for A + B) is 1 µm. (C, D) Model view from the segmented SBF-SEM stack of the anaphase cell (yellow) shown in (A) and (B) with blue chromatin and the magenta ETC processes. (C) Higher magnification. (D) Overview. The apical plasma membrane of the anaphase cell is highlighted in (D). The centrioles are indicated as yellow dots within the anaphase cytoplasm.
FIGURE 5
FIGURE 5
At least half of all ETC processes in the VZ and SVZ/intermediate zones of the E14.5 mouse neocortex enter neural cells. (A) Graph depicting the frequency (in %) of ETC filopodia/processes ending in the intercellular space (white) or surrounded by cells (“intracellular”) in the ventricular zone (VZ, dark gray) or the SVZ/intermediate zone (SVZ/IZ, black) of an SBF-SEM stack through the E14.5 embryonic mouse neocortex. The numbers within the bars indicate the actual number of endings analyzed. The black numbers above the bars indicate the total number of endings analyzed for ETCs with cell bodies in the VZ (first and second bars) or in the SVZ/IZ (third bar). The cells analyzed for the first bar are present within dataset 2, as indicated by the line above the bar. Accordingly, the cells analyzed for the second bar (VZ) and third bar (SVZ/IZ) are present in dataset 1. The percentages given between the first and second bars are the average of the percentage of the inter- (top number) and intracellular (bottom) ETC endings in the VZ. (B) Graph depicting the frequency (in %) of the intracellular ETC process endings originating from cell bodies in the ventricular zone (dark gray bars in (A)) classified according to the entered cell type: APs, newborn basal progenitors, BPs, or pericytes. The percentage of endings extending with AP protrusions into the ventricular lumen is shown as a dotted sub-area. The percentage of ETC endings traversing as chimeric processes before entering the progenitor cell is indicated by a diagonal pattern. The small white numbers indicate the actual number of endings analyzed. (C) Graph depicting the frequency (in %) of the intracellular ETC process endings originating from cell bodies in the subventricular and intermediate zones (black group from (A)) classified according to the entered cell type: BPs, neurons, or pericytes. Cells of the group “basal progenitor or neuron” could not be classified unambiguously to either cell type and were, therefore, kept as a separate group. The small white numbers indicate the actual number of endings analyzed. The numbers above the bars give the total number of cells analyzed for the respective zone or cell type.
FIGURE 6
FIGURE 6
In the E12.5 mouse neocortex, ETC processes can touch the neural cell plasma membrane or enter and traverse the cytoplasm of neural cells in the VZ, with cytoplasmic vesicle clusters associated with the intracellular ETC process. (A) Model of an apical ETC and the portion of another ETC from a segmented SBF-SEM volume through the VZ of a mouse E12.5 neocortex, with many long, slender filopodia originating from the cell body. Three progenitor cells (yellow: AP; blue: BPs) which are entered by the ETC processes are shown. The magenta arrowhead points to a chimeric process composed of the ETC process ensheathed by the newborn BP protrusion. The white letters indicate the positions from which the images in the corresponding subsequent panels are acquired. (B) Single plane of the SBF-SEM stack through the VZ of the mouse E12.5 neocortex showing the extremity of a BV surrounded by an ETC (colored in magenta, model view in (A)) with a process in this sectioning plane. Part of the process entering the newborn basal progenitor (marked with blue dots) is visible (upper magenta arrowhead). (C) Single plane of the SBF-SEM stack through the VZ of the mouse E12.5 neocortex apical to a blood vessel lumen (position as indicated in model view in (A)) with an ETC process (colored in magenta and between magenta arrowheads) traversing the cytoplasm of an AP (indicated by yellow dots). The part of the ETC process on the right is shown at higher magnification in the inset on the top right, and the part on the left in the inset is at the bottom left. A cluster of loosely packed vesicles in the AP cytoplasm next to the ETC process is indicated by the black arrow. (D) Selected sectioning planes (section numbers (s) indicated in light yellow at top right) through the apical-most VZ of the mouse E12.5 neocortex with an ETC process (magenta labels) extending into the ventricular lumen (v) surrounded by an AP protrusion (yellow dots). The centrioles (s28), the basal body (s22), and the tip of the apical primary cilium (s9) are indicated by white arrowheads. (E) Selected sectioning planes (section numbers (s) indicated in orange at top right) through the apical-most E12.5 VZ (ventricle (v) to the left) with an ETC process (magenta labels) in the intercellular space, terminating on an AP (s27, orange dots) with a primary cilium (white arrowhead in s27) in a deep plasma membrane invagination. The ETC process is touching another AP (s33, yellow dots). Both APs have duplicated centrioles (white arrowheads in s33 and s40). At the site where the ETC process is touching the progenitors, grooves in their plasma membrane are visible. The scale bars for B–E are 1 µm.

Similar articles

Cited by

References

    1. Andrews M. G., Pearson C. A. (2024). Toward an understanding of glucose metabolism in radial glial biology and brain development. Life Sci. Alliance 7, e202302193. 10.26508/lsa.202302193 - DOI - PMC - PubMed
    1. Bjornsson C. S., Apostolopoulou M., Tian Y., Temple S. (2015). It takes a village: constructing the neurogenic niche. Dev. Cell 32, 435–446. 10.1016/j.devcel.2015.01.010 - DOI - PMC - PubMed
    1. Blake T. C. A., Gallop J. L. (2023). Filopodia in vitro and in vivo . Annu. Rev. Cell Dev. Biol. 39, 307–329. 10.1146/annurev-cellbio-020223-025210 - DOI - PubMed
    1. Bornschlogl T. (2013). How filopodia pull: what we know about the mechanics and dynamics of filopodia. Cytoskelet. Hob. 70, 590–603. 10.1002/cm.21130 - DOI - PubMed
    1. Cardenas A., Borrell V. (2020). Molecular and cellular evolution of corticogenesis in amniotes. Cell Mol. Life Sci. 77, 1435–1460. 10.1007/s00018-019-03315-x - DOI - PMC - PubMed