. 2023 Dec;2(12):1221-1245.
doi: 10.1038/s44161-023-00365-0. Epub 2023 Nov 23.

Disrupted propionate metabolism evokes transcriptional changes in the heart by increasing histone acetylation and propionylation

Affiliations

Disrupted propionate metabolism evokes transcriptional changes in the heart by increasing histone acetylation and propionylation

Kyung Chan Park et al. Nat Cardiovasc Res. 2023 Dec.

Abstract

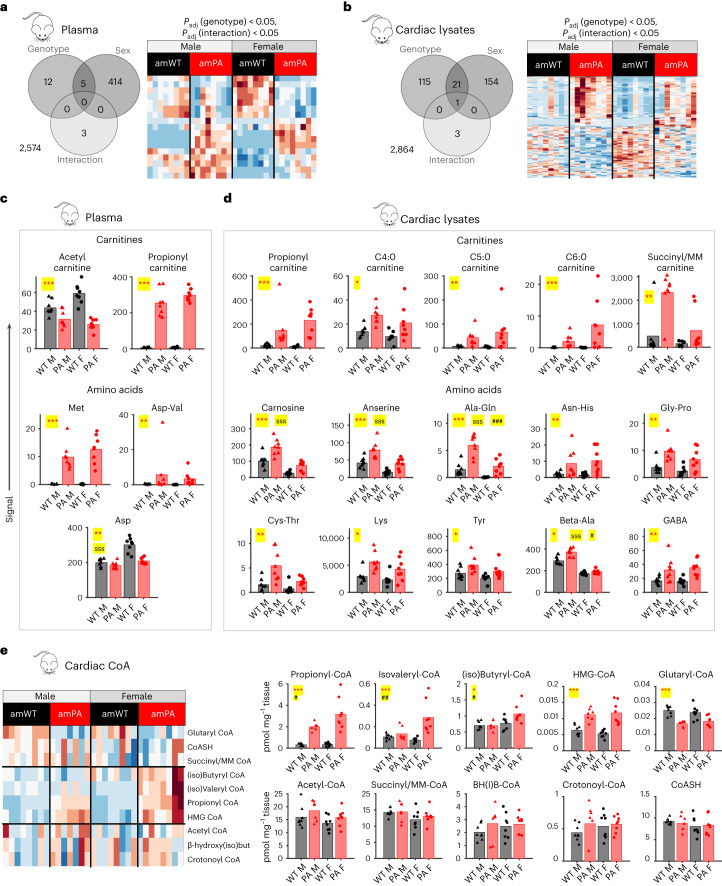
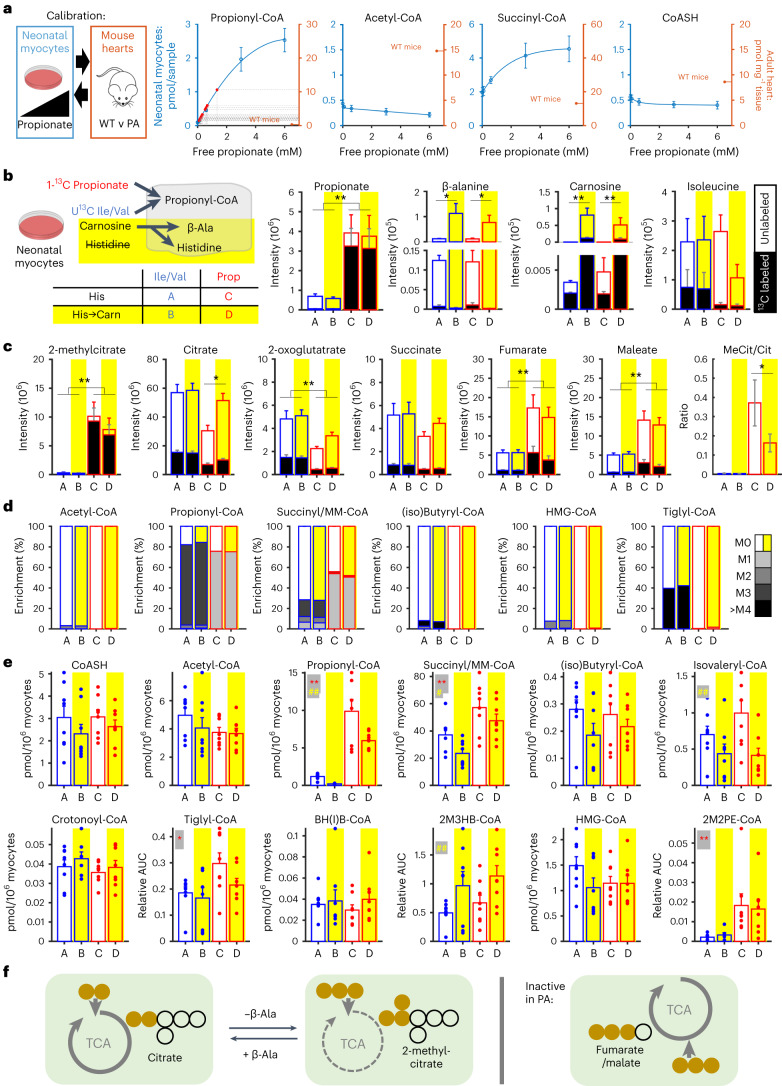
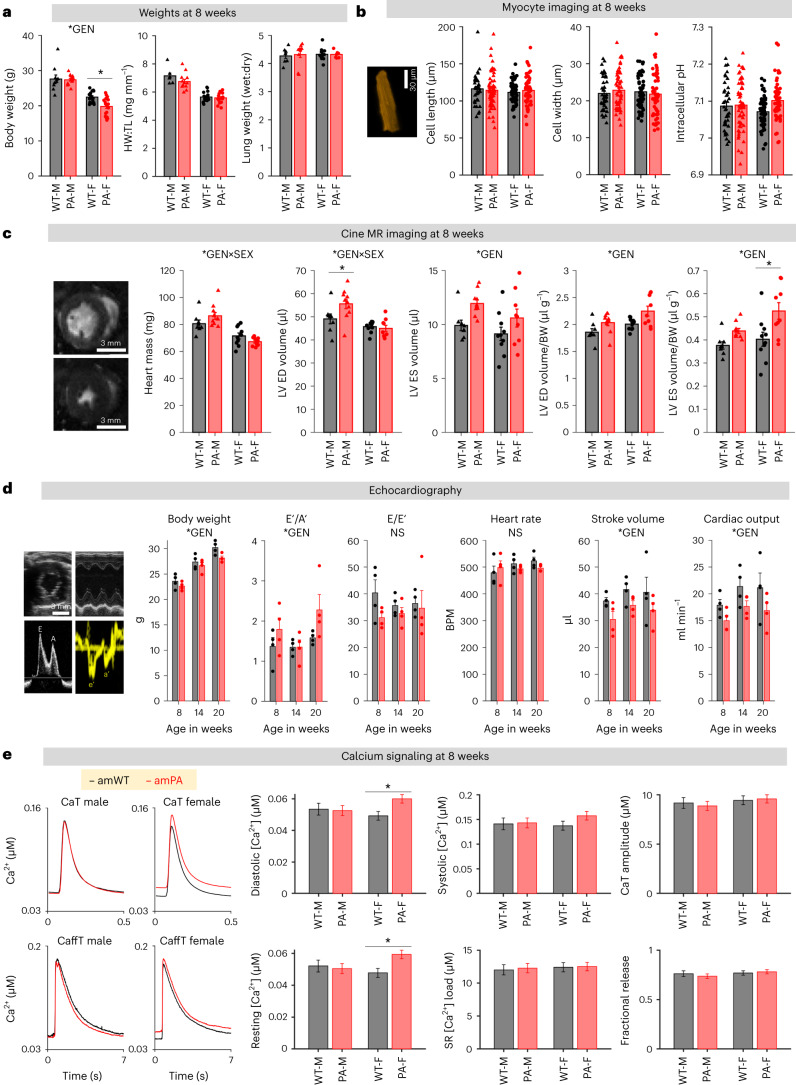
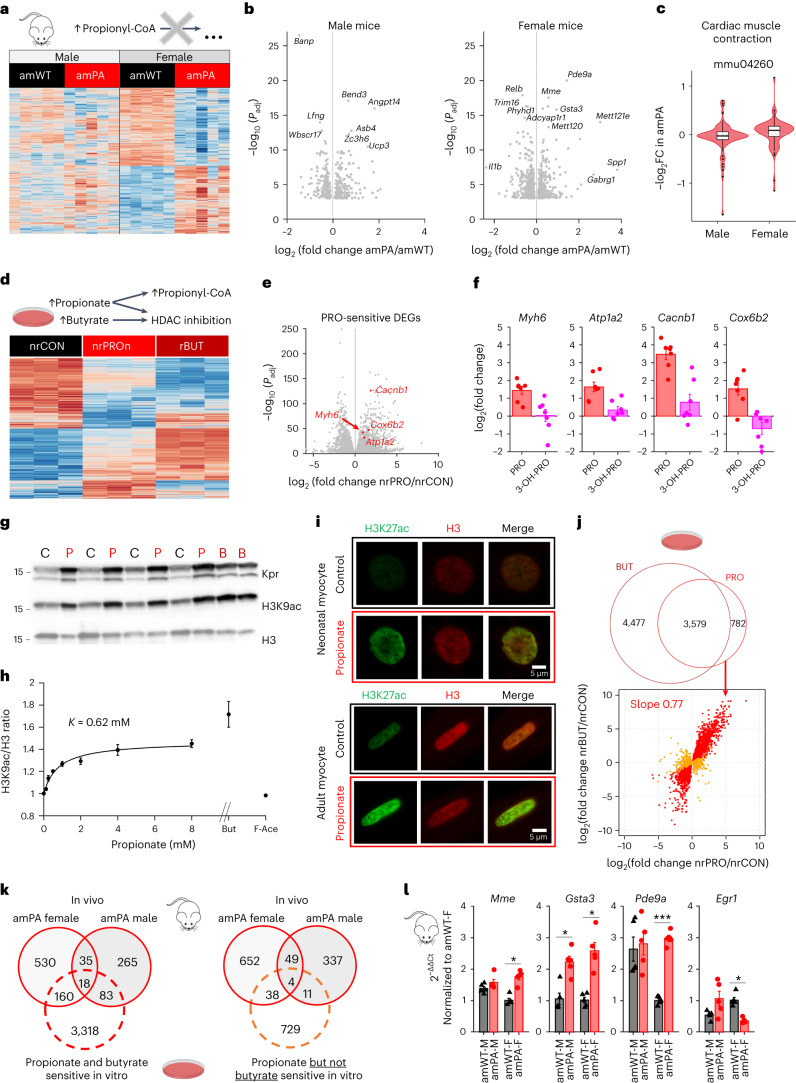
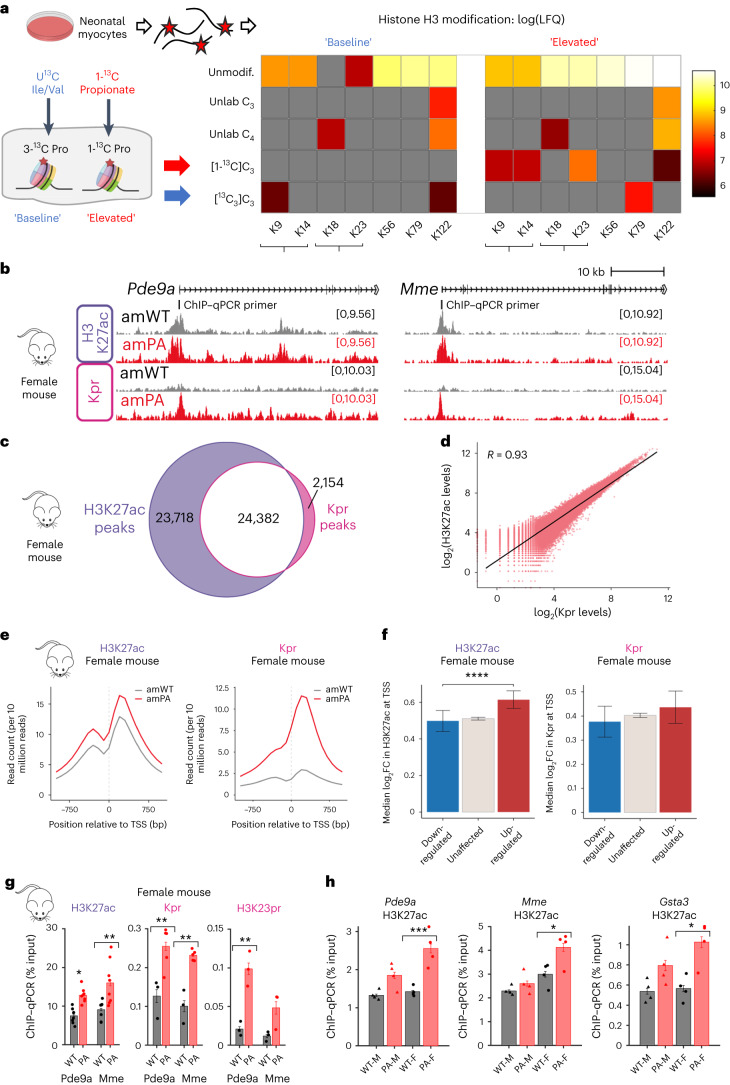
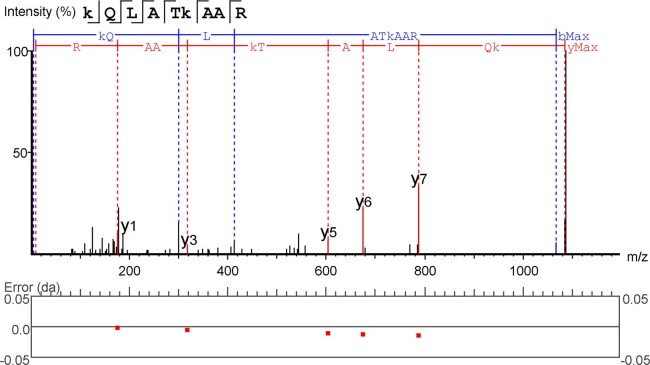
Propiogenic substrates and gut bacteria produce propionate, a post-translational protein modifier. In this study, we used a mouse model of propionic acidaemia (PA) to study how disturbances to propionate metabolism result in histone modifications and changes to gene expression that affect cardiac function. Plasma propionate surrogates were raised in PA mice, but female hearts manifested more profound changes in acyl-CoAs, histone propionylation and acetylation, and transcription. These resulted in moderate diastolic dysfunction with raised diastolic Ca2+, expanded end-systolic ventricular volume and reduced stroke volume. Propionate was traced to histone H3 propionylation and caused increased acetylation genome-wide, including at promoters of Pde9a and Mme, genes related to contractile dysfunction through downscaled cGMP signaling. The less severe phenotype in male hearts correlated with β-alanine buildup. Raising β-alanine in cultured myocytes treated with propionate reduced propionyl-CoA levels, indicating a mechanistic relationship. Thus, we linked perturbed propionate metabolism to epigenetic changes that impact cardiac function.


Conflict of interest statement

Competing interests N.T.C. and T.A.M. are shareholders in and consultants for Dark Blue Therapeutics, Ltd. The remaining authors declare no competing interests.

Figures

Fig. 1
Fig. 1. Metabolic consequences of disrupted PCC activity.
a, Selected metabolic pathways processing propionate. Propiogenic substrates (for example, BCAAs, odd-numbered fatty acids, methionine and cholesterol) yield propionyl-CoA in the mitochondrial (MITO) matrix. Under restricted recruitment into the Krebs cycle by genetically ablated PCC (red cross), propionyl-CoA is converted to 2-methylcitrate, propionyl-glycine, propionyl-carnitine or other derivatives. Some derivatives interconvert to free propionate that readily crosses membranes in its protonated form. b, GC–MS/MS of plasma samples from 8-week female and male mice of WT or PA genotype: free propionate, propionylcarnitine (C3), free carnitine and acetylcarnitine (C2) (two-way ANOVA, significant effect of genotype at **/*** P < 0.01/P < 0.001; n = 6 biologically independent samples). Also shown are data from eight patients with a managed form of PA and two control, non-PA patient samples for reference. Mean ± s.e.m. c, Correlations between plasma parameters. Also shown is the relationship (P < 0.05, Pearson’s test) between mouse body weight and propionyl-carnitine, with additional mouse samples included that had substantial weight loss. IC–MS of sex-balanced plasma samples (n = 6 amWT and n = 8 amPA biologically independent samples) (d), liver lysates (n = 8 amWT and n = 8 amPA biologically independent samples) (e) and cardiac lysates (n = 8 amWT and n = 8 amPA biologically independent samples) (f). Heat maps show differentially abundant metabolites. Symbol size is proportional to the square root of mean signal intensity. [1] 2-methylcitrate, [2] cis-2-methylaconitate, [3] 3-acetylpropionate, [4] N-propionylglycine, [5] methionine sulfone. Analysis by one-factor ANOVA (MetaboAnalyst) corrected for multiple comparisons. g, IC–MS signal for selected substances detected in plasma, liver and cardiac lysates. y axis: intensity. Mean ± s.e.m. Source data
Fig. 2
Fig. 2. Metabolic consequences of disrupted propionyl-CoA metabolism in the heart.
Analysis of ACQ-derivatised amino acids and of underivatised carnitines in plasma (n = 8 amWT and n = 8 amPA biologically independent samples) (a) and matching cardiac lysates (b). Heat maps show metabolites that are significantly affected by genotype or an interaction between genotype and sex (two-way ANOVA with Tukey’s multiple comparisons test, significance for Padj: less than 0.05). Differentially abundant (Padj < 0.05 for genotype) carnitines and amino acids in plasma (c) and cardiac lysates (d). Diagonal pattern indicates significant effect of sex (Padj < 0.05); hatched pattern indicates significant interaction between sex and genotype (Padj < 0.05). Mean ± s.e.m. e, Analysis of cardiac acyl-CoA by LC–MS. Heat map summarizes abundance (absolute quantity in pmol mg−1 heart tissue) grouped by genotype and sex. Histograms quantify changes, indicating significant (P < 0.05) effect of genotype (GEN) or interaction between sex and genotype (SEX×GEN). n = 8 amWT male hearts, n = 7 amPA male hearts, n = 8 amWT female hearts and n = 8 amPA female hearts, biologically independent samples. Statistical testing by two-way ANOVA with Tukey’s multiple comparisons test. Mean ± s.e.m. BH(I)B-CoA, β-hydroxy(iso)butyryl-CoA; MM-CoA, methylmalonyl-CoA. */**/*** P < 0.05/<0.01/<0.001 for effect of genotype. s/ss/sss P < 0.05/<0.01/<0.001 for effect of sex. #/## P < 0.05/<0.01 for effect of interaction between genotype and sex. F, female; M, male. Source data
Fig. 3
Fig. 3. Raising and lessening propionyl-CoA in vitro with medium interventions.
a, Calibration experiment to titrate the amount of exogenous propionate needed produce a rise in propionyl-CoA in the range found in PA hearts. Forty-eight-hour treatment of NRVMs with up to 6 mM sodium propionate. Measurements of acyl-CoAs in NRVM lysates (n = 6 biologically independent samples from six isolations; left axis) were compared to measurements in PA and WT mice (right axis). Mathematical minimisation procedure best-fitted calibration constants to indicate that ∼1 mM propionate produces a rise in propionyl-CoA within the range of PA mice (red dots). Mean ± s.e.m. b, 13C tracing experiment in NRVMs with raised propionyl-CoA (exogenous propionate treatment) and for raised β-alanine (histidine in medium replaced with carnosine; yellow banding). Table shows the four treatment conditions (A/B/C/D). For conditions A/B, Ile and Val were uniformly labeled (13C on all carbons). For conditions C/D, 1 mM labeled propionate (13C at carbon-1) was added to the medium. Condition C/D produced a rise in propionate. n = 7 biologically independent samples per condition from seven isolations. Mean ± s.e.m. */** P < 0.05/<0.01. c, IC–MS identifies Krebs cycle intermediates. MeCit/Cit, 2-methylcitrate/citrate ratio. */** P < 0.05/<0.01. Mean ± s.e.m. d, 13C tracing of Ile/Val carbons (conditions A/B) or propionate carbon-1 (conditions C/D), expressed as percent molar enrichment. n = 7 per condition from seven isolations. Key shows number of 13C-labeled atoms. e, Acyl-CoA measurements expressed either as absolute quantification calibrated against standard curves or as relative AUC (without standards). n = 7 biologically independent samples per condition from seven isolations. */** P < 0.05/<0.01 for effect of propionate treatment. #/## P < 0.05/<0.01 for effect of raising β-alanine. Statistical testing by repeated-measures two-way ANOVA. Mean ± s.e.m. f, Summary of findings. Brown-filled symbols indicate carbons of acetyl-CoA or propionyl-CoA competing for entry into the Krebs cycle as citrate or 2-methylcitrate. Raising β-alanine favors the former. Propionate also enters the Krebs cycle as succinyl-CoA, but this pathway is not normally available in PA due to PCC inactivation. 2M2PE-CoA, trans-2-methyl-pentenoyl-CoA; 2M3HB-CoA, 2-methyl-3-hydroxybutyryl-CoA; BH(I)B-CoA, β-hydroxy(iso)butyryl-CoA; Ile, isoleucine; MM-CoA, methylmalonyl-CoA; Val, valine. Source data
Fig. 4
Fig. 4. Mice with disrupted propionyl-CoA handling develop cardiac contractile dysfunction.
a, Body weight, heart weight (HW):tibia length (TL) ratio and wet:dry lung weight ratio (n = 10, 14, 16 and 19 animals). *GEN denotes significant (P < 0.05) effect of genotype. Two-way ANOVA followed by multiple comparisons test. b, Cell dimensions and intracellular pH measured in cSNARF1-loaded myocytes. Hierarchical analyses from a total of 93–113 cells per genotype from 4–5 isolations. c, Cine MR imaging of 8-week mouse hearts showing rendered heart mass, LV end-diastolic (ED) end-systolic (SV) volumes, and LVED and LVES after normalising to body weight—that is, indexed (n = 8, 10, 10 and 9 animals). *GEN denotes significant (P < 0.05) effect of genotype. *GEN×SEX denotes significant (P < 0.05) interaction between sex and genotype (ordinary two-way ANOVA with Tukey’s multiple comparisons test). d, Echocardiography of female mice scanned at three timepoints (8 weeks, 14 weeks and 20 weeks) and their body weight. E/E′ and E′/A′ were measured from pulsed wave and tissue Doppler in apical four-chamber view; SV and cardiac output were measured in parasternal short-axis view (n = 4 and n = 4 animals, repeated-measures ANOVA). *GEN denotes significant (P < 0.05) effect of genotype. Mean ± s.e.m. e, Calcium signaling measured by fluorescence imaging of myocytes freshly isolated from 8-week-old amPA or amWT hearts. Protocol measured electrically evoked CaTs to obtain diastolic and systolic Ca2+ and CaT amplitude (amp). After a train of CaTs, a CaffT was produced to interrogate resting Ca2+, SR Ca2+ load and fractional release. Hierarchical analysis of 226–240 myocytes from n = 7, 7, 8 and 9 isolations. *P < 0.05. Mean ± s.e.m. BPM, beats per minute; BW, body weight; F, female; M, male; NS, not significant. Source data
Fig. 5
Fig. 5. Cardiac gene expression changes in response to propionate.
a, RNA-seq analysis of cardiac lysates from sex-balanced amPA and amWT hearts (n = 5 biologically independent samples each). Heat map shows all genes significantly affected by genotype (Padj < 0.05), grouped by sex. DESeq2 analysis using design ∼genotype+sex+sex:genotype. b, Volcano plot showing DEGs identified in male and female amPA, relative to amWT. Selected genes are labeled. Corrected for multiple comparisons. c, Violin plot of the log2(fold change (FC)) in expression of genes of the cardiac muscle contraction KEGG pathway in male and female PA mice, relative to WT. Midline shows median, with upper and lower hinges showing 25th and 75th percentiles, respectively. Upper and lower whiskers extend to the largest and smallest data points within 1.5 times the interquartile range of either hinge. d, RNA-seq analysis of lysates obtained from cultured NRVMs treated with 6 mM propionate (nrPRO) or 6 mM butyrate (nrBUT) for 24 h. Heat map shows responses, relative to untreated controls (nrCON). Experiments were grouped from three biologically independent isolations. e, Volcano plot shows transcriptional responses to propionate treatment, highlighting four genes of ‘cardiac muscle contraction’ pathway. Corrected for multiple comparisons. f, RT–qPCR validation of selected genes confirms effect of propionate but not of 3-hydroxy derivative (n = 6 per condition from four isolations). Paired two-tailed t-test. Mean ± s.e.m. g, Western blot of histone extracts from cultured neonatal myocytes treated with 3 mM propionate (P), 3 mM butyrate (B) or control (C), probed using antibodies against pan-propionylation (Kpr), H3K9ac and total histone H3. Includes repeats from independently collected lysates (n = 4 C, 4 P and 2 B from four isolations). h, Whole-cell ELISA measurements of H3K9ac-to-H3 ratio in fixed neonatal myocytes treated for 24 h, normalized to untreated control. Best-fit (non-cooperative Hill curve) indicates half-maximal concentration (n = 6 biologically independent measurements from six isolations, with each measurement determined from technical triplicates). Mean ± s.e.m. But, 3 mM butyrate; F-Ace, 3 mM 2-fluoroacetate. i, Immunofluorescence imaging of adult and neonatal myocyte nuclei after treatment (4 h or 24 h, respectively) with propionate, showing H3K27ac response. Further quantification in Extended Data Fig. 7. j, Comparison of DEGs sensitive to propionate and butyrate in vitro. Red symbols denote DEGs that respond to both propionate and butyrate (Pearson’s r = 0.9198); orange symbols denote DEGs that respond to propionate only (Pearson’s r = −0.1456). k, Venn diagrams showing number of DEGs according to response in vivo (mouse heart) and in vitro (cultured myocytes) grouped by sex. l, RT–qPCR of selected propionate-sensitive DEGs in mouse hearts (n = 5, 5, 5 and 5 biologically independent samples). Ordinary two-way ANOVA with Tukey’s multiple comparisons test. */*** P < 0.05/<0.001. Mean ± s.e.m. F, female; M, male. Source data
Fig. 6
Fig. 6. Disrupted propionyl-CoA handling evokes changes in protein phosphorylation.
a, Representative cGMP FRET trace in NRVMs treated for 48 h with 3 mM propionate (PRO) to induce Pde9a expression, showing the effect of PDE9A-specific inhibitor (PF-9613; 100 µM), IBMX (100 µM) and SNAP/BAY-41 (50 µM and 5 µM, respectively). Double-normalised FRET signal in response to PF-9613 treatment at steady state, showing significant increase in propionate-treated (PRO) myocytes. Bar chart shows quantification of the effect of PF-9613 relative to untreated (CON) NRVMs. Hierarchical analysis of 88–117 myocytes from n = 4 isolations. Unpaired two-tailed t-test. ****P < 0.0001. Mean ± s.e.m. b, cGMP assay in murine cardiac lysates, normalized to protein content (n = 8 biologically independent samples per sex and genotype). Violin plots show distribution of measurements as a proxy of the scope for cGMP signaling. F-test was performed to compare variance in WT versus PA hearts (*P < 0.05). c, Transmembrane H+ fluxes generated by Na+/H+ exchange activity in myocytes isolated from mouse hearts. Female PA myocytes have higher NHE1 activity, which is consistent with a higher engagement of cGMP signaling triggered by natriuretic peptide signaling. Two-way ANOVA analysis of data from 20–35 myocytes from six isolations per category. Mean ± s.e.m. d, Phosphoproteomics of lysates prepared from female PA and WT hearts (n = 6 biologically independent samples per sex and genotype). Differentially abundant peptides (Padj < 0.05), color-coded by type of protein. Shape of symbol indicates the most likely kinase (phosphosite functional score >3) for the given peptide substrate. Two-sample t-test, corrected for multiple comparisons. F, female; M, male; NS, not significant. Source data
Fig. 7
Fig. 7. ChIP reveals increased histone acetylation and propionylation at propionate-responsive genes.
a, 13C tracing of propionyl-CoA sourced from propiogenic substrates (isoleucine/valine) or exogenous propionate to identify propionylation sites on histone H3 under baseline and elevated propionate signaling, respectively. Lysine propionylation was identified by LC–MS/MS. Heat map shows label-free quantification intensity for the various lysines (x axis). The modifications include stable (unlabeled) propionylation (Pro) (‘unlab C3’) or (iso)butyration (‘unlab C4’) or propionylation with one labeled carbon from 1-13C-propionate (1-13C Pro) or three labeled carbons from 13C Ile/Val (3-13C Pro). Gray indicates no signal detected. Intensity is expressed as log10. Residues grouped by brackets are present on the same peptide fragment. b, Reference-normalised ChIP-seq in female amWT and amPA mouse hearts, using antibodies against histone H3K27ac and pan-propionylation (Kpr). ChIP-seq tracks are shown at the Pde9a and Mme promoter loci. c, Overlap of H3K27ac and Kpr peaks in female amWT mice. d, Correlation of H3K27ac and Kpr levels at H3K27ac peaks in female amPA mice. e, Metaplots showing the mean level of H3K27ac or Kpr at active gene promoters in female amWT or amPA mice relative to the transcriptional start site (TSS). f, Median log2(fold change (FC)) (amPA to amWT) in H3K27ac or Kpr levels for genes that are upregulated, downregulated or unaffected in PA. Error bars show 95% confidence intervals. ****P < 0.0001. g, ChIP–qPCR at the Pde9a and Mme promoters using antibodies against H3K27ac (n = 8 biologically independent samples per genotype), pan-Kpr (n = 3 amWT and n = 5 amPA biologically independent samples) and H3K23pr (n = 3 biologically independent samples per genotype). Locations of primer pairs are shown in b. Unpaired two-tailed t-tests. */** P < 0.05/<0.01. Mean ± s.e.m. h, ChIP–qPCR at the promoters of Pde9a, Mme and Gsta3 for H3K27ac in male or female amWT and amPA mice. PA was associated with a significant increase in H3K27ac only in females. n = 4 biologically independent samples. Ordinary two-way ANOVA with Tukey’s multiple comparisons test. */*** P < 0.05/<0.001. Mean ± s.e.m. F, female; Ile, isoleucine; M, male; Unlab, unlabeled; Unmodif., unmodified; Val, valine. Source data
Extended Data Fig. 1
Extended Data Fig. 1. In vivo cardiac phenotyping of mice with disrupted propionyl-CoA handling.
(a) Exemplar electrocardiogram recorded in lead II, showing waves and intervals, in 8-week-old amPA or amWT mice. Heart rate, intervals and wave amplitudes (N = 8, 12, 14, 8). Two-way ANOVA with Tukey’s multiple comparisons test. Mean ± SEM. (b) Echocardiography of female mice scanned at 8 weeks of age. Body weight of mice used for echocardiography, E/E’ and E’/A’ ratio measured from pulsed-wave and Tissue Doppler in apical four-chamber view; stroke volume and cardiac output measured from M-mode scans in the parasternal short-axis view (N = 15, 8). Significance tested by regression analysis. Mean ± SEM. Source data
Extended Data Fig. 2
Extended Data Fig. 2. Ca2+ handling and cell-shortening analysis in 8-week-old and 20-week-old adult mouse ventricular myocytes loaded with FuraRed.
Analysis of (a) SERCA and (b) NCX function, and the fluxes needed to balance their activity (SR backflux and sarcolemmal leak, respectively), from electrically-evoked Ca2+ transients (CaT) and caffeine-evoked Ca2+ release (CaffT) in myocytes isolated from mice at 8 weeks of age. SERCA pump activity was described in terms of a rate constant (unit: s−1) which was calculated from the slope of the relationship between flux and cytoplasmic [Ca2+]. To produce this relationship, flux was calculated from the recovery phase of the CaT, and multiplied by buffering capacity to give d[Ca2+]/dt. Backflux was calculated as the rate required to balance SERCA at diastolic [Ca2+]. The analysis for NCX used the recovery from caffeine-evoked Ca2+ release. Sarcolemmal leak was calculated as the rate required to balance NCX at resting [Ca2+]. Time-course shown as mean only. Hierarchical analysis of 226–240 myocytes from N = 7, 7, 8, 9 isolations. Mean ± SEM. (c) Hierarchical analysis of cell-shortening of myocytes from 8 week mice, obtained from the cell area during electrically-evoked CaT. Mean ± SEM. (d) Analysis of electrically evoked Ca2+ transients and caffeine evoked Ca2+ release in myocytes isolated from mice at 20 weeks of age. See Fig. 3 for details of methods. Hierarchical analysis of results from 4-5 isolations per sex and genotype, yielding 25–37 myocytes per group. * P < 0.05. Mean ± SEM. (e) Recordings of electrically-evoked Ca2+ transients and caffeine-evoked Ca2+ release made in adult rat (ar) ventricular myocytes exposed for 10–30 mins to control (CON) or 6 mM propionate (PRO). Time-course shown as mean ± SEM. Hierarchical analysis of 54-67 myocytes from N = 5 isolations (N.S; not significant). Source data
Extended Data Fig. 3
Extended Data Fig. 3. Treatment of myocytes with propionate in vitro remodels the coupling of action potentials and Ca2+ transients in the absence of hypertrophy.
(a) Sulforhodamine B (SRB) staining of NRVMs treated with propionate (PRO), its 3-hydroxylated derivative (3-OH-PRO) or phenylephrine (PE; pro-hypertrophic agonist) for 48-h. (A) Exemplar images of DAPI and SRB co-staining in control (CON), PRO (4.7 mM) and PE. (b) Ratiometric SRB growth index (eSRB, extra-nuclear SRB signal; nSRB, nuclear SRB signal). N = 6 biologically independent measurements from 6 isolations, with each measurement determined from technical quadruplicates. Ordinary one-way ANOVA with Dunnett’s multiple comparisons test. **** P < 0.0001. Mean ± SEM. (c) Fluorescence imaging of wild-type rat myocytes treated with exogenous propionate. Averaged time-courses of electrically-evoked action potentials (AP; dotted line) and Ca2+ transients (CaT; solid line) made in FluoVolt or Fluo3-loaded neonatal rat (nr) ventricular myocytes respectively, treated for 48-h under control (CON) or 6 mM propionate (PRO) conditions under steady-state pacing at 2 Hz. Time-courses shown as mean only (N = 47–58 myocytes from 7 isolations for FluoVolt, and N = 104–109 myocytes from 9 isolations for Fluo-3). (d) Action potential duration at 90% repolarisation (APD90) and time to 90% CaT recovery (CaT90). Hierarchical analysis of N = 47–58 myocytes from 7 isolations for FluoVolt, and N = 104-109 myocytes from 9 isolations for Fluo-3 shown as mean ± SEM. Two-sided, two sample T-test corrected for hierarchical analysis. **** P < 0.0001. Source data
Extended Data Fig. 4
Extended Data Fig. 4. Propionate-dependent increases in nuclear histone H3 lysine 27 acetylation are temporally labile.
Propionate-evoked increase in H3K27ac studied by immunofluorescence imaging of PRO-treated adult myocytes following a 4-h time-course; ‘off’ indicates replacement of PRO with CON media. Data shown as H3K27ac:H3 signal averaged over the nucleus. N = 40 nuclei (from 20 adult myocytes) from 2 isolations. Ordinary one-way ANOVA with Dunnett’s multiple comparisons test. **/**** P < 0.01/0.0001. Mean ± SEM. Source data
Extended Data Fig. 5
Extended Data Fig. 5. Principal component analysis of transcriptomic data.
Principal component analysis of transcriptomic data from PA (‘KO’) and WT mice (F-female, M-male) (N = 5, 5, 5, 5) and in NRVMs treated with control media or media supplemented with propionate (Prop) or butyrate (But) (N = 3, 3, 3).
Extended Data Fig. 6
Extended Data Fig. 6. Analysis of differentially expressed genes from transcriptomic analysis.
(a) Number of genes in the mmu03260 KEGG pathway that are differentially expressed in female and male PA mice, relative to wild-type. (b) DEGs identified in female and male amPA, relative to amWT. Red filled symbols identify DEGs found also to be propionate- and butyrate-sensitive in vitro. Red empty symbols identify DEGs that were also found to be sensitive to propionate, but not butyrate, in vitro. The remaining DEGs, appearing as grey symbols, were identified in mice only, but not in vitro. (c) Volcano plots for DEGs identified in male or female mice, categorized by sensitivity to propionate/butyrate in cultured neonatal rat ventricular myocytes. DEGs in light blue were identified in both sexes. Labeled DEGs are genes of interest. (d) Lollipop graph of KEGG pathway analysis from DEGs identified in female PA mice and propionate-treated NRVMs. Red box indicates common enrichments. Adjusted P < 0.05.
Extended Data Fig. 7
Extended Data Fig. 7. Histone H3 lysine 27 acetylation is increased in a spatially consistent manner in the nuclei of myocytes treated with propionate in vitro.
H3K27ac and H3 immunofluorescence imaging of adult and neonatal myocyte nuclei following 4-h and 24-h treatment respectively, with 6 mM propionate (PRO) or 6 mM butyrate (BUT). Summary data for H3K27ac in (a) adult and (b) neonatal myocytes. Data shown as the average H3K27ac:H3 signal averaged over the nucleus (left) and the H3K27ac:H3 ratio plotted against distance from the nuclear outline (µm) (right). Hierarchical analysis of 80 nuclei (from 40 adult myocytes) and 80 nuclei (from 80 neonatal myocytes) from N = 4 isolations. Ordinary one-way ANOVA with Tukey’s multiple comparisons test. **** P < 0.0001. Mean ± SEM. Source data
Extended Data Fig. 8
Extended Data Fig. 8. Transcriptional responses to propionate in vitro and disrupted propionyl-CoA handling in vivo.
(a) Concentration-dependence of Pde9a induction following 24-h exogenous propionate treatment in NRVMs in vitro. Shown are 2ΔΔCT values normalised to control (CON). Results from N = 4 isolations per condition. Ordinary one-way ANOVA with Dunnett’s multiple comparisons test. ***/**** P < 0.001/0.0001. Mean ± SEM. (b) RT-qPCR of adult mouse heart lysates showing lack of effect of PA or sex on the expression of major PDE-coding genes (except Pde9a) or (c) in natriuretic peptide A and B expression (N = 5, 5, 5, 5). Mean ± SEM. Source data
Extended Data Fig. 9
Extended Data Fig. 9. Exemplar histone LC-MS/MS spectrum.
Exemplar MS spectrum of peptide 19–27 (from a sample treated under the condition ‘elevated propionate signalling’) showing 13C1-propionylation at K23.
Extended Data Fig. 10
Extended Data Fig. 10. Chromatin immunoprecipitation reveals increased histone acetylation and propionylation at propionate-responsive genes.
(a) Proportion of genes marked by a peak of H3K27ac, Kpr, or both modifications at the promoter, for unaffected and differentially expressed genes in amPA mice. (b) Overlap of H3K27ac or Kpr peaks in female amWT and amPA mice. (c) Log2-fold change in H3K27ac or Kpr levels in amPA mice relative to amWT mice at the promoters of active genes that are unaffected or sensitive to both PA in vivo and propionate in vitro. Dashed line shows the median log2-fold change for unaffected genes. Upper and lower hinges showing 25th and 75th percentile, respectively. Upper and lower whiskers extend to the largest and smallest datapoints within 1.5 times the interquartile range of either hinge. (d) Concentration-dependence of propionate effect on H3K27ac ChIP-qPCR at Pde9a and Mme promoters in NRVMs. N = 4 matched biologically independent samples per condition from 4 isolations. Repeated measures one-way ANOVA with Dunnett’s multiple comparisons test. * P < 0.05. Mean ± SEM. (e) Reference-normalised ChIP-seq for H3K27ac in cultured neonatal rat ventricular myocytes, either untreated (nrCON) or treated with 6 mM propionate (nrPRO) for 48-h. ChIP-seq tracks are shown at Pde9a and Mme. (f) Metaplots showing the mean level of H3K27ac at active gene promoters in cultured neonatal rat ventricular myocytes treated with 6 mM propionate (nrPRO) for 48-h or control (nrCON). (g) Overlap of H3K27ac peaks in untreated (nrCON) NRVMs or myocytes treated with 6 mM propionate for 48-h (nrPRO). (h) Median log2-fold change in H3K27ac in treated (nrPRO) versus untreated (nrCON) myocytes for genes that are up-regulated, down-regulated or unaffected by propionate treatment in vitro. Error bars show 95% confidence intervals. **** P < 0.0001. (i) ChIP-qPCR at the Pde9a and Mme promoters for H3K27ac and Kpr cultured myocytes, showing increase in nrPRO, relative to nrCON. N = 4 biologically independent samples per condition from 4 isolations. */** P < 0.05/0.01. Mean ± SEM. Source data

References

    1. Shvedunova M, Akhtar A. Modulation of cellular processes by histone and non-histone protein acetylation. Nat. Rev. Mol. Cell Biol. 2022;23:329–349. doi: 10.1038/s41580-021-00441-y. - DOI - PubMed
    1. Sabari BR, Zhang D, Allis CD, Zhao Y. Metabolic regulation of gene expression through histone acylations. Nat. Rev. Mol. Cell Biol. 2017;18:90–101. doi: 10.1038/nrm.2016.140. - DOI - PMC - PubMed
    1. Backs J, Olson EN. Control of cardiac growth by histone acetylation/deacetylation. Circ. Res. 2006;98:15–24. doi: 10.1161/01.RES.0000197782.21444.8f. - DOI - PubMed
    1. Hulikova A, et al. Alkaline nucleoplasm facilitates contractile gene expression in the mammalian heart. Basic Res. Cardiol. 2022;117:17. doi: 10.1007/s00395-022-00924-9. - DOI - PMC - PubMed
    1. Gillette TG, Hill JA. Readers, writers, and erasers: chromatin as the whiteboard of heart disease. Circ. Res. 2015;116:1245–1253. doi: 10.1161/CIRCRESAHA.116.303630. - DOI - PMC - PubMed