

Metabolism-associated molecular classification and prognosis signature of head and neck squamous cell carcinoma
- PMID: 38501009
- PMCID: PMC10945276
- DOI: 10.1016/j.heliyon.2024.e27587
Metabolism-associated molecular classification and prognosis signature of head and neck squamous cell carcinoma
Abstract
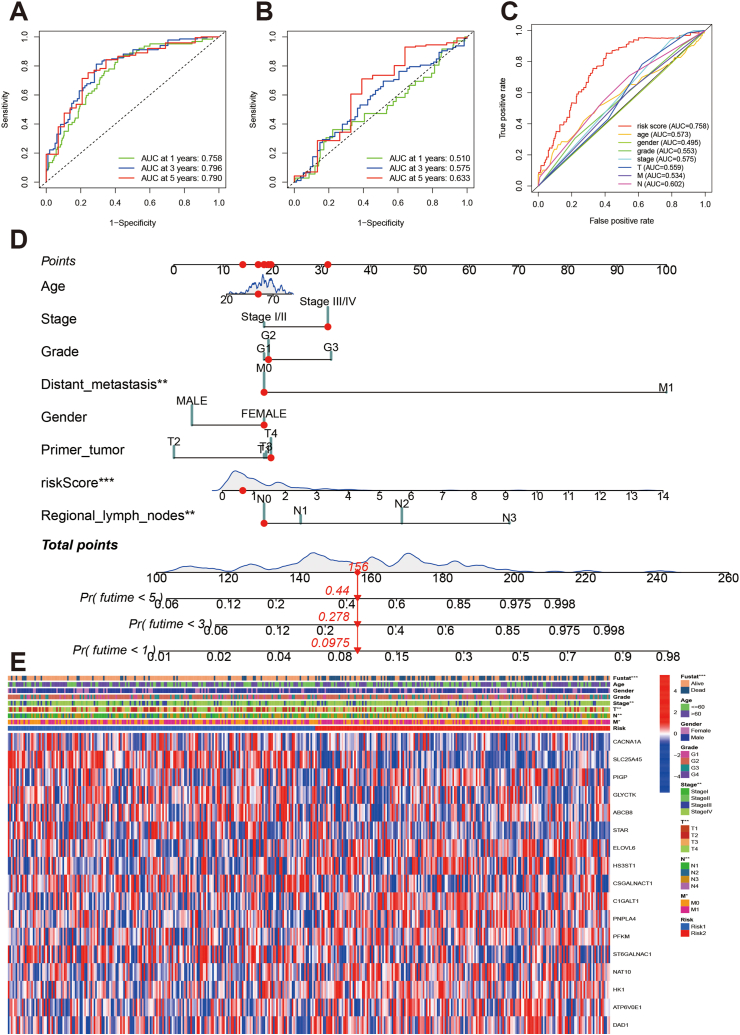
Although the fundamental processes and chemical changes in metabolic programs have been elucidated in many cancers, the expression patterns of metabolism-related genes in head and neck squamous cell carcinoma (HNSCC) remain unclear. The mRNA expression profiles from the Cancer Genome Atlas included 502 tumour and 44 normal samples were extracted. We explored the biological functions and prognosis roles of metabolism-associated genes in patients with HNSCC. The results indicated that patients with HNSCC could be divided into three molecular subtypes (C1, C2 and C3) based on 249 metabolism-related genes. There were markedly different clinical characteristics, prognosis outcomes, and biological functions among the three subtypes. Different molecular subtypes also have different tumour microenvironments and immune infiltration levels. The established prognosis model with 17 signature genes could predict the prognosis of patients with HNSCC and was validated using an independent cohort dataset. An individual risk scoring tool was developed using the risk score and clinical parameters; the risk score was an independent prognostic factor for patients with HNSCC. Different risk stratifications have different clinical characteristics, biological features, tumour microenvironments and immune infiltration levels. Our study could be used for clinical risk management and to help conduct precision medicine for patients with HNSCC.
Keywords: Head and neck squamous cell carcinoma; Immune infiltration; Metabolism; Prognosis model.
© 2024 The Authors.
Conflict of interest statement
The authors declare that they have no known competing financial interests or personal relationships that could have appeared to influence the work reported in this paper.
Figures


Similar articles
-
A predictive model of immune infiltration and prognosis of head and neck squamous cell carcinoma based on cell adhesion-related genes: including molecular biological validation.Front Immunol. 2023 Aug 24;14:1190678. doi: 10.3389/fimmu.2023.1190678. eCollection 2023. Front Immunol. 2023. PMID: 37691922 Free PMC article.
-
A pyroptosis-related gene expression signature predicts immune microenvironment and prognosis in head and neck squamous cell carcinoma.Eur Arch Otorhinolaryngol. 2024 Feb;281(2):953-963. doi: 10.1007/s00405-023-08316-y. Epub 2023 Dec 8. Eur Arch Otorhinolaryngol. 2024. PMID: 38063904
-
Effects of immune inflammation in head and neck squamous cell carcinoma: Tumor microenvironment, drug resistance, and clinical outcomes.Front Genet. 2022 Dec 12;13:1085700. doi: 10.3389/fgene.2022.1085700. eCollection 2022. Front Genet. 2022. PMID: 36579330 Free PMC article.
-
Identification and verification of eight cancer-associated fibroblasts related genes as a prognostic signature for head and neck squamous cell carcinoma.Heliyon. 2023 Feb 28;9(3):e14003. doi: 10.1016/j.heliyon.2023.e14003. eCollection 2023 Mar. Heliyon. 2023. PMID: 36938461 Free PMC article.
-
Inflammatory response-related genes predict prognosis in patients with HNSCC.Immunol Lett. 2023 Jul;259:46-60. doi: 10.1016/j.imlet.2023.06.003. Epub 2023 Jun 4. Immunol Lett. 2023. PMID: 37279805
Cited by
-
NMR-Based Metabolomics of Blood Serum in Predicting Response to Induction Chemotherapy in Head and Neck Cancer-A Preliminary Approach.Int J Mol Sci. 2024 Jul 10;25(14):7555. doi: 10.3390/ijms25147555. Int J Mol Sci. 2024. PMID: 39062797 Free PMC article.
-
Metabolic profiles in laryngeal cancer defined two distinct molecular subtypes with divergent prognoses.Front Immunol. 2025 May 22;16:1512502. doi: 10.3389/fimmu.2025.1512502. eCollection 2025. Front Immunol. 2025. PMID: 40475768 Free PMC article.
References
-
- Sung H., Ferlay J., Siegel R.L., Laversanne M., Soerjomataram I., Jemal A., Bray F. Global cancer statistics 2020: GLOBOCAN estimates of incidence and mortality worldwide for 36 cancers in 185 countries. Ca - Cancer J. Clin. 2021;71:209–249. https://10.3322/caac.21660 - DOI - PubMed
-
- Bray F., Ferlay J., Soerjomataram I., Siegel R.L., Torre L.A., Jemal A. Global cancer statistics 2018: GLOBOCAN estimates of incidence and mortality worldwide for 36 cancers in 185 countries. Ca - Cancer J. Clin. 2018;68:394–424. https://10.3322/caac.21492 - DOI - PubMed
-
- Pai S.I., Westra W.H. Molecular pathology of head and neck cancer: implications for diagnosis, prognosis, and treatment. Annu. Rev. Pathol. 2009;4:49–70. https://10.1146/annurev.pathol.4.110807.092158 - DOI - PMC - PubMed
-
- Shui C.Y., Li C., Liu W., Cai Y.C., Jiang J., Sun R.H., Zhou Y.Q., Qin G. [Research progress in pathogenesis, treatment and prognosis of HPV positive head and neck squamous cell carcinoma] Zhonghua er bi yan hou tou jing wai ke za zhi. 2018;53:392–396. https://10.3760/cma.j.issn.1673-0860.2018.05.014 - DOI - PubMed
-
- Li T., Lu J., Yin Y., Qiu Q. Editorial: prognosis prediction and risk stratification in head and neck cancer. Front. Oncol. 2022;12 https://10.3389/fonc.2022.1037001 - DOI - PMC - PubMed
LinkOut - more resources
Full Text Sources
Miscellaneous
