

Glymphatic system dysfunction predicts amyloid deposition, neurodegeneration, and clinical progression in Alzheimer's disease
- PMID: 38501315
- PMCID: PMC11095446
- DOI: 10.1002/alz.13789
Glymphatic system dysfunction predicts amyloid deposition, neurodegeneration, and clinical progression in Alzheimer's disease
Abstract
Introduction: Although glymphatic function is involved in Alzheimer's disease (AD), its potential for predicting the pathological and clinical progression of AD and its sequential association with core AD biomarkers is poorly understood.
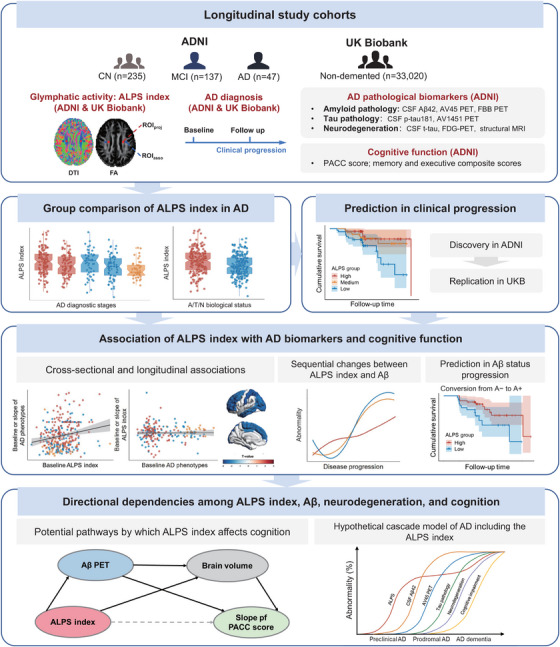
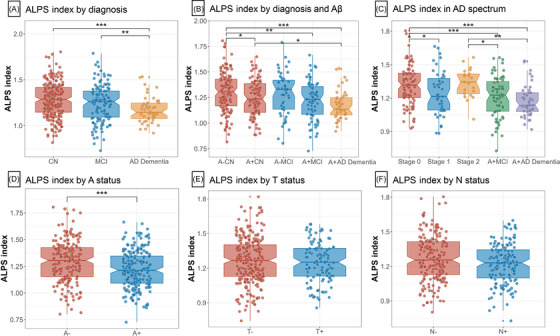
Methods: Whole-brain glymphatic activity was measured by diffusion tensor image analysis along the perivascular space (DTI-ALPS) in participants with AD dementia (n = 47), mild cognitive impairment (MCI; n = 137), and normal controls (n = 235) from the Alzheimer's Disease Neuroimaging Initiative.
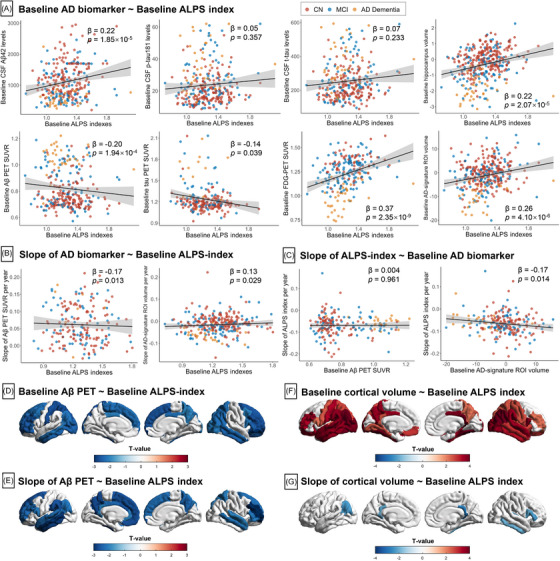
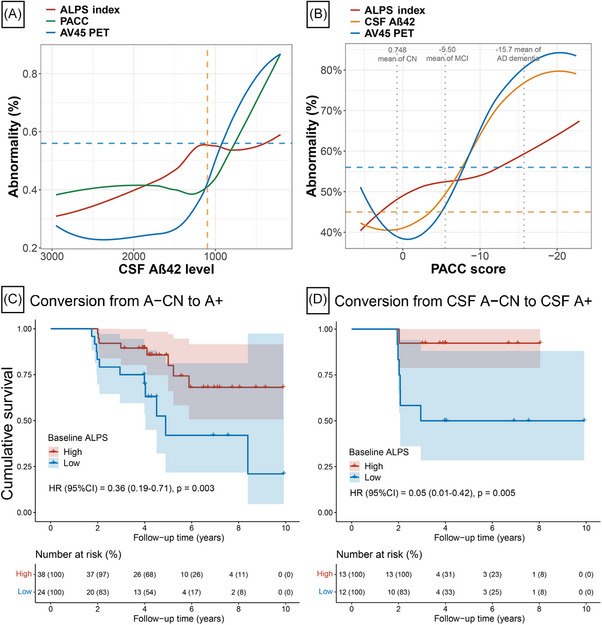
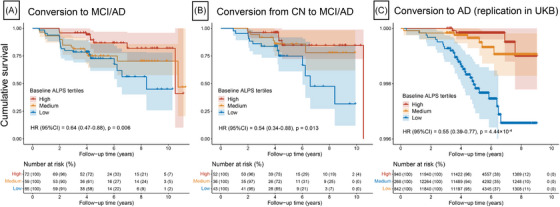
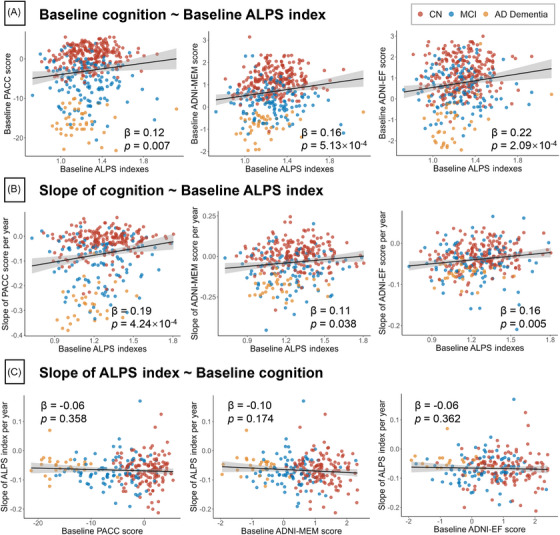
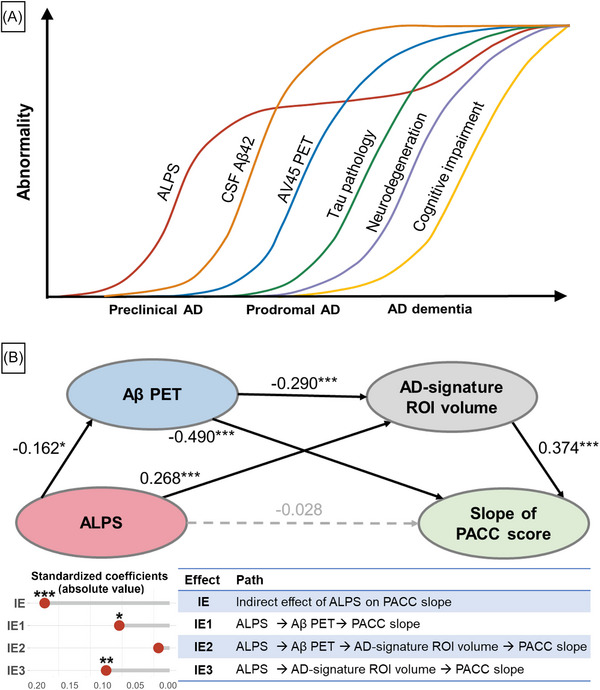
Results: ALPS index was significantly lower in AD dementia than in MCI or controls. Lower ALPS index was significantly associated with faster changes in amyloid positron emission tomography (PET) burden and AD signature region of interest volume, higher risk of amyloid-positive transition and clinical progression, and faster rates of amyloid- and neurodegeneration-related cognitive decline. Furthermore, the associations of the ALPS index with cognitive decline were fully mediated by amyloid PET and brain atrophy.
Discussion: Glymphatic failure may precede amyloid pathology, and predicts amyloid deposition, neurodegeneration, and clinical progression in AD.
Highlights: The analysis along the perivascular space (ALPS) index is reduced in patients with Alzheimer's disease (AD) dementia, prodromal AD, and preclinical AD. Lower ALPS index predicted accelerated amyloid beta (Aβ) positron emission tomography (PET) burden and Aβ-positive transition. The decrease in the ALPS index occurs before cerebrospinal fluid Aβ42 reaches the positive threshold. ALPS index predicted brain atrophy, clinical progression, and cognitive decline. Aβ PET and brain atrophy mediated the link of ALPS index with cognitive decline.
Keywords: Alzheimer's disease; amyloid; analysis along the perivascular space; cognitive decline; glymphatic; neurodegeneration; progression.
© 2024 The Authors. Alzheimer's & Dementia published by Wiley Periodicals LLC on behalf of Alzheimer's Association.
Conflict of interest statement
The authors declare no conflict of interest related to this work. Author disclosures are available in the supporting information.
Figures
Similar articles
-
Impaired Glymphatic Flow on Diffusion Tensor MRI as a Marker of Neurodegeneration in Alzheimer's Disease: Correlation with Gray Matter Volume Loss and Cognitive Decline Independent of Cerebral Amyloid Deposition.J Alzheimers Dis. 2024;99(1):279-290. doi: 10.3233/JAD-231131. J Alzheimers Dis. 2024. PMID: 38669532
-
Perivascular space and white matter hyperintensities in Alzheimer's disease: associations with disease progression and cognitive function.Alzheimers Res Ther. 2025 Mar 18;17(1):62. doi: 10.1186/s13195-025-01707-9. Alzheimers Res Ther. 2025. PMID: 40098158 Free PMC article.
-
Characterization of the glymphatic system and early-phase β-amyloid imaging in Alzheimer's disease: A simultaneous PET/MR study.Brain Res Bull. 2025 Jun 15;226:111368. doi: 10.1016/j.brainresbull.2025.111368. Epub 2025 May 2. Brain Res Bull. 2025. PMID: 40320077
-
Understanding disease progression and improving Alzheimer's disease clinical trials: Recent highlights from the Alzheimer's Disease Neuroimaging Initiative.Alzheimers Dement. 2019 Jan;15(1):106-152. doi: 10.1016/j.jalz.2018.08.005. Epub 2018 Oct 13. Alzheimers Dement. 2019. PMID: 30321505 Review.
-
Long night's journey into the day: amyloid-β imaging in Alzheimer's disease.J Alzheimers Dis. 2013;33 Suppl 1:S349-59. doi: 10.3233/JAD-2012-129034. J Alzheimers Dis. 2013. PMID: 22710919 Review.
Cited by
-
Accumulation of Cerebrospinal Fluid, Ventricular Enlargement, and Cerebral Folate Metabolic Errors Unify a Diverse Group of Neuropsychiatric Conditions Affecting Adult Neocortical Functions.Int J Mol Sci. 2024 Sep 23;25(18):10205. doi: 10.3390/ijms251810205. Int J Mol Sci. 2024. PMID: 39337690 Free PMC article.
-
Olfactory Dysfunction as a Clinical Marker of Early Glymphatic Failure in Neurodegenerative Diseases.Diagnostics (Basel). 2025 Mar 13;15(6):719. doi: 10.3390/diagnostics15060719. Diagnostics (Basel). 2025. PMID: 40150062 Free PMC article. Review.
-
Glymphatic system dysfunction and cerebrospinal fluid retention in gliomas: evidence from perivascular space diffusion and volumetric analysis.Cancer Imaging. 2025 Apr 7;25(1):51. doi: 10.1186/s40644-025-00868-y. Cancer Imaging. 2025. PMID: 40197529 Free PMC article.
-
The role of brain-liver-gut Axis in neurological disorders.Burns Trauma. 2025 May 2;13:tkaf011. doi: 10.1093/burnst/tkaf011. eCollection 2025. Burns Trauma. 2025. PMID: 40321299 Free PMC article. Review.
-
Diffusion Tensor Imaging Analysis Along the Perivascular Space (DTI-ALPS) in Normal Pressure Hydrocephalus: A Review of Recent Advances.Cureus. 2025 Apr 7;17(4):e81830. doi: 10.7759/cureus.81830. eCollection 2025 Apr. Cureus. 2025. PMID: 40337579 Free PMC article. Review.
References
Publication types
MeSH terms
Grants and funding
- 21QA1408700/Shanghai Rising-Star Program
- 2019074/Shanghai Talent Development Funding for The Project
- Tianqiao and Chrissy Chen Institute
- 2022QD002/Research Start-up Fund of Huashan Hospital
- State Key Laboratory of Neurobiology and Frontiers Center for Brain Science of Ministry of Education, Fudan University
- 82071201 82071997/National Natural Science Foundation of China
- 2018SHZDZX01/Shanghai Municipal Science and Technology Major Project
- 3030277001/Excellence 2025 Talent Cultivation Program at Fudan University
- U01 AG024904/AG/NIA NIH HHS/United States
- 2022ZD0211600/Science and Technology Innovation 2030 Major Projects
- ZHANGJIANG LAB
LinkOut - more resources
Full Text Sources
Medical
