. 2024 May;20(5):3228-3250.
doi: 10.1002/alz.13788. Epub 2024 Mar 19.

Viscous dynamics associated with hypoexcitation and structural disintegration in neurodegeneration via generative whole-brain modeling

Affiliations

Viscous dynamics associated with hypoexcitation and structural disintegration in neurodegeneration via generative whole-brain modeling

Carlos Coronel-Oliveros et al. Alzheimers Dement. 2024 May.

Abstract

Introduction: Alzheimer's disease (AD) and behavioral variant frontotemporal dementia (bvFTD) lack mechanistic biophysical modeling in diverse, underrepresented populations. Electroencephalography (EEG) is a high temporal resolution, cost-effective technique for studying dementia globally, but lacks mechanistic models and produces non-replicable results.

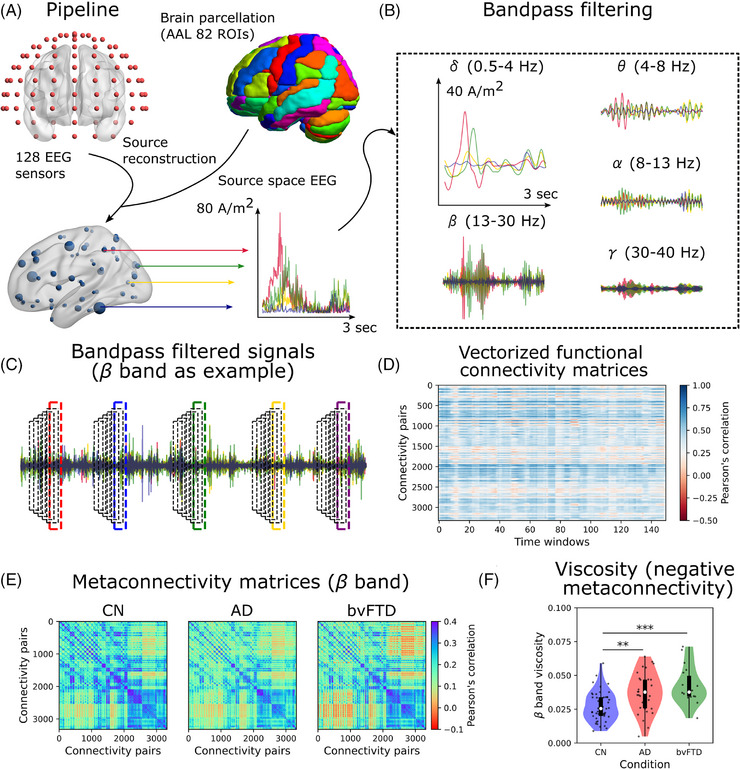
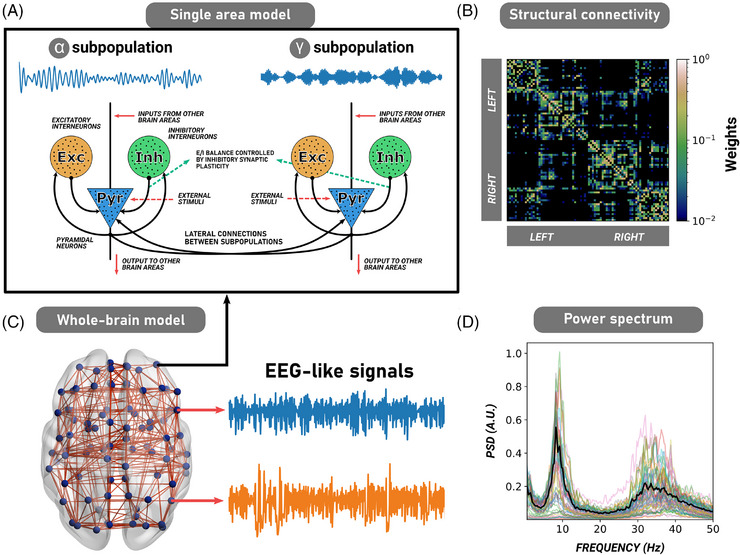
Methods: We developed a generative whole-brain model that combines EEG source-level metaconnectivity, anatomical priors, and a perturbational approach. This model was applied to Global South participants (AD, bvFTD, and healthy controls).

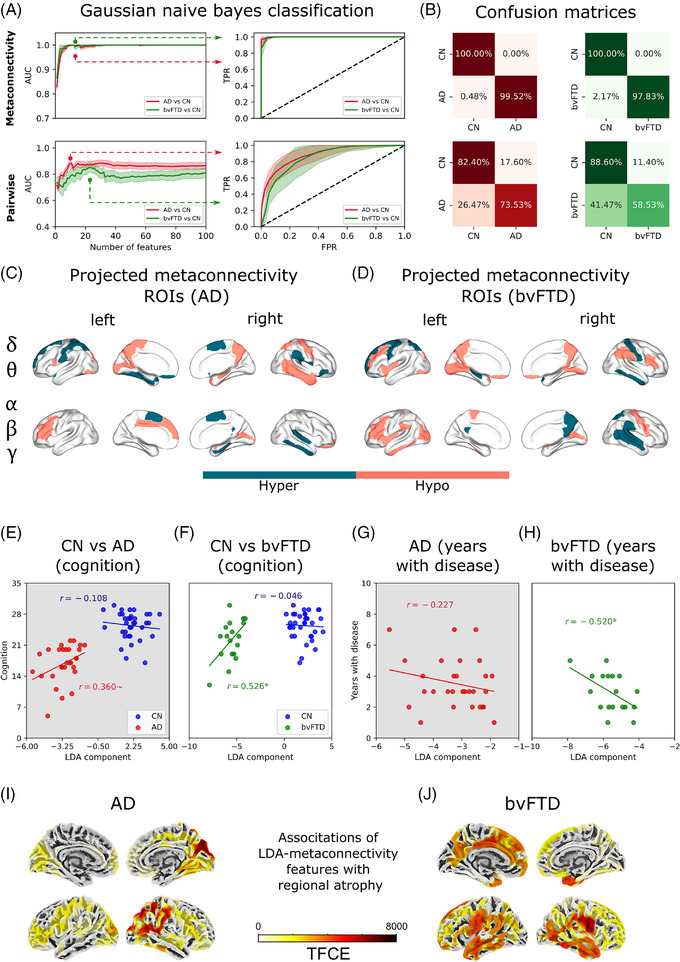
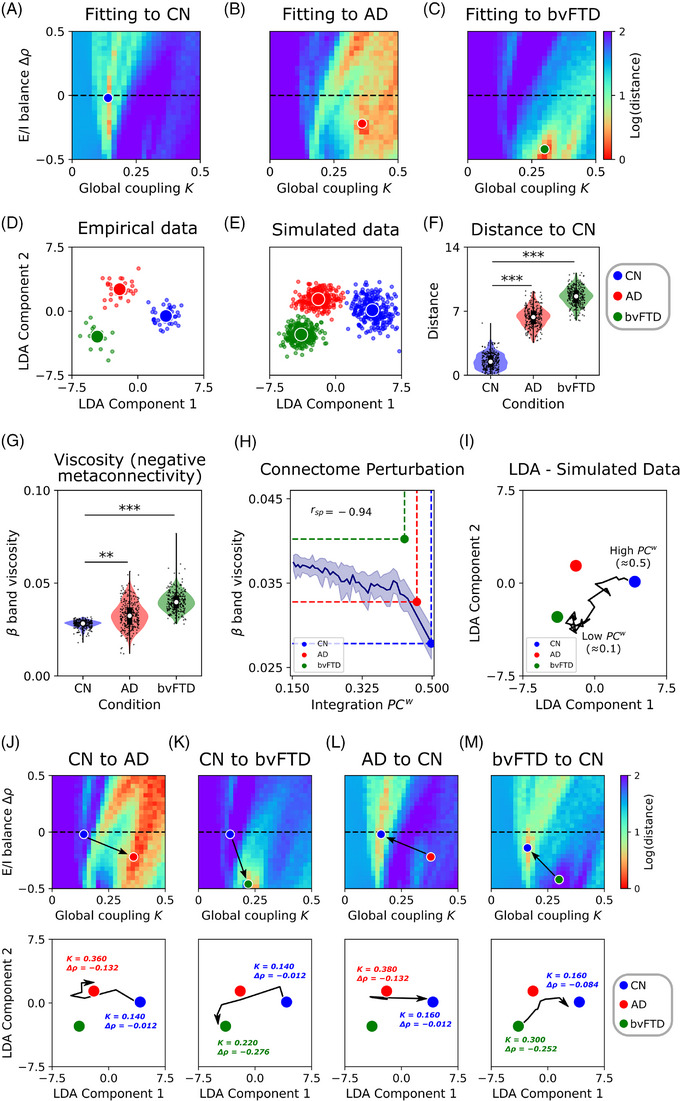
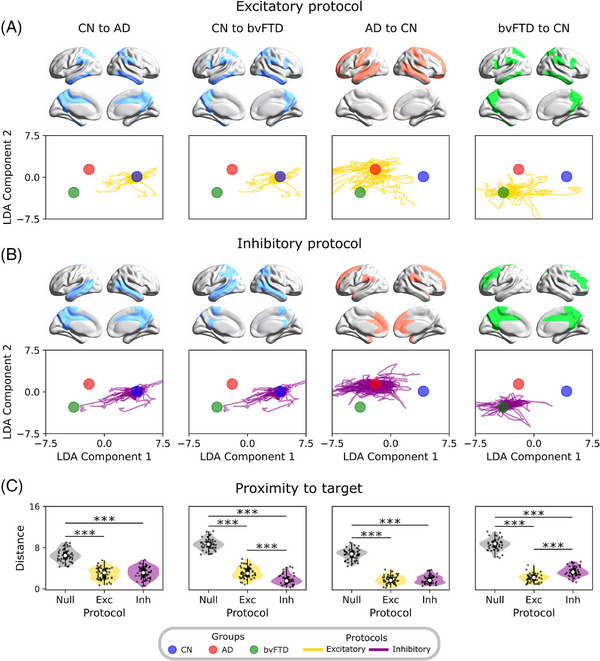
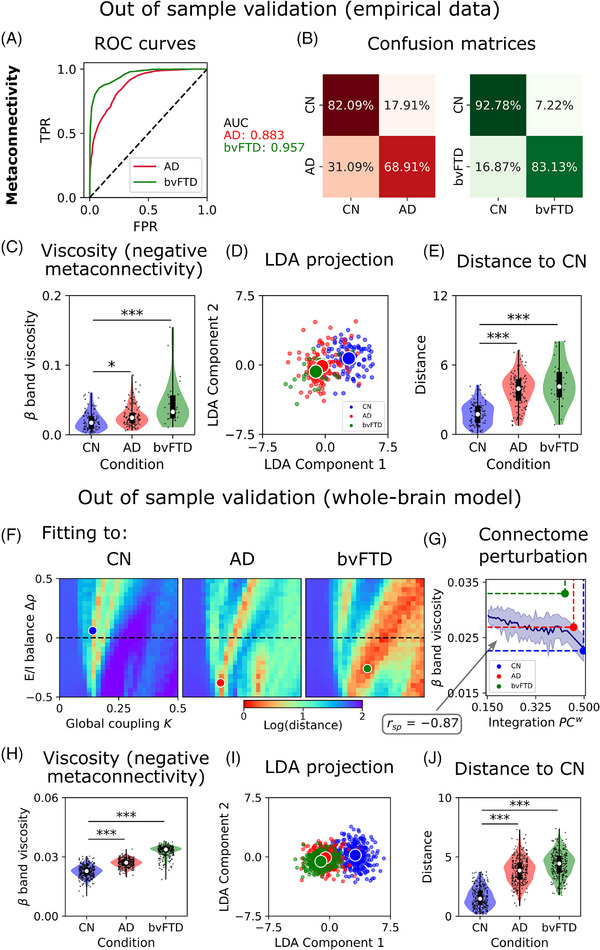
Results: Metaconnectivity outperformed pairwise connectivity and revealed more viscous dynamics in patients, with altered metaconnectivity patterns associated with multimodal disease presentation. The biophysical model showed that connectome disintegration and hypoexcitability triggered altered metaconnectivity dynamics and identified critical regions for brain stimulation. We replicated the main results in a second subset of participants for validation with unharmonized, heterogeneous recording settings.

Discussion: The results provide a novel agenda for developing mechanistic model-inspired characterization and therapies in clinical, translational, and computational neuroscience settings.

Keywords: Alzheimer's disease; electroencephalography; frontotemporal dementia; hypoexcitation; metaconnectivity; neurodegeneration; structural connectivity; whole‐brain modeling.


Conflict of interest statement

The authors declare no conflicts of interest. Author disclosures are available in the supporting information.

Figures

FIGURE 1
FIGURE 1
Pipeline for metaconnectivity dynamics estimation. A, Source reconstruction (sLORETA) was used to extract the regional time series (82 ROIs, brain regions, of the AAL parcellation). B, Signals were bandpass filtered in the common EEG frequency bands to compute functional connectivity and metaconnectivity. C, Time‐resolved functional connectivity was characterized using the sliding windows method, in which functional connectivity was estimated using fixed (8 seconds) and overlapped (80%) time windows. The procedure was performed for all frequency bands. The results of the β band are presented as an example. D, Dynamic functional connectivity matrix was built using the vectorized upper triangular of functional connectivity matrices. E, By correlating the connectivity pairs’ time series across time windows, the metaconnectivity matrices can be estimated. These matrices capture high‐order correlations (between three and four pairs of brain regions). In the example, the matrices in the β band of EEG are shown for CN, AD, and bvFTD patients. F, Dynamics viscosity is defined as the absolute sum of the negative values within the metaconnectivity matrices. β band viscosity was higher in AD and bvFTD with respect to CN. *|D| > 0.5, **|D| > 0.8, ***|D| > 1.2. Data points in violin plots correspond to subjects. Box plots were built using the first and third quartiles, the median, and the maximum and minimum values of distributions. AAL, automated anatomical labeling; AD, Alzheimer's disease; bvFTD, behavioral variant frontotemporal dementia; CN, healthy control; EEG, electroencephalography; ROI, region of interest; sLORETA, standardized low‐resolution brain electromagnetic tomography analysis.
FIGURE 2
FIGURE 2
Description of the whole‐brain computational model. A, The original Jansen and Rit neural mass model for one single cortical column (brain region) involving three populations of neurons: pyramidal neurons (blue), excitatory (orange), and inhibitory (green) interneurons. In the model, long‐range projections from and toward other cortical regions involved only pyramidal neurons. B, In our modified version of the model, we coupled two subpopulations of cortical columns (one oscillating in α, and the other in γ). The combined subpopulations formed a single cortical column. Our model also incorporates inhibitory synaptic plasticity. C, Brain areas were connected through a human empirical structural connectivity matrix (in this figure, the CN structural connectivity matrix averaged across subjects), parcellated in 82 brain regions using the AAL parcellation. This matrix is weighted and undirected (symmetric). D, Whole‐brain neural mass model simulating EEG‐like signals at the source level. The model's EEG power spectrum fitted to the CN (through functional connectivity matrices) shows two different peaks at the α and γ frequency bands. AAL, automated anatomical labeling; CN, healthy control; EEG, electroencephalography.
FIGURE 3
FIGURE 3
Spatiotemporal characterization and validation of viscosity (metaconnectivity) in AD and bvFTD. A, The area under the curve of the ROC curve was used to evaluate the performance of the classifier. Higher values (near 1) allow a good classification of healthy controls from patients. The first and second columns correspond to the features based on functional connectivity and metaconnectivity, respectively. At the left, features ranked using MRMR were added one by one, and model performance was assessed using the AUC. The minimal set of features guaranteeing the highest AUC values consisted of the optimal number of features for classification. At the right, the ROC curves for a fixed number of features (the best ones highlighted by the dotted lines). B, Confusion matrices using metaconnectivity (first row) and functional connectivity (second row). C, D, Brain regions characterized using metaconnectivity, projected on the brain's surface for AD and bvFTD. Colors indicate if the regions are involved in hypo or hyper patterns of metaconnectivity (based just on the sign of the Cohen D effect sizes). E, A trend of LDA component to be positively correlated with cognition (MoCA scores) was found, but not with (G) years with disease. G, LDA component was positively correlated with cognition, and (H) negatively correlated with years with disease. I, J, Model's scores validation through surface‐based morphometry. LDA values were associated with cortical thickness using a linear regression for every clinical group individually joined with healthy controls. To correct for multiple comparisons, a TFCE correction was used. *P < 0.05, P 0.1. AD, Alzheimer's disease; AUC, area under the curve; bvFTD, behavioral variant frontotemporal dementia; CN, healthy control; EEG, electroencephalography; LDA, linear discriminant analysis; MoCA, Montreal Cognitive Assessment; MRMR, minimal redundancy maximum relevance; ROC, receiver operating characteristic; ROI, region of interest; TFCE, threshold‐free cluster enhancement.
FIGURE 4
FIGURE 4
Fitting of the model to empirical metaconnectivity features. A–C, The two parameters of the model (global coupling, K, and change in target firing rate, Δρ) were fitted to empirical data using features based on metaconnectivity and LDA. Red values, which indicate a lower distance of the simulated features to the target empirical centroids, are a hallmark of a better fit to empirical data. D, E, Empirical and simulated data (data augmentation up to 300 models’ realizations) projected using LDA. F, Distance from each simulated data point to the CN centroid. G, The simulated data showed an increment of β band dynamics viscosity in AD and bvFTD, similar to the empirical results. H, Modeling of structural alterations in neurodegeneration. Healthy connectome disintegration (reducing structural integration), from right to left, is related to more viscous brain dynamics. Colored dots corresponded to the measurements of each group (simulated data). I, Trajectories from the healthy state (CN, high PCw) to pathological conditions. Each point in the trajectory corresponds to simulations where the connectome was sequentially perturbed decreasing its PCw. J, K, The transition from the healthy condition (CN) to the pathological ones (AD or bvFTD) involved an increment of global coupling, K, and a negative change in firing rates, Δρ, which moves the model toward hypoexcitation. In the second row, the trajectories in the LDA space corresponded to the paths marked by the black arrows in the (K,Δρ) parameter space. The initial and final combination of parameters were drawn near their respective centroids. The opposite transition in (L, M) involved a decrease in K and an increase in Δρ. *|D| > 0.5, **|D| > 0.8, ***|D| > 1.2. Data points in violin plots correspond to different model realizations (random seeds). Box plots were built using the first and third quartiles, the median, and the maximum and minimum values of distributions. Confidence intervals were built using the mean ± standard deviation. Correlations were computed using Spearman's rsp. AD, Alzheimer's disease; bvFTD, behavioral variant frontotemporal dementia; CN, healthy control; E/I, excitatory/inhibitory; LDA, linear discriminant analysis.
FIGURE 5
FIGURE 5
Perturbational approach mediating the transitions between states. A, B, The excitatory and inhibitory perturbation protocols were used to produce transitions from AD or bvFTD to CN and vice versa. These consisted of perturbating single pairs of homotopic regions, producing trajectories that corresponded to different perturbation magnitudes. C, Evaluation of protocols’ performance by measuring the distance from the best point on the trajectories to the target centroid. Lower distance values indicate a better performance. *|D| > 0.5, **|D| > 0.8, ***|D| > 1.2. Data points in violin plots correspond to different model realizations (random seeds). Box plots were built using the first and third quartiles, the median, and the maximum and minimum values of distributions. The colored areas on the brains’ surface represent the best perturbation targets to drive the transitions, for each perturbation protocol. AD, Alzheimer's disease; bvFTD, behavioral variant frontotemporal dementia; CN, healthy control; LDA, linear discriminant analysis.
FIGURE 6
FIGURE 6
Out‐of‐sample validation of whole‐brain metaconnectivity and mechanisms. A, ROC curves and AUC values for AD and bvFTD. B, Confusion matrices. C, Dynamic viscosity is defined as the absolute sum of the negative values within the metaconnectivity matrices. β band viscosity was higher in AD and bvFTD with respect to CN. D, Empirical data projected using LDA. E, Distance from each empirical data point to the CN centroid. F, Two parameters fitting (global coupling, K, and change in target firing rate, Δρ) of the model to empirical data using features based on metaconnectivity and LDA. Red values, which indicate a lower distance of the simulated features to the target empirical centroids, are a hallmark of a better fit to empirical data. G, Healthy connectome disintegration (reducing structural integration) from right to left is related to more viscous brain dynamics. Colored dots corresponded to the measurements of each group (simulated data). H, The simulated data showed an increment of β band dynamics viscosity in AD and bvFTD, similar to the empirical results. I, Simulated data (data augmentation up to 300 models’ realizations) projected using LDA. J, Distance from each simulated data point to the CN centroid. *|D| > 0.5, **|D| > 0.8, ***|D| > 1.2. Data points in violin plots correspond to different model realizations (random seeds) and subjects. Box plots were built using the first and third quartiles, the median, and the maximum and minimum values of distributions. Confidence intervals were built using the mean ± standard deviation. Correlations were computed using Spearman rsp. AD, Alzheimer's disease; bvFTD, behavioral variant frontotemporal dementia; CN, healthy control; LDA, linear discriminant analysis; ROC, receiver operating characteristic.

References

    1. Greene AS, Shen X, Noble S, et al. Brain – phenotype models fail for individuals who defy sample stereotypes. Nature. 2022;609(7925):109‐118. doi: 10.1038/s41586-022-05118-w - DOI - PMC - PubMed
    1. Livingston G, Huntley J, Sommerlad A, et al. Dementia prevention, intervention, and care: 2020 report of the Lancet Commission. The Lancet. 2020;396(10248):413‐446. doi: 10.1016/S0140-6736(20)30367-6 - DOI - PMC - PubMed
    1. Fatumo S, Chikowore T, Choudhury A, Ayub M, Martin AR, Kuchenbaecker K. A roadmap to increase diversity in genomic studies. Nat Med. 2022;28(2):243‐250. doi: 10.1038/s41591-021-01672-4 - DOI - PMC - PubMed
    1. Precision medicine needs an equity agenda. Nat Med. 2021;27(5):737‐737. doi: 10.1038/s41591-021-01373-y - DOI - PubMed
    1. Fittipaldi S, Legaz A, Maito M, et al. Heterogeneous factors influence social cognition across diverse settings in brain health and age‐related diseases. Nature Mental Health. 2024;2(1):63‐75. doi: 10.1038/s44220-023-00164-3 - DOI

Publication types