

Assessing the mechanism of fast-cycling cancer-associated mutations of Rac1 small Rho GTPase
- PMID: 38501467
- PMCID: PMC10949326
- DOI: 10.1002/pro.4939
Assessing the mechanism of fast-cycling cancer-associated mutations of Rac1 small Rho GTPase
Abstract
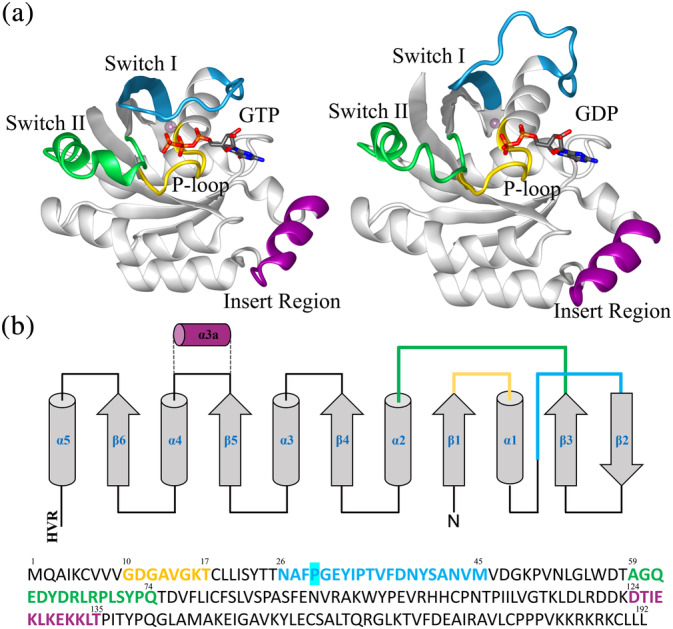
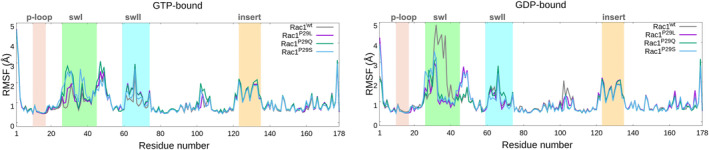
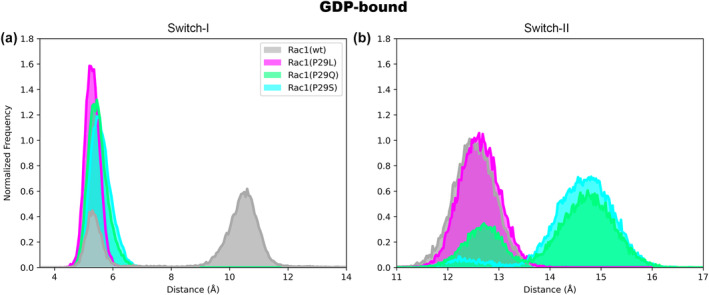
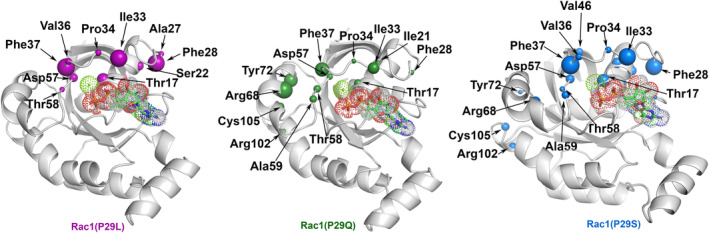
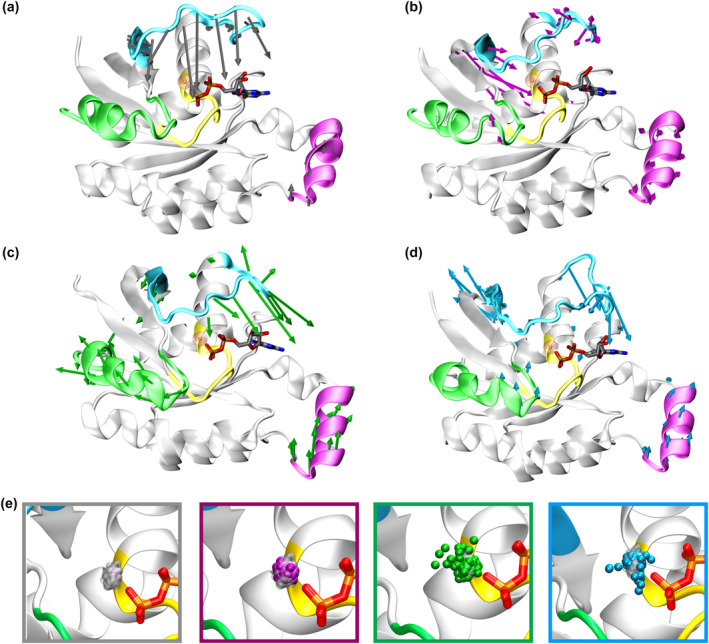
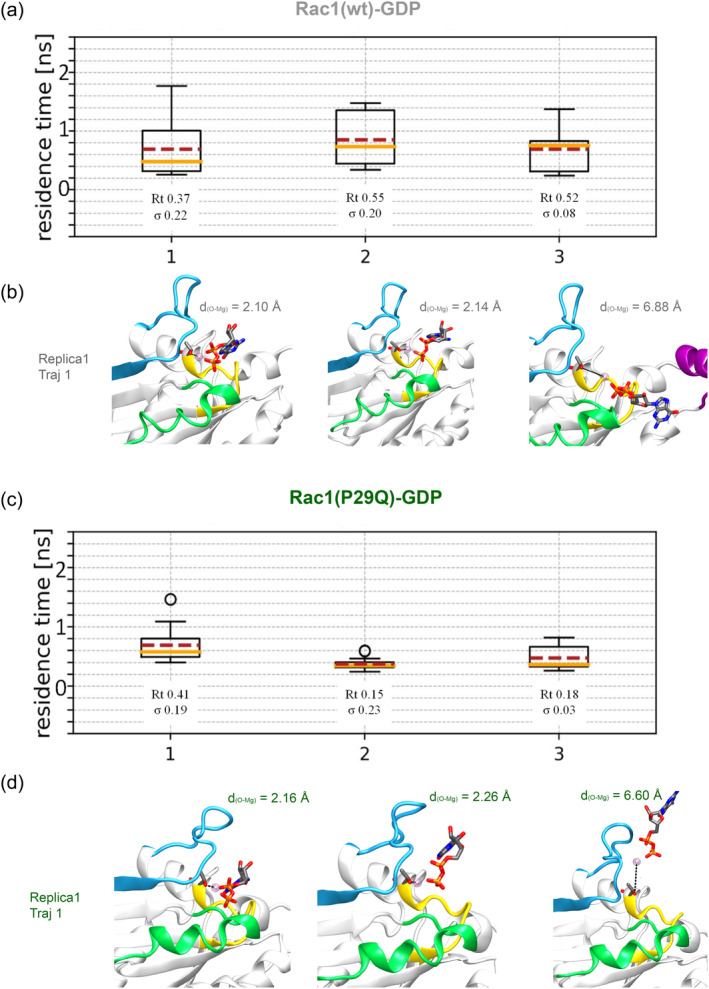
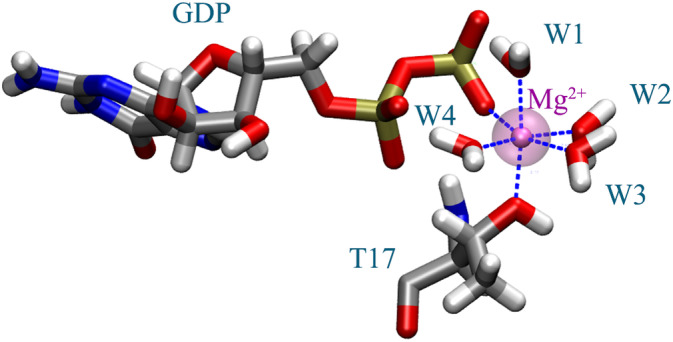
Rho-GTPases proteins function as molecular switches alternating from an active to an inactive state upon Guanosine triphosphate (GTP) binding and hydrolysis to Guanosine diphosphate (GDP). Among them, Rac subfamily regulates cell dynamics, being overexpressed in distinct cancer types. Notably, these proteins are object of frequent cancer-associated mutations at Pro29 (P29S, P29L, and P29Q). To assess the impact of these mutations on Rac1 structure and function, we performed extensive all-atom molecular dynamics simulations on wild-type (wt) and oncogenic isoforms of this protein in GDP- and GTP-bound states. Our results unprecedentedly elucidate that P29Q/S-induced structural and dynamical perturbations of Rac1 core domain weaken the binding of the catalytic site Mg2+ ion, and reduce the GDP residence time within protein, enhancing the GDP/GTP exchange rate and Rac1 activity. This broadens our knowledge of the role of cancer-associated mutations on small GTPases mechanism supplying valuable information for future drug discovery efforts targeting specific Rac1 isoforms.
Keywords: druggable cysteines; fast-cycling mutations in cancer; molecular dynamics simulations; point mutations; small-GTPases.
© 2024 The Protein Society.
Conflict of interest statement
The authors declare no conflict of interest.
Figures
Similar articles
-
Structural and functional characterization of fast-cycling RhoF GTPase.Biochem Biophys Res Commun. 2019 May 28;513(2):522-527. doi: 10.1016/j.bbrc.2019.04.018. Epub 2019 Apr 10. Biochem Biophys Res Commun. 2019. PMID: 30981505
-
Assessing the Mechanism of Rac1b: An All-Atom Simulation Study of the Alternative Spliced Variant of Rac1 Small Rho GTPase.J Chem Inf Model. 2024 Dec 23;64(24):9474-9486. doi: 10.1021/acs.jcim.4c01376. Epub 2024 Dec 5. J Chem Inf Model. 2024. PMID: 39632743
-
GTP Binding and Oncogenic Mutations May Attenuate Hypervariable Region (HVR)-Catalytic Domain Interactions in Small GTPase K-Ras4B, Exposing the Effector Binding Site.J Biol Chem. 2015 Nov 27;290(48):28887-900. doi: 10.1074/jbc.M115.664755. Epub 2015 Oct 9. J Biol Chem. 2015. PMID: 26453300 Free PMC article.
-
Rho family GTPases: more than simple switches.Trends Cell Biol. 2000 Oct;10(10):415-9. doi: 10.1016/s0962-8924(00)01832-8. Trends Cell Biol. 2000. PMID: 10998597 Review.
-
Biochemical analyses of the Wrch atypical Rho family GTPases.Methods Enzymol. 2006;406:11-26. doi: 10.1016/S0076-6879(06)06002-2. Methods Enzymol. 2006. PMID: 16472646 Review.
Cited by
-
Structural Dynamics of Rho GTPases.J Mol Biol. 2025 Feb 1;437(3):168919. doi: 10.1016/j.jmb.2024.168919. Epub 2024 Dec 19. J Mol Biol. 2025. PMID: 39708912 Review.
-
Quantifying small GTPase activation status using a novel fluorescence HPLC-based assay.J Biol Chem. 2025 Jun;301(6):108545. doi: 10.1016/j.jbc.2025.108545. Epub 2025 Apr 24. J Biol Chem. 2025. PMID: 40286847 Free PMC article.
References
-
- Abraham MJ, Murtola T, Schulz R, Páll S, Smith JC, Hess B, et al. GROMACS: high performance molecular simulations through multi‐level parallelism from laptops to supercomputers. SoftwareX. 2015;1–2:19–25.
-
- Andersen HC. Rattle: a “velocity” version of the shake algorithm for molecular dynamics calculations. J Comput Phys. 1983;52:24–34.
-
- Bakan A, Meireles LM, Bahar I. ProDy: Protein dynamics inferred from theory and experiments. Bioinformatics. 2011;27(11):1575–1577. Available from: https://academic.oup.com/bioinformatics/article/27/11/1575/217006 - PMC - PubMed
-
- Barbosa GD, Liu X, O'Harra KE, Bara JE, Turner CH. Charge scaling parameter evaluation for multivalent ionic liquids with fixed point charge force fields. J Ionic Liq. 2022;2:100020.
MeSH terms
Substances
Grants and funding
LinkOut - more resources
Full Text Sources
Medical
Research Materials
Miscellaneous
